Back story
I have a longstanding history with ME/CFS from 2006 – diagnosed with EBV at the time
The primary concerns are: fatigue, PEM, brain fog, exacerbation of symptoms prior to menstrual cycle (PMDD), ADHD, POTS (improving), anxiety, PCOS. The fatigue and PEM is the main concern. Many other symptoms recently improved.
I’m currently taking L. rhamnosus, D-ribose, methylated B-complex, berberine, maitake, magnesium citrate, copper niacin and started myo-inositol after submitting the sample. I was also taking saccharomyces boulardii for weeks leading up to the sample collection. I’ve discontinued it since then. I would like to change my diet in general, but first want to see what’s recommended. Also particularly unsure about oxalates and whether or not to continue the maitake mushroom.
I’m also curious to try oxaloacetate,
Interestingly enough, I had rather extreme vaginal discharge and discomfort for many months, which completely went away within a couple of weeks of using a probiotic mix. I stopped this probiotic (it had 7 strains, I believe) and the discharge has not returned, although fatigue is worse (but other things also changed).
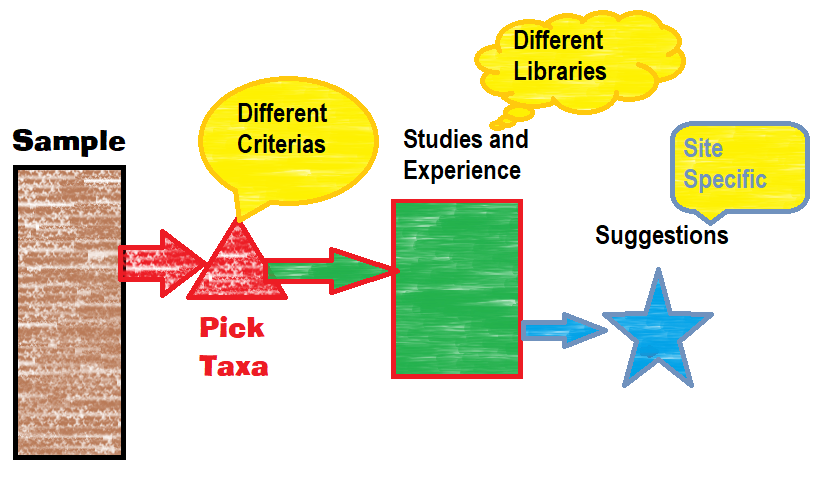
Analysis
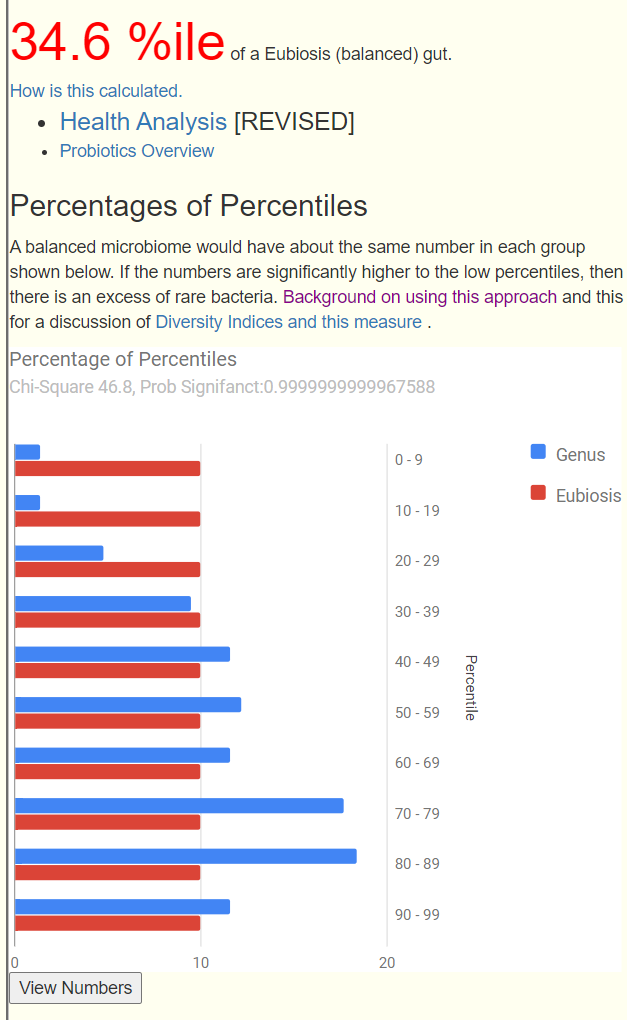
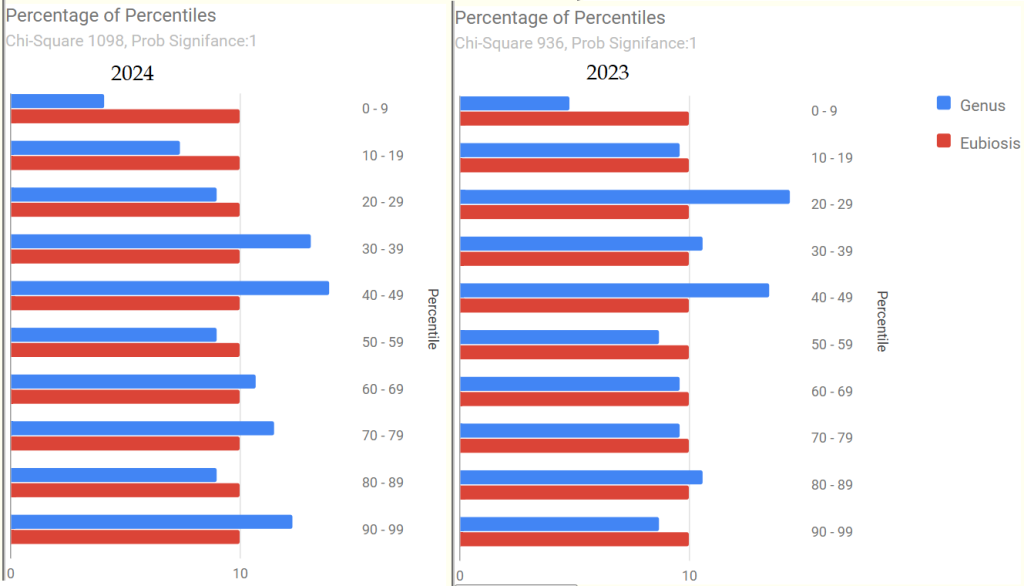
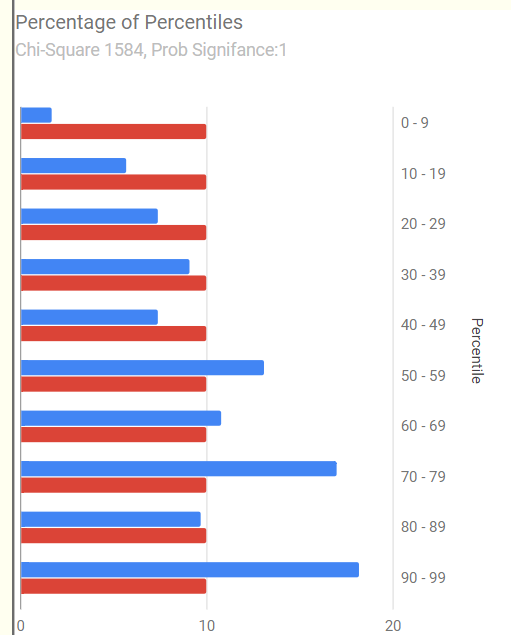
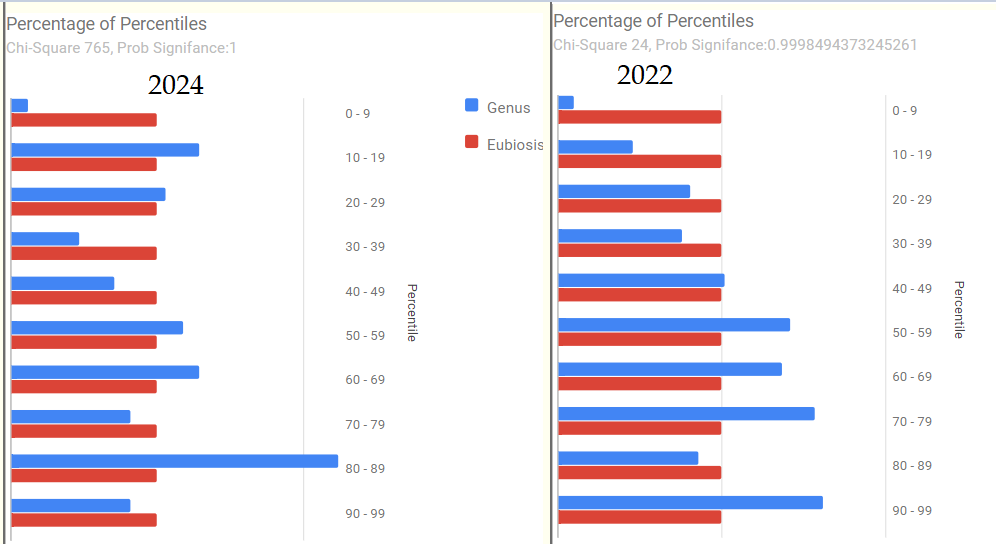
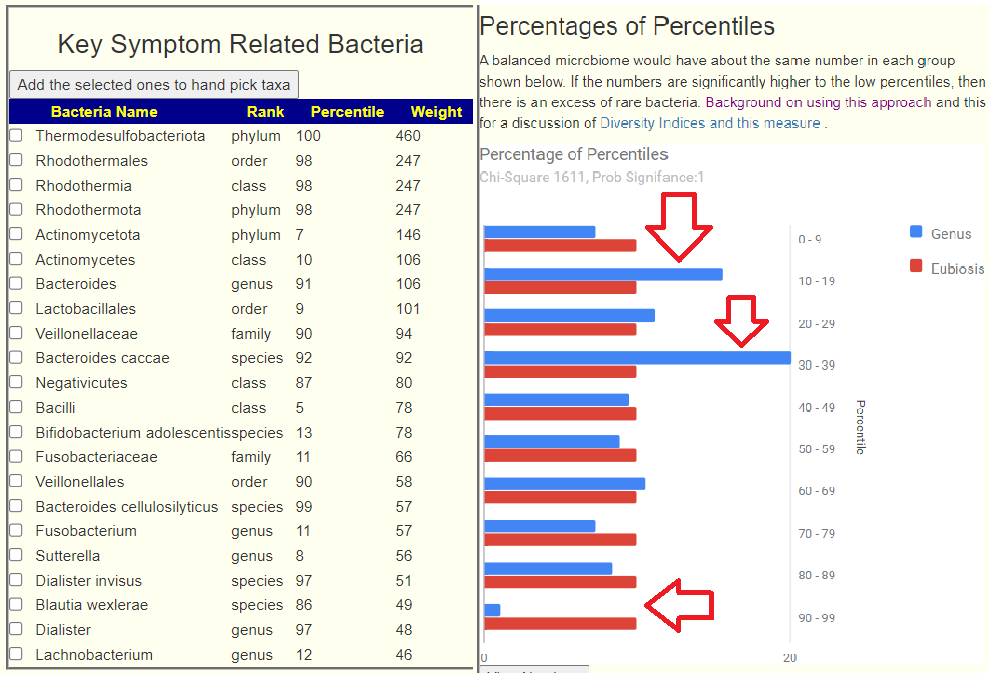
The graphic overview is shown below. There are clearly a group of bacteria that are overgrown (70-89%ile) and other bacteria that rarely have token representations (0 -29%ile). This does not identify the bacteria but identifies misrepresentations (thus dysbiosis)
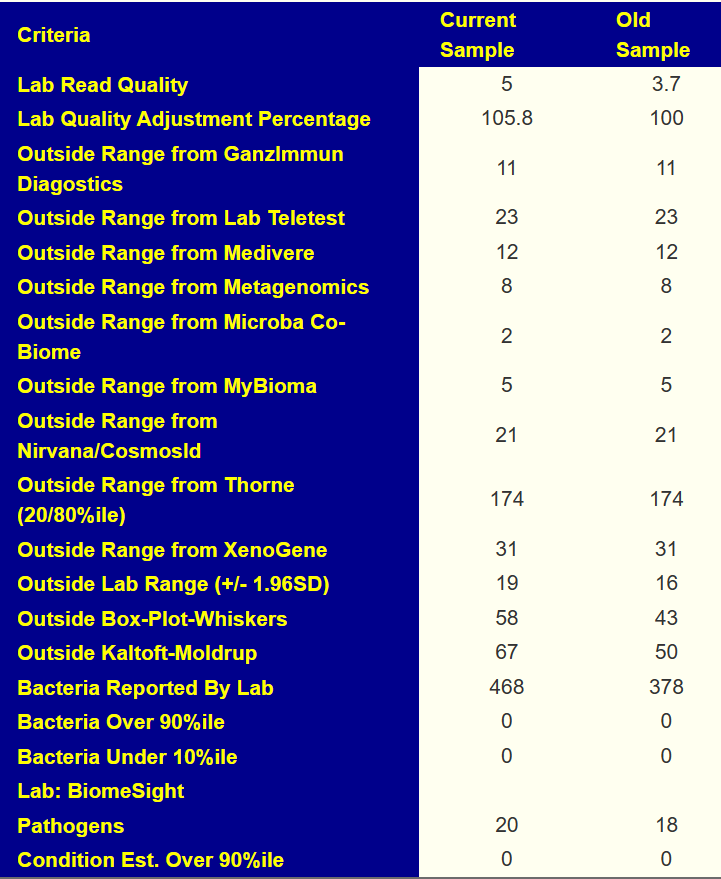
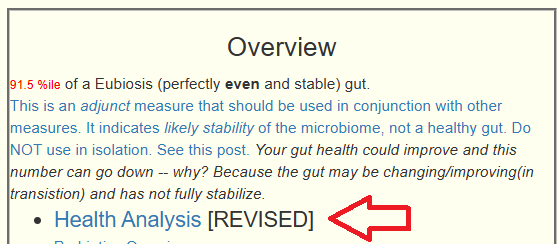
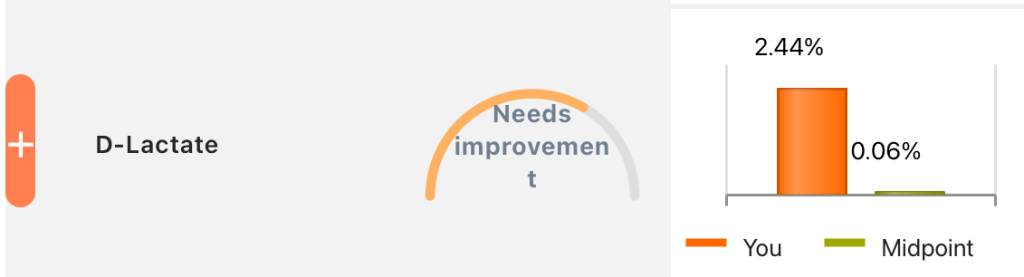
Looking at General Health Predictors, we see 12 items of concern, higher than seen in most reviews. Both Oxalate degrading and Oxalate producing at below 1%ile. Dr. Jason Hawrelak criteria came in at 78%ile
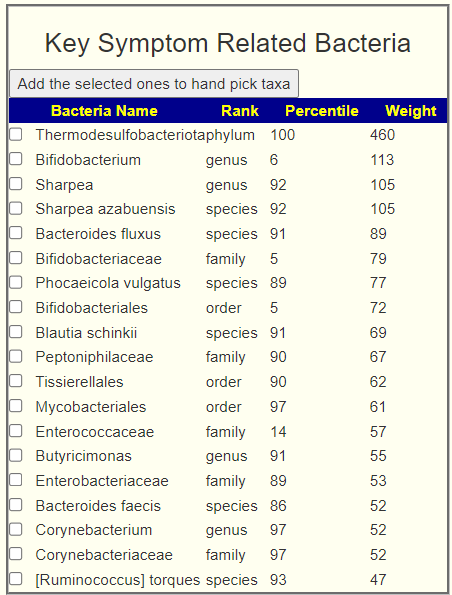
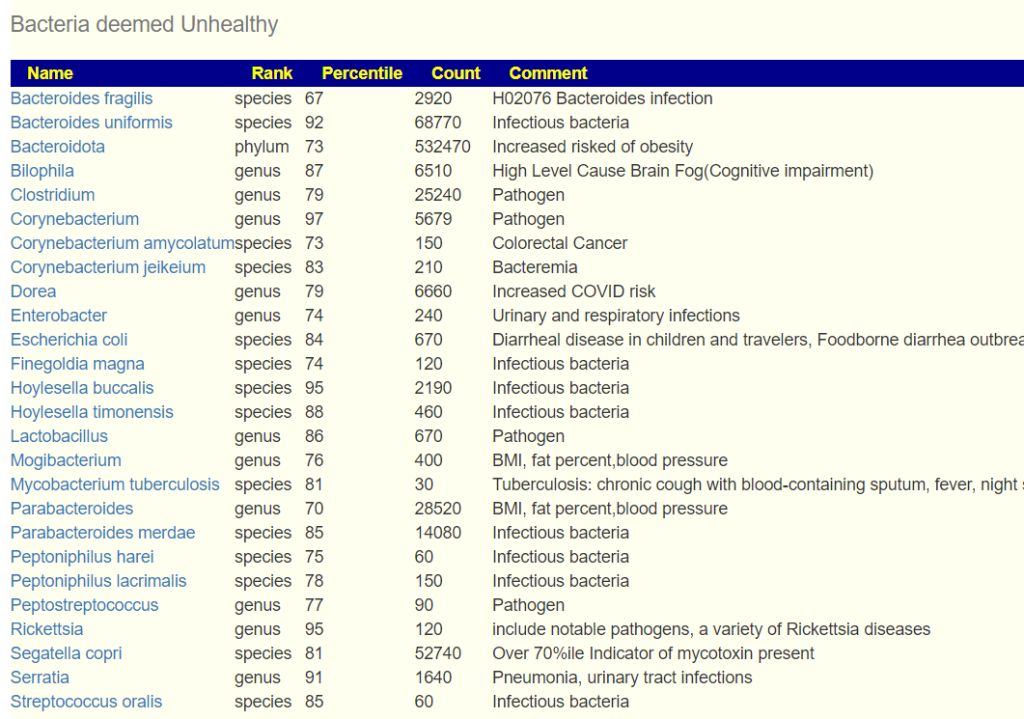
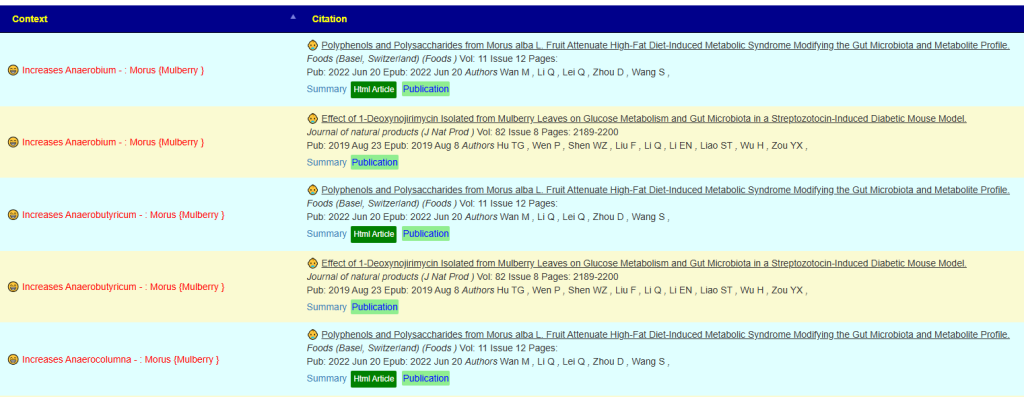
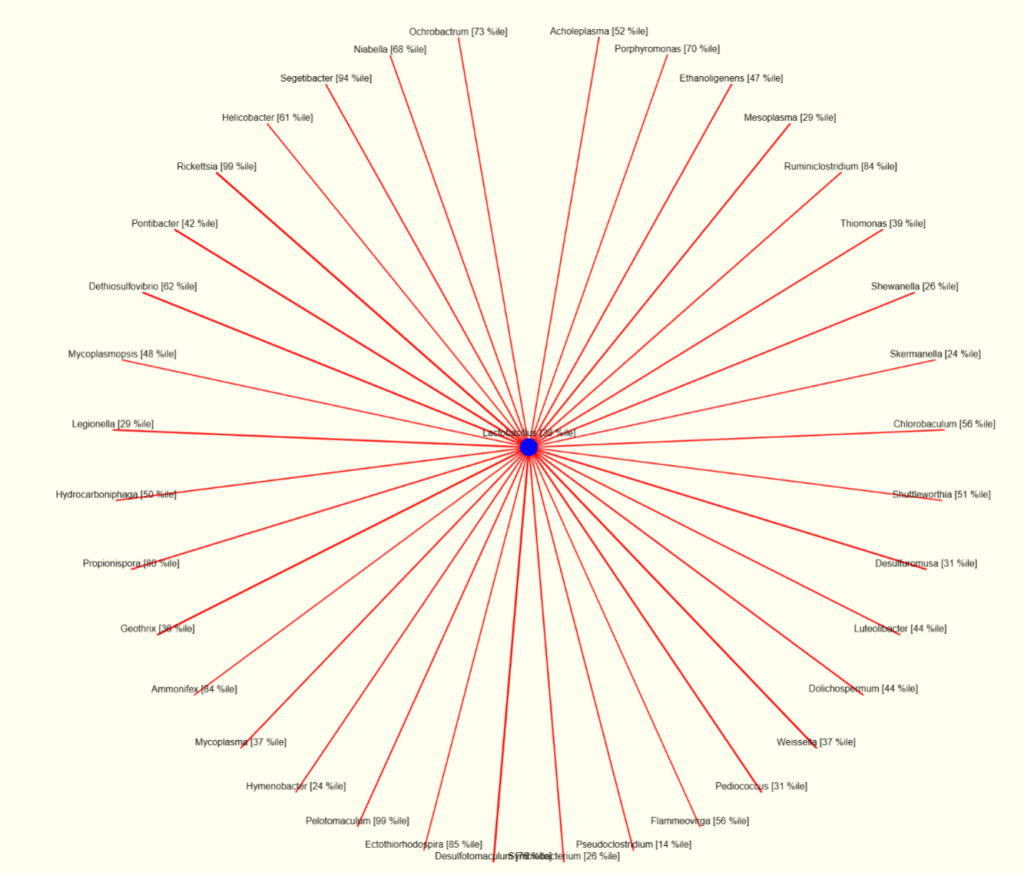
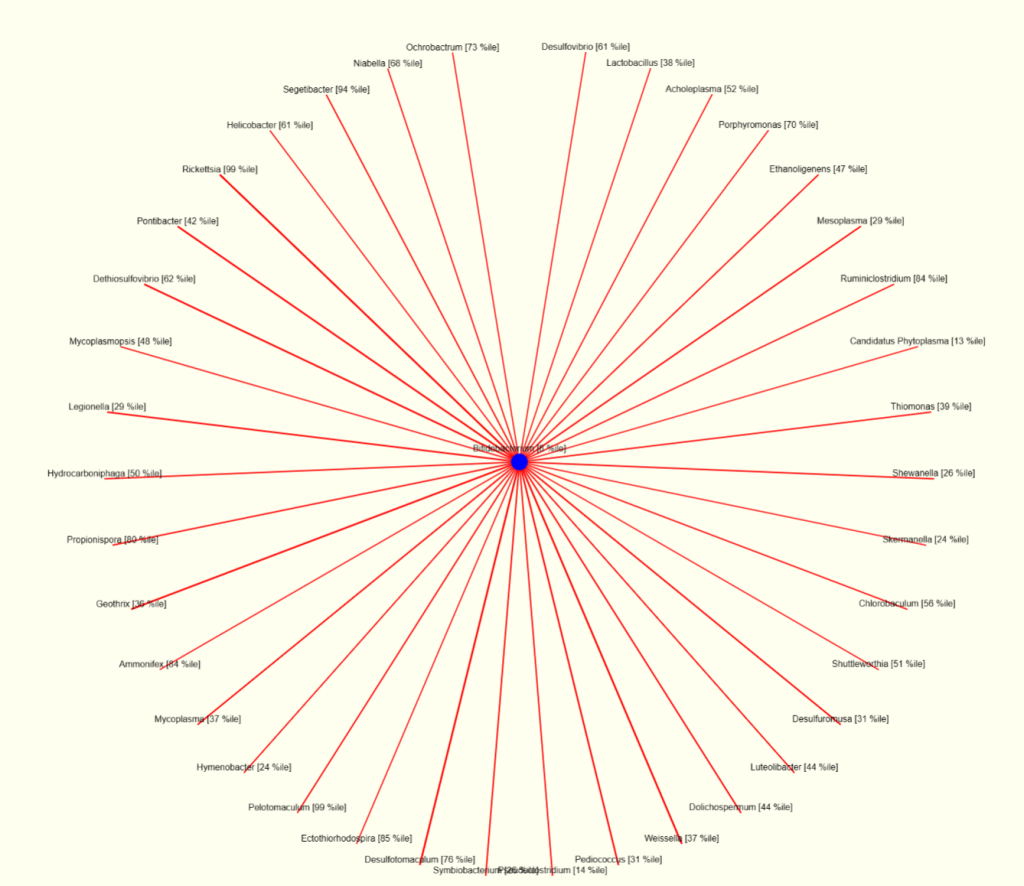
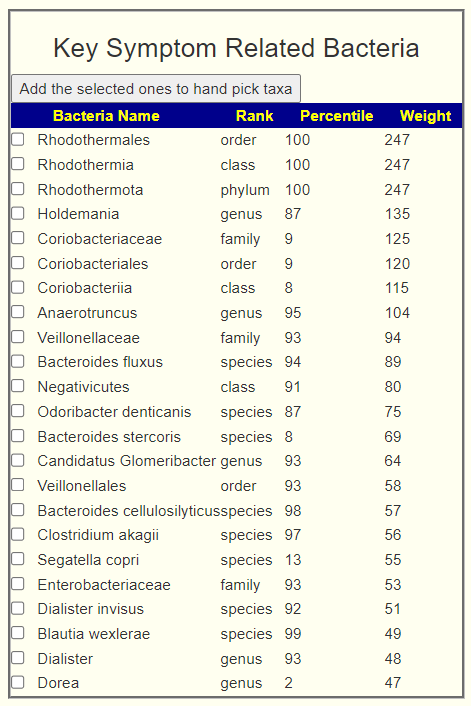
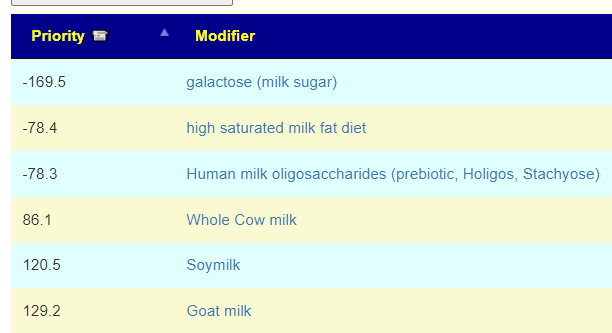
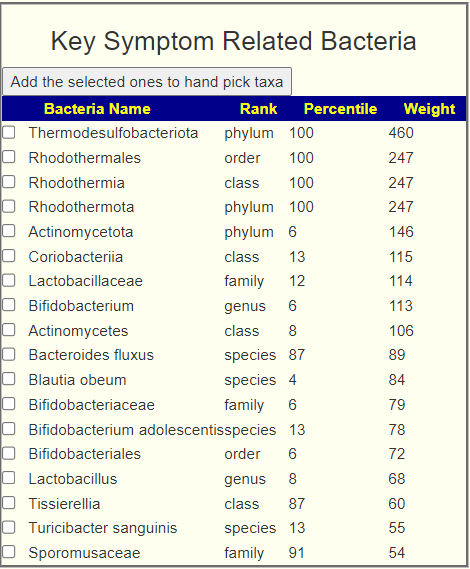
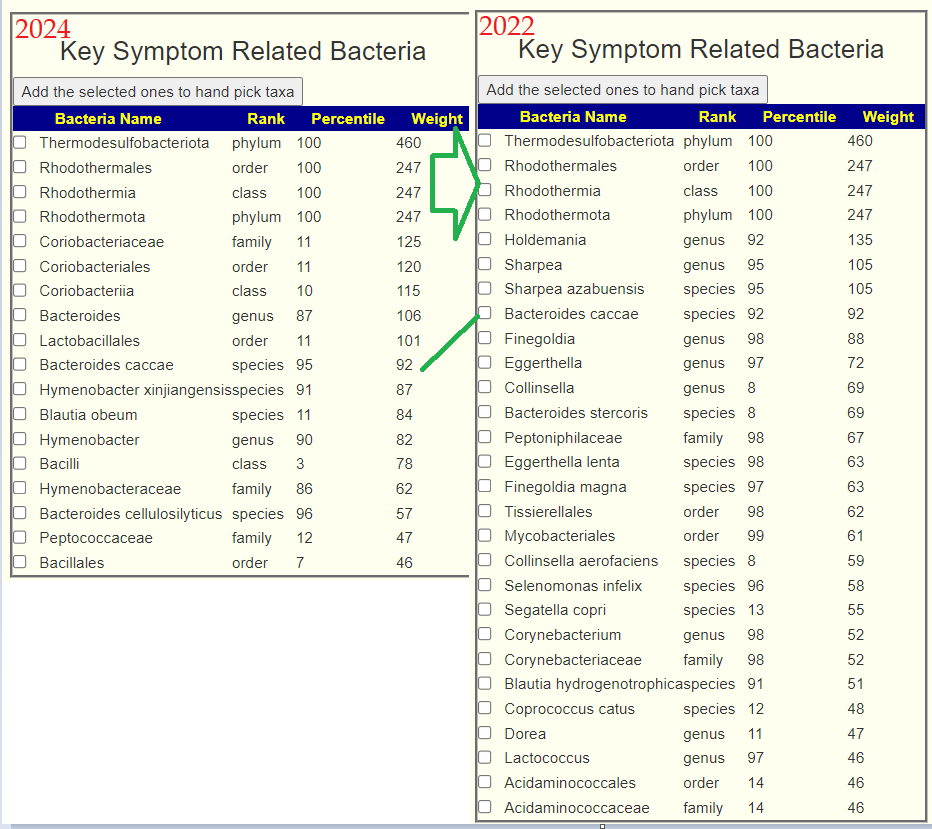
We have quite a number of bacteria strongly statistically associated symptoms and others associated with with health risks.
Going Forward
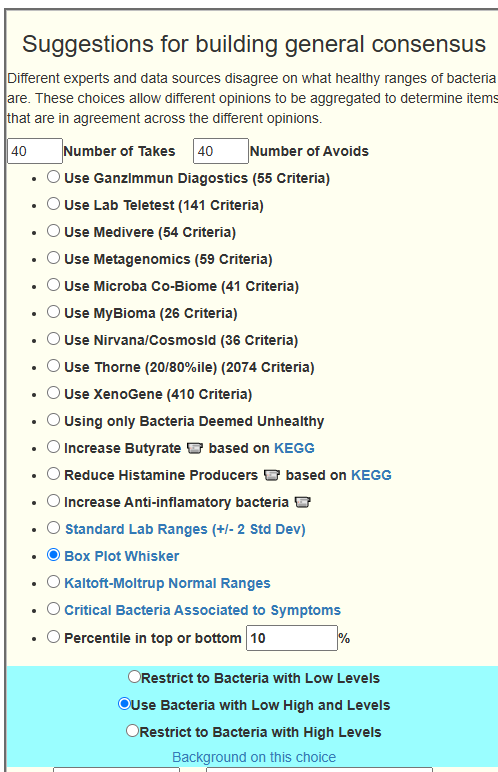
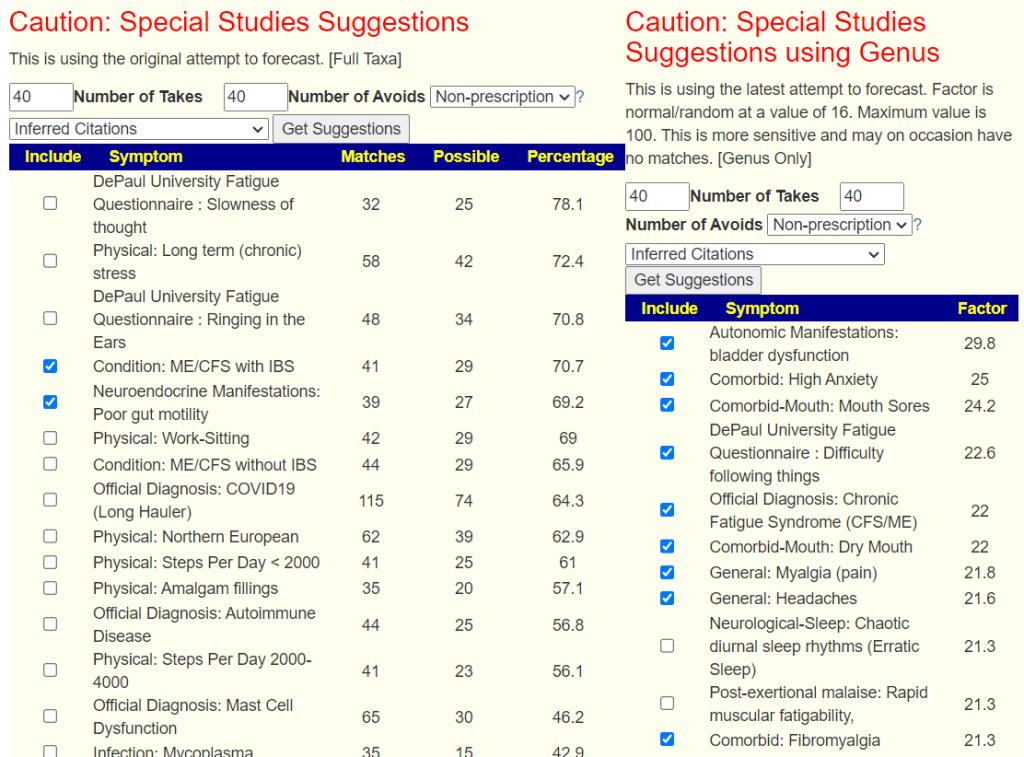
Where there are many issues wrong, I do not attempt to work bacteria by bacteria — instead, I trust the expert system to consider and balance all of the factors in a consistent and logical method. This is especially with the revised algorithm (see Algorithm for “Just Give Me Suggestions” with symptoms) . It inherited included items that in the past I have done as extra suggestions.
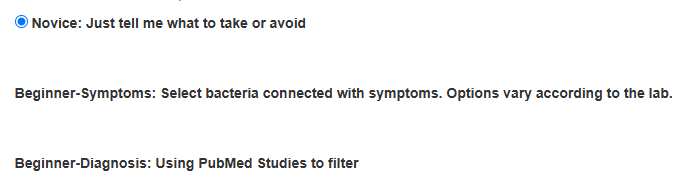
I have recently added new option to make the analysis simpler.

Items to Take
Today, I am working on several other posts from ME/CFS and the suggestions here are very similar to those suggestions (just different orders). Spices and herbs can be done as capsules, teas, oils or just putting on food.
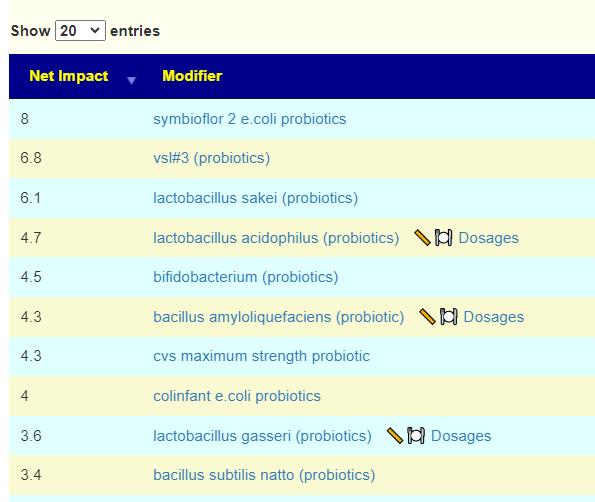
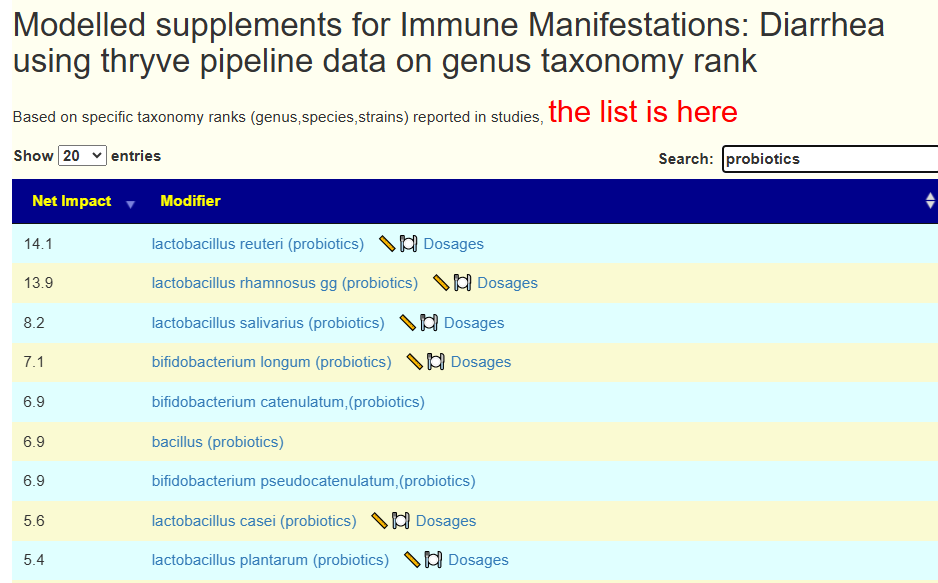
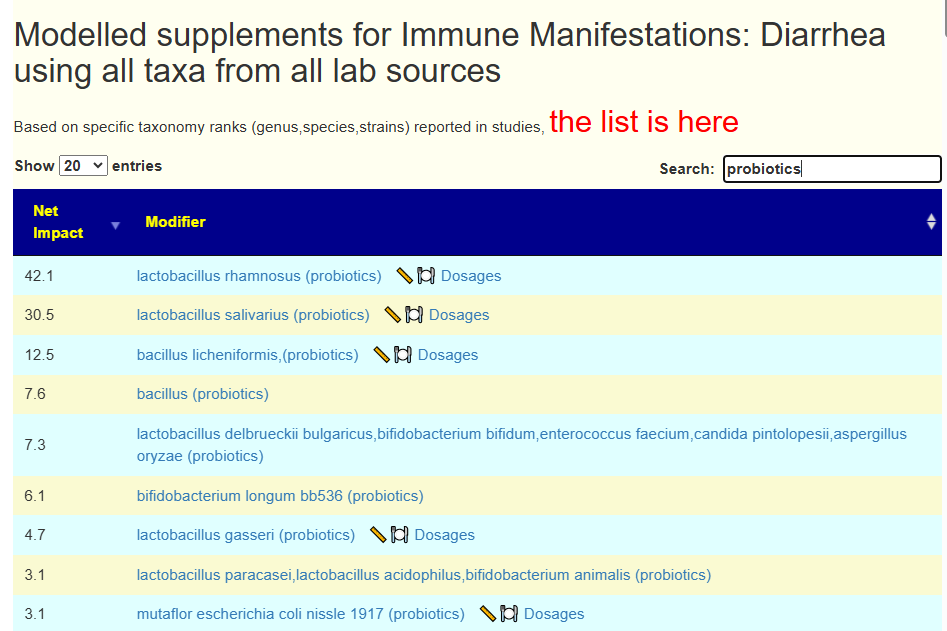
Looking at probiotics, we have a good number that would allow easy rotation of probiotics. Two are usually difficult to obtain: lactobacillus kefiri and lactobacillus sakei . Most are available at my usual two preferred sources: Custom Probiotics and Indian Bulk Exporter (Maple Life Sources). See this list for sources not available there. By rotation, I mean 20-50 BCFU daily of one probiotic for 2 weeks and then change to another probiotic.
Items to Avoid
- proton-pump inhibitors (prescription)
Suggestions look very “old-school ME/CFS”
By old school, I mean what was reported to help most people on the ancient egroup list CFSFMExperimental. Namely:
- Whey (non-denatured was thought the best)
- B-Vitamins
- Bidifobacteria probiotics (little Lactobacillus)
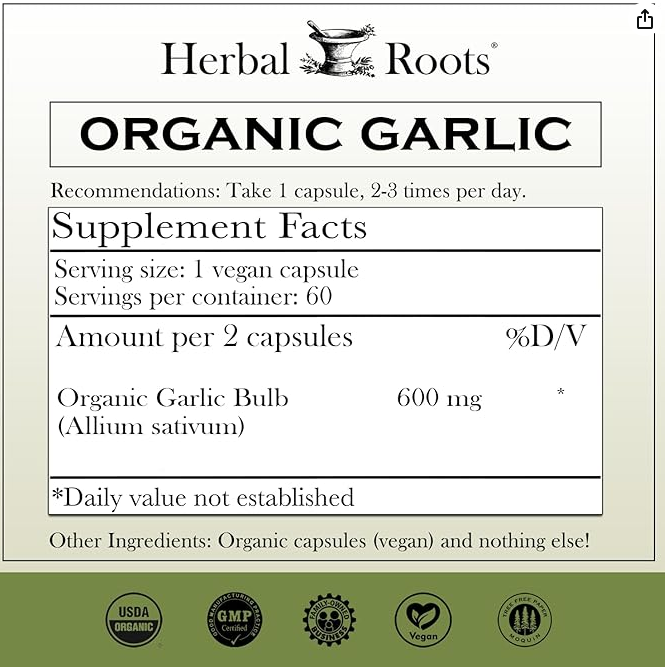
For all items, I would suggest checking for sufficient therapeutic dosages here. The dosages on bottoms usually are maintenance and insufficient to be therapeutic. Example: Neem at 120mg/day which is 3 “00” capsules per day (just measured it!). Garlic is 4 grams per day – typically 4 commercial 1000mg capsules per day (double or more of the dosages on bottles). As you can see below, recommended dosages may be just 1/3 of that.
My general rule of thumb is 1 “00” capsule with each meal for most herbs. We make our own capsules using organic powders without fillers. Cheaper and better quality than commercial pills.
Remember, with herbs and probiotics you do not want to take the same one continuously. Take each set for 1-2 weeks and then rotate to another. For example
- Week 1: Clove and Oregano
- Week 2: Tulsi and Neem
- Week 3: Shen Ling Bai Zhu San and rosa rugosa
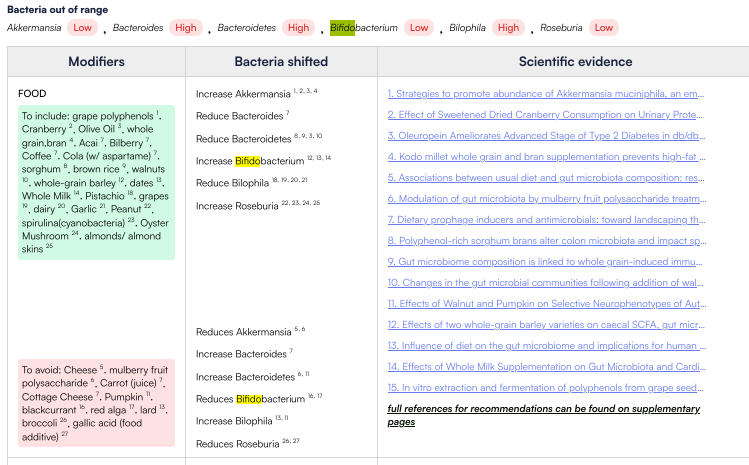
You should check each to see if they have adverse effect on whatever probiotics you may take concurrently. For example Shen Ling Bai Zhu San and rosa rugosa both are reported to increase Bifidobacterium — so taking Bifidobacterium with them is fine.
Postscript – and Reminder
I am not a licensed medical professional and there are strict laws where I live about “appearing to practice medicine”. I am safe when it is “academic models” and I keep to the language of science, especially statistics. I am not safe when the explanations have possible overtones of advising a patient instead of presenting data to be evaluated by a medical professional before implementing.
I cannot tell people what they should take or not take. I can inform people items that have better odds of improving their microbiome as a results on numeric calculations. I am a trained experienced statistician with appropriate degrees and professional memberships. All suggestions should be reviewed by your medical professional before starting.
The answers above describe my logic and thinking and is not intended to give advice to this person or any one. Always review with your knowledgeable medical professional.


Recent Comments