In reviewing many papers with the microbiome I noticed that often the researchers restrict their examinations to the taxa that is reported in all samples. I suspect this is due to a lack of sufficient statistical training and/or not understanding the natures of the microbiome.
Recently I came across these papers that uses an approach that I often have used, working off relative frequency of detection a.k.a. prevalence.
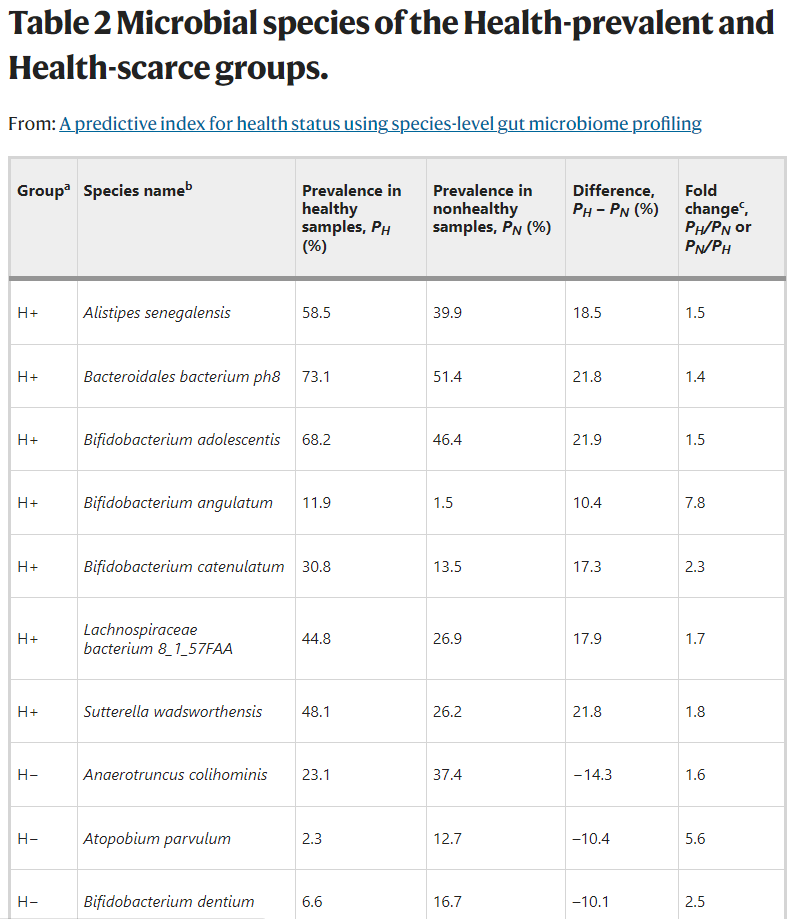
- A predictive index for health status using species-level gut microbiome profiling [2020]
- Gut Microbiome Wellness Index 2 for Enhanced Health Status Prediction from Gut Microbiome Taxonomic Profiles [2023]
- GMWI-webtool: a user-friendly browser application for assessing health through metagenomic gut microbiome profiling [2023]
This post is going to use samples available at Microbiome Prescription Citizen Science site. We are going to restrict to one lab source and divide the data into two groups based on their self-declare symptoms and diagnosis.
- Patients with Myalgic encephalomyelitis/chronic fatigue syndrome (ME/CFS) declared [Obs: 271]
- Patients without Myalgic encephalomyelitis/chronic fatigue syndrome (ME/CFS) declared and other status declared (for example: “Asymptomatic” [Obs:569]
Naive First Pass
We are going to take the average count for each group ignoring no values reported. We are going to restrict it to taxa where we have at least 30 non-zero values [1,564 taxa]. We found some 77 taxa with a t-score over 2.81 (p < 0.005)
| taxa name | taxa rank | Shift | T_score |
| Prevotella copri | species | low in ME/CFS | -5.27 |
| Prevotella | genus | low in ME/CFS | -4.52 |
| Sporolactobacillaceae | family | low in ME/CFS | -4.2 |
| Sporolactobacillus putidus | species | low in ME/CFS | -4.19 |
| Sporolactobacillus | genus | low in ME/CFS | -4.19 |
| Prevotellaceae | family | low in ME/CFS | -4.1 |
| Firmicutes | phylum | high in ME/CFS | 3.94 |
| Blautia | genus | high in ME/CFS | 3.91 |
| Cetobacterium ceti | species | high in ME/CFS | 3.89 |
| Cetobacterium | genus | high in ME/CFS | 3.84 |
Deeming Not Reported to be Zero
In this case we have 78 taxa with a t-score over 2.81 with slight changes of t-scores.
| taxa name | taxa rank | Shift | T_score |
| Prevotella copri | species | low in ME/CFS | -5.31 |
| Sporolactobacillaceae | family | low in ME/CFS | -4.63 |
| Sporolactobacillus putidus | species | low in ME/CFS | -4.62 |
| Sporolactobacillus | genus | low in ME/CFS | -4.62 |
| Prevotella | genus | low in ME/CFS | -4.5 |
| Prevotella oulorum | species | low in ME/CFS | -4.35 |
| Prevotellaceae | family | low in ME/CFS | -4.08 |
| Bifidobacterium gallicum | species | low in ME/CFS | -3.97 |
| Firmicutes | phylum | high in ME/CFS | 3.94 |
| Blautia | genus | high in ME/CFS | 3.91 |
Prevalence
We followed the same process as above and limited things to a Chi-2 probability of < 0.005 (as used above) We ended up with 65 taxa.
| tax_Name | Tax_Rank | Prevalence in MECFS % | Prevalence Control % | Difference | Chi2 | FoldChange |
| Deferribacteres | phylum | 33.6 | 20 | 13.5 | 14 | 1.7 |
| Erysipelothrix inopinata | species | 21 | 10.7 | 10.3 | 14 | 2 |
| Deferribacterales | order | 33.6 | 20 | 13.5 | 14 | 1.7 |
| Deferribacteraceae | family | 33.6 | 20 | 13.5 | 14 | 1.7 |
| Deferribacteres | class | 33.6 | 20 | 13.5 | 14 | 1.7 |
| Mogibacterium vescum | species | 27.7 | 15.8 | 11.9 | 13 | 1.8 |
| Haploplasma cavigenitalium | species | 8.5 | 2.8 | 5.7 | 13 | 3 |
| Haploplasma | genus | 8.5 | 2.8 | 5.7 | 13 | 3 |
| Gluconobacter | genus | 15.1 | 6.9 | 8.3 | 13 | 2.2 |
| Prosthecobacter fluviatilis | species | 7.7 | 2.5 | 5.3 | 12 | 3.1 |
Comparing these two lists, we found only 6 taxa in common
- Bifidobacterium angulatum
- Propionigenium modestum
- Pseudomonas viridiflava
- Cetobacterium ceti
- Cetobacterium
- Propionigenium
The next result is that we have 78+65 – 6 = 137 statistically significant bacteria with p < 0.005.
Bottom Line
There are at least two different statistical ways of determining significance. IMHO, the prevalence approach is likely to be a superior tool for diagnosis purposes because it is possible to compute the probability of a match to the above patterns despite some bacteria not being reported.
The full list of bacteria is listed here.
Recent Comments