This is a part of a series of Technical Notes on Microbiome Analysis
For a while I have been using a variation of this concept for 16s samples that I have reviewed. The concept is very simple to a statistician:
Percentiles is converting data into a native uniform distribution. If you sample for 1000 boxes where each box has 100 balls numbered 1-100, then you expect the distribution of the balls samples to be uniform. It they are not, then something is definitely unfair.
Concept
With the microbiome things are a little more complex because a high in a single strain may push it species into high and thus the genus into high. We could do independent levels, for example species only or genus only. The problem is that the population size starts to drop and thus the sensitivity decreases as a result.
I happen to have a small collection of shotgun samples processed through CosmosID. Their report give percentile for most of what they measure. Getting accurate percentiles requires large sample sizes.
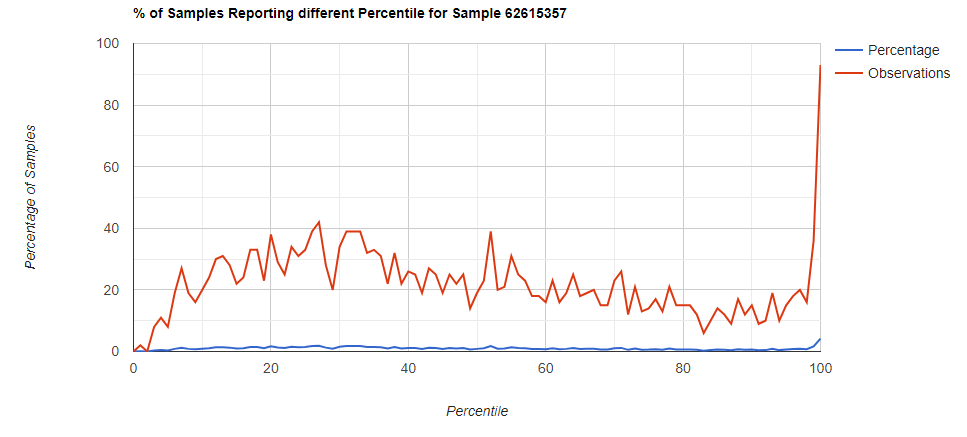
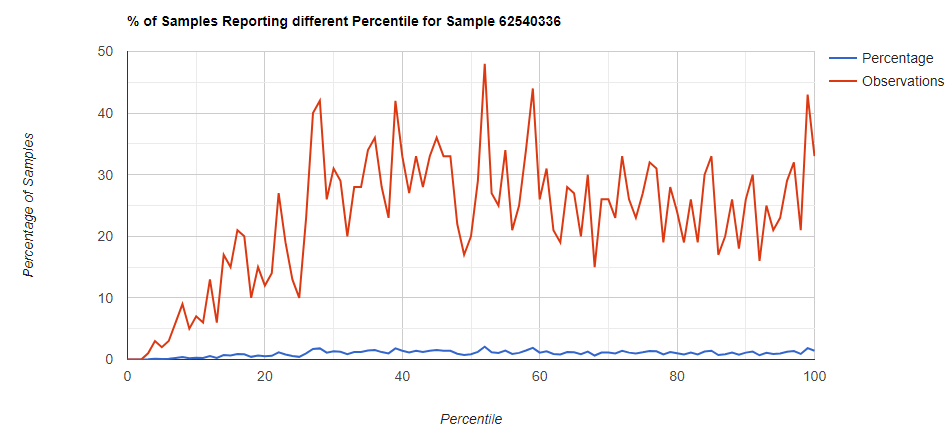
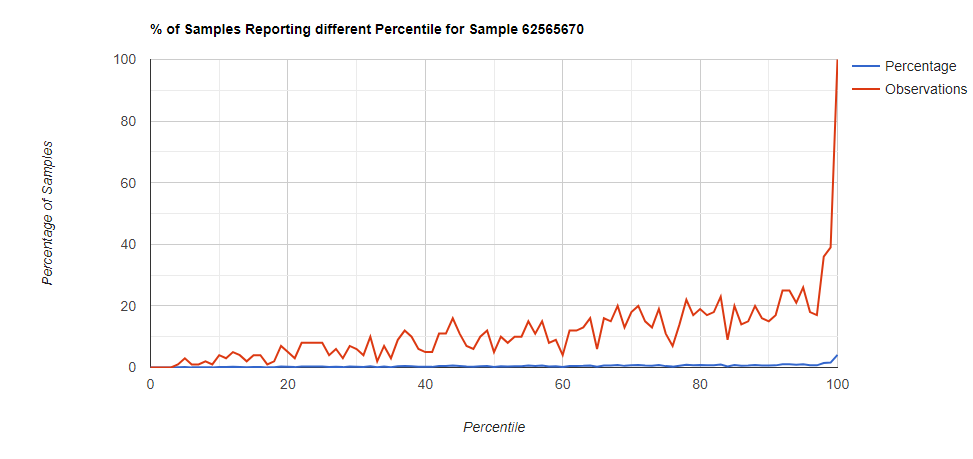
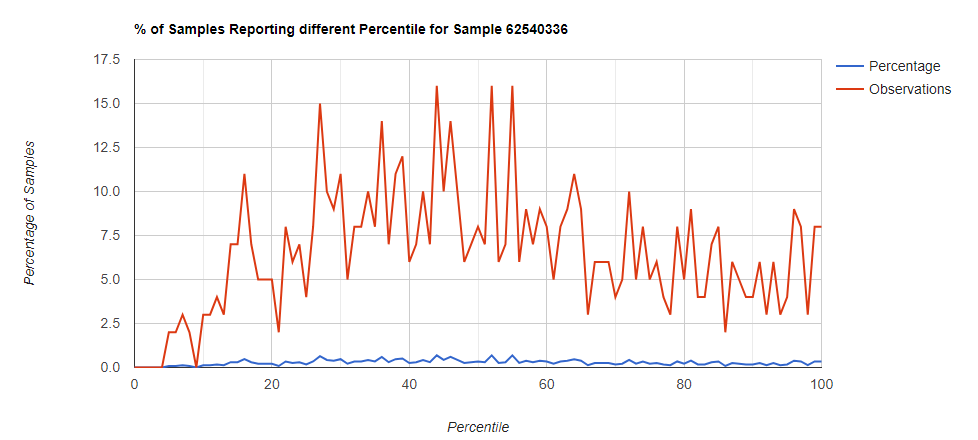
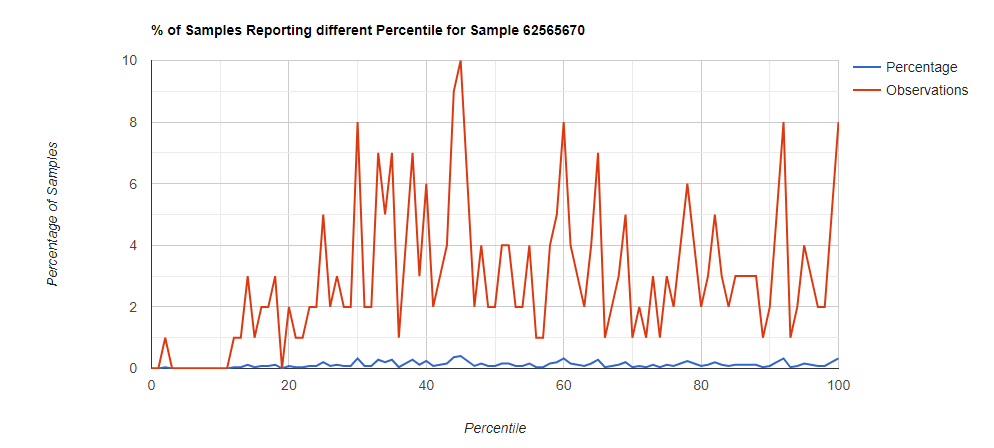
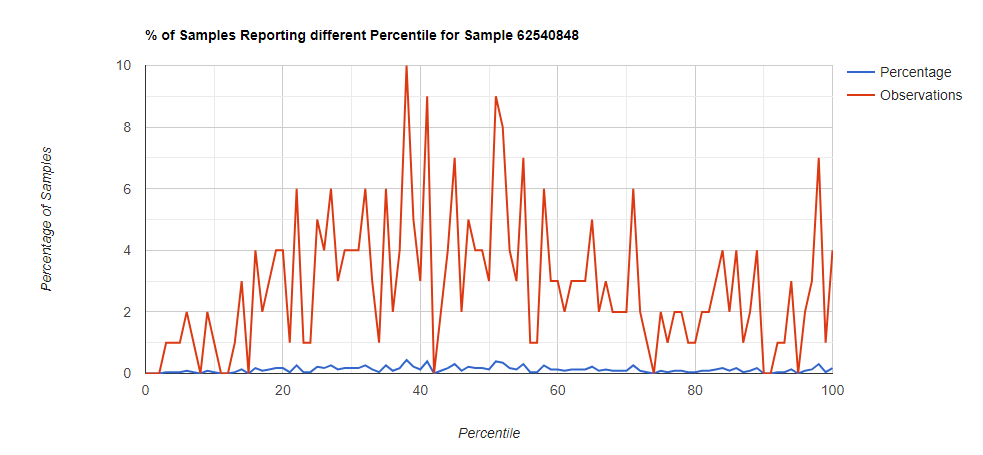
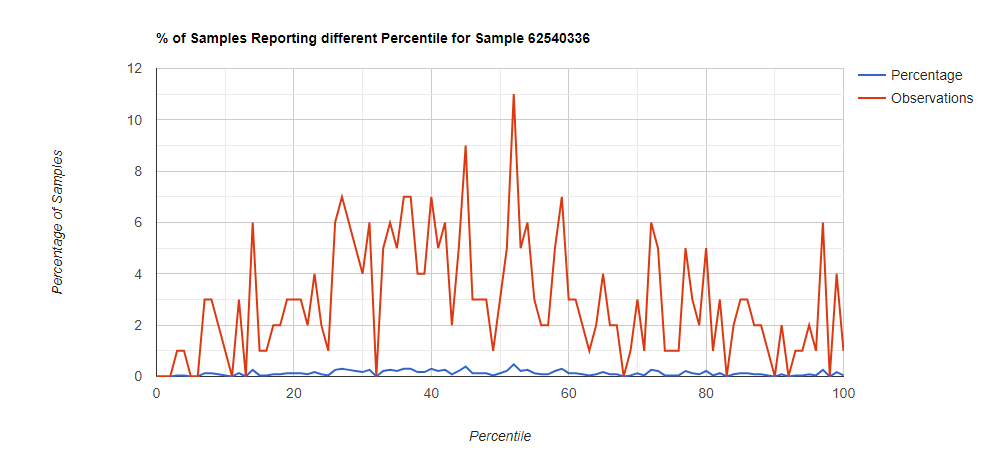
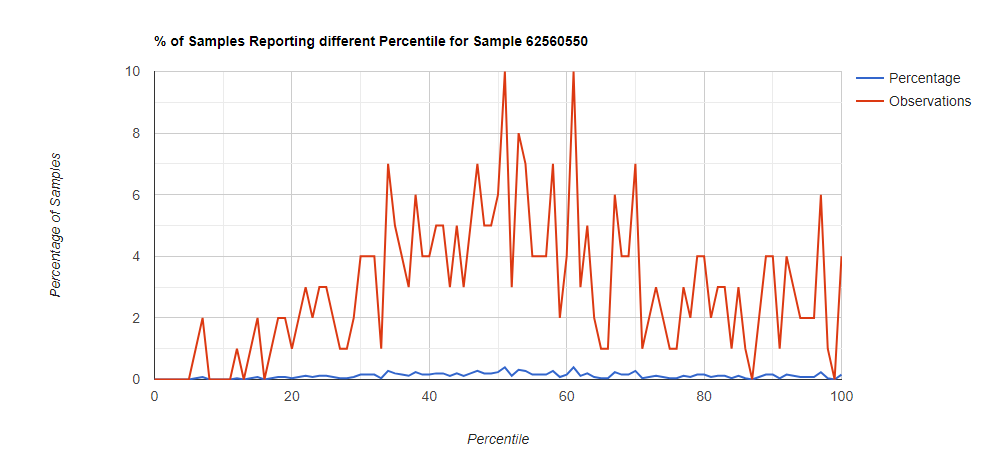
Below I have charted the results with single percentile ranges from reports that have between 2000 and 5000 different biological units reported. I have charted using different approach (the kitchen sink and then select taxological levels).
All of these samples are from people with health issues. Note that the numbers come from rounding so 100% is just 99.5 to 100 (and not 99.5 to 100.5) so the spikes at 100 is likely twice as high.
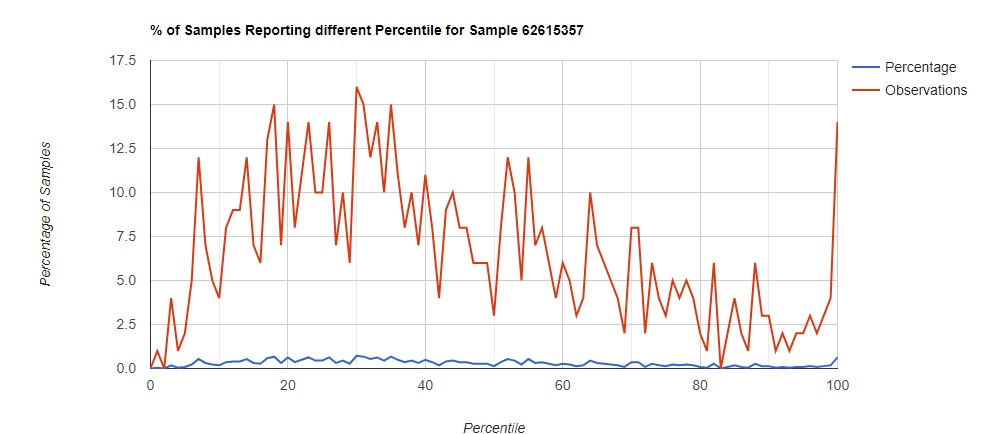
Kitchen Sink
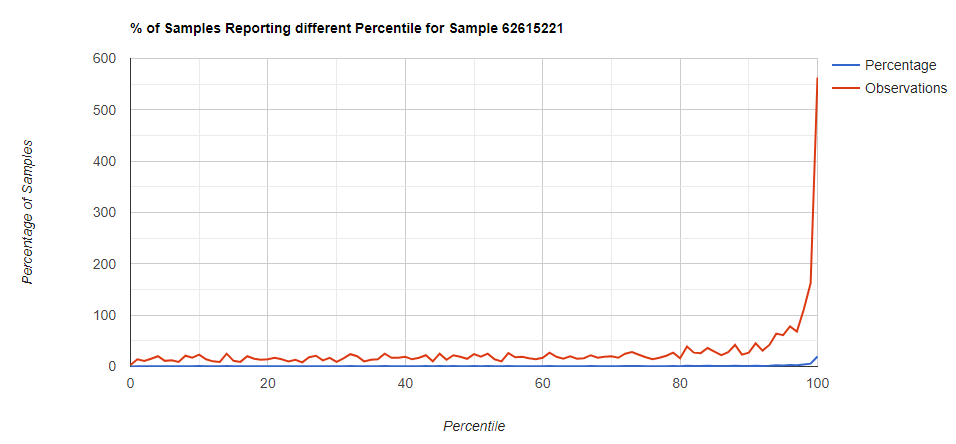
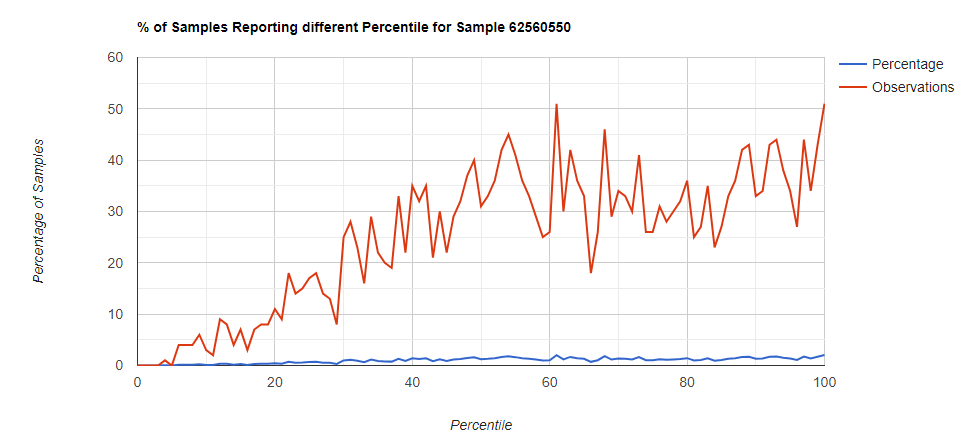
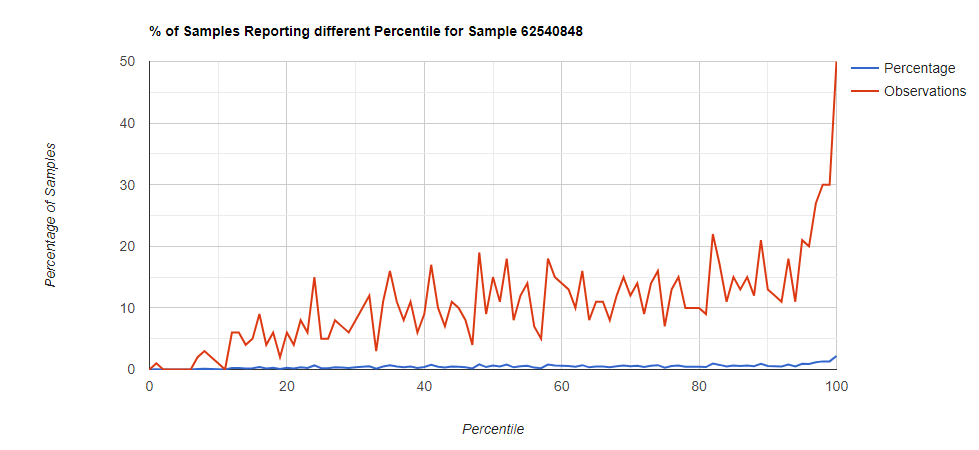
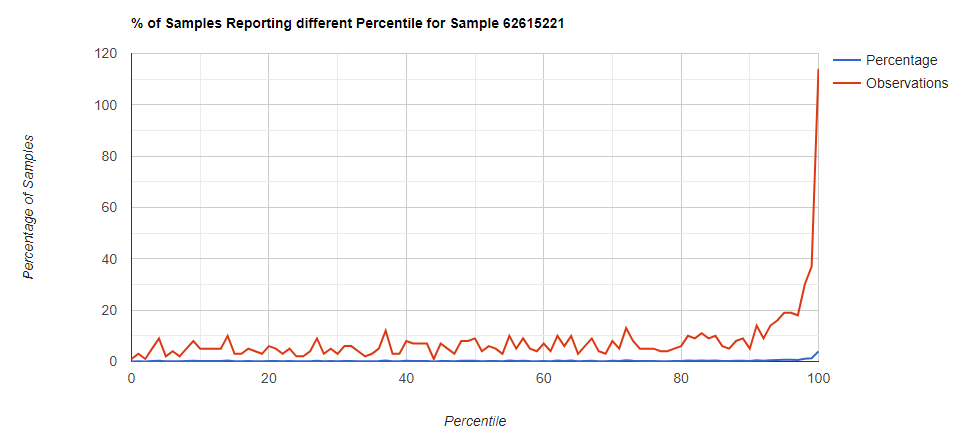
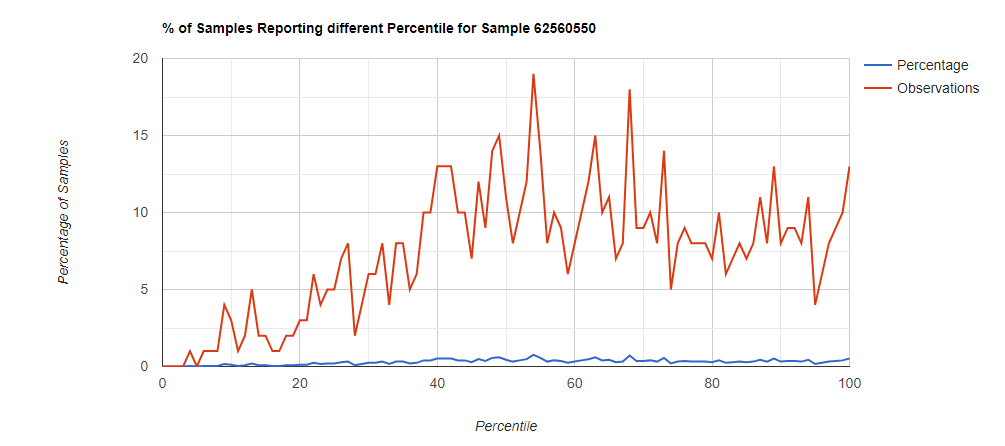
Filter to Species Only
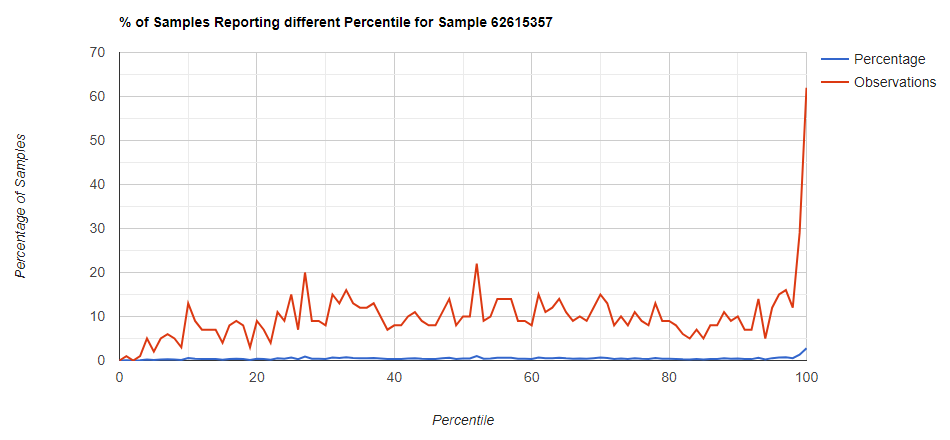
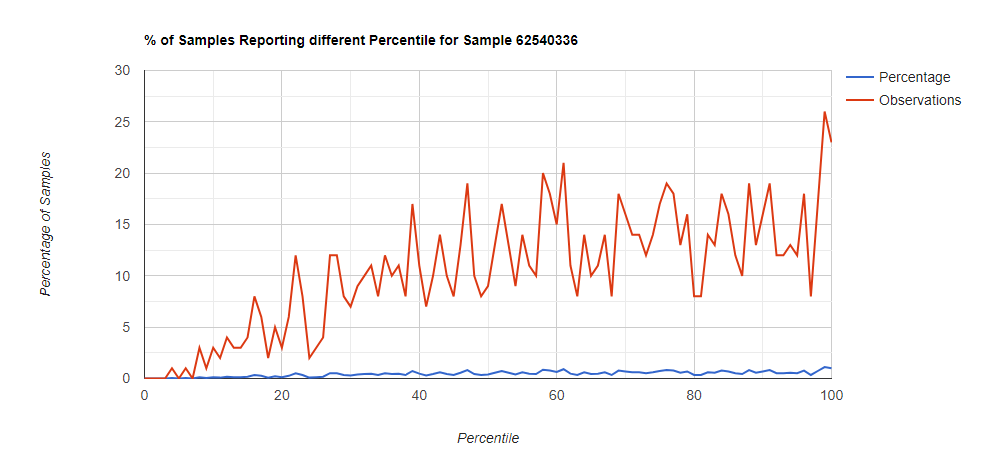
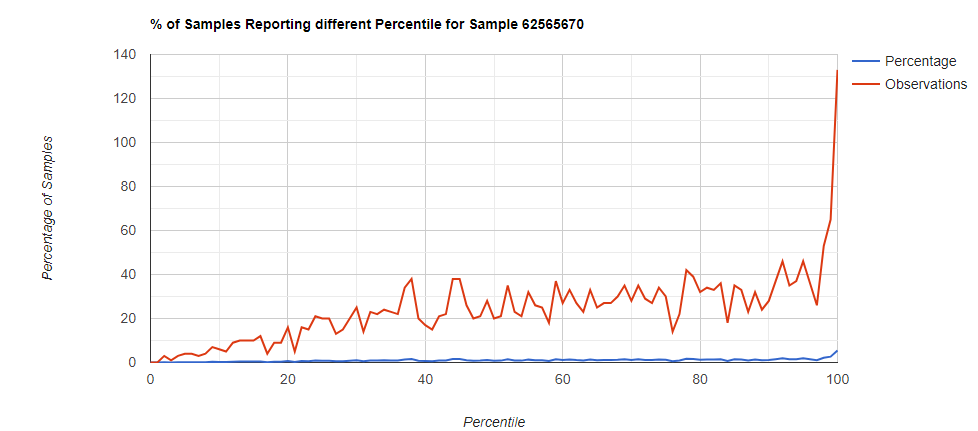
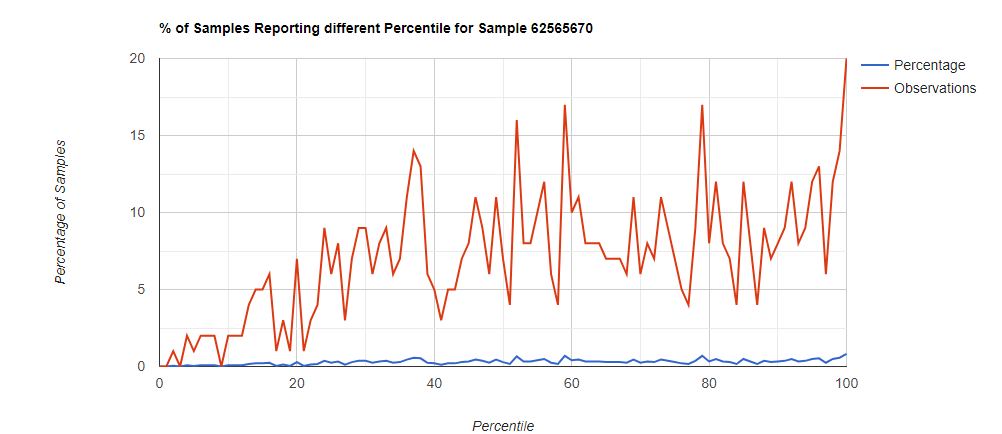
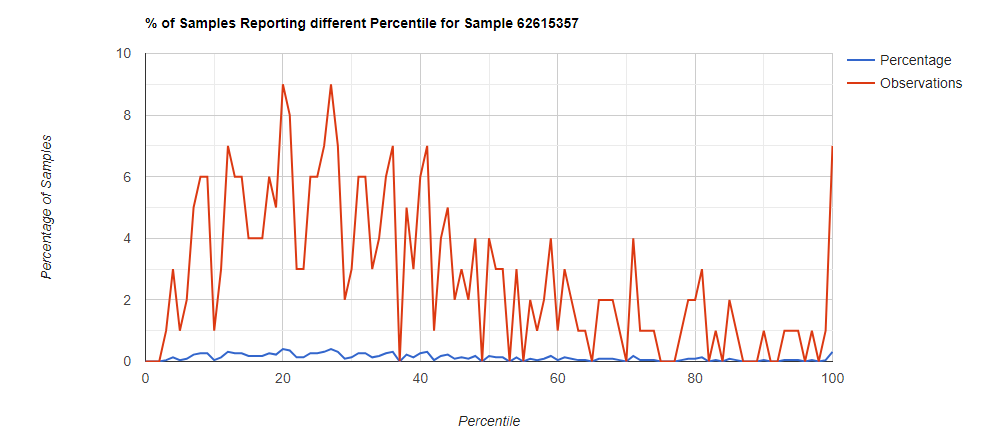
Genus Level
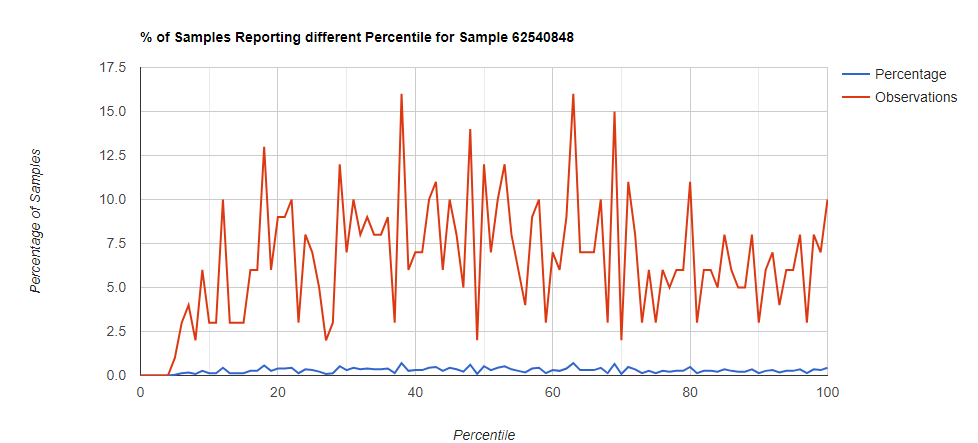
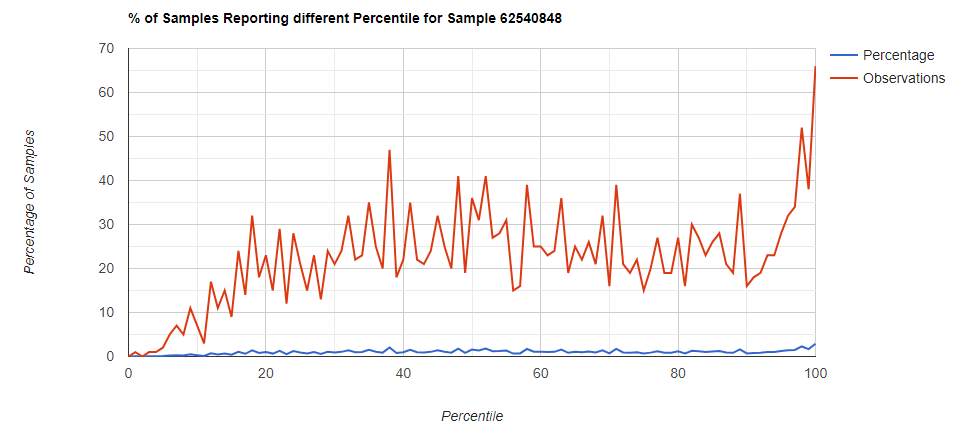
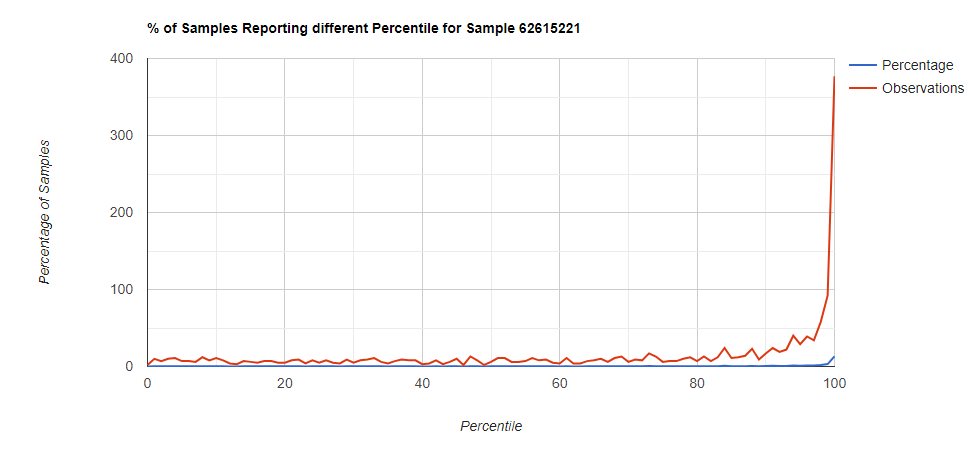
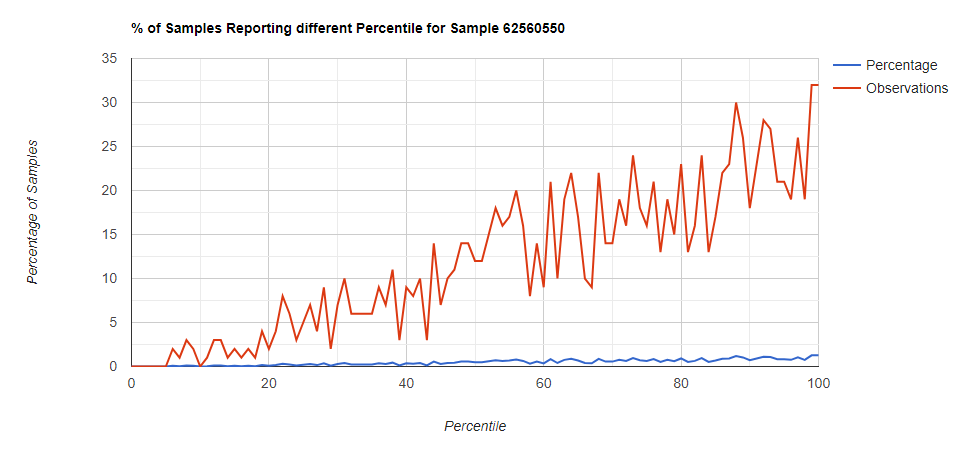
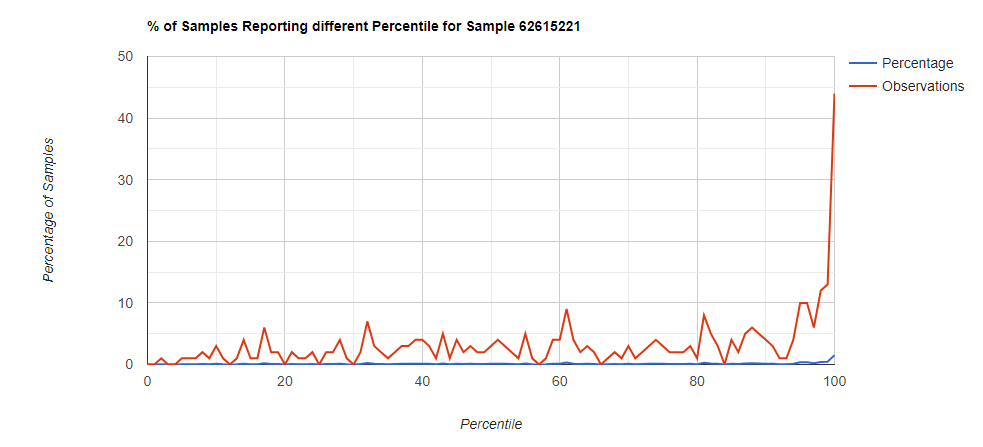
Family Level
Bottom Line
Comparing different levels can be informative, to illustrate, we have species below with good uniformity until we hit the high levels.
Looking at the genus level for the same sample, the pattern is very different.
In this case, we drilled down into these high species and got a predominance of Corynebacterium species that fell into our 100% range (99.5-100 percentiles).
| Taxonomy Name | Abundance |
| Anaerococcus mediterraneensis | 0.005611 |
| Anaerococcus prevotii | 0.006486 |
| Bacteroides rodentium | 0.001238 |
| Corynebacteriaceae bacterium ‘ARUP UnID 227’ | 0.000437 |
| Corynebacterium ammoniagenes | 0.000586 |
| Corynebacterium aurimucosum | 0.1573 |
| Corynebacterium callunae | 0.00013 |
| Corynebacterium camporealensis | 0.002243 |
| Corynebacterium casei | 0.000726 |
| Corynebacterium comes | 0.000391 |
| Corynebacterium diphtheriae | 0.0755 |
| Corynebacterium endometrii | 0.001051 |
| Corynebacterium flavescens | 0.001684 |
| Corynebacterium humireducens | 0.00053 |
| Corynebacterium imitans | 0.001024 |
| Corynebacterium jeikeium | 0.01813 |
| Corynebacterium lactis | 0.000437 |
| Corynebacterium liangguodongii | 0.000558 |
| Corynebacterium minutissimum | 0.03511 |
| Corynebacterium phocae | 0.000865 |
| Corynebacterium pseudotuberculosis | 0.000233 |
| Corynebacterium renale | 0.000493 |
| Corynebacterium resistens | 0.001182 |
| Corynebacterium riegelii | 0.001321 |
| Corynebacterium segmentosum | 0.007016 |
| Corynebacterium simulans | 0.3615 |
| Corynebacterium singulare | 0.01858 |
| Corynebacterium sp. NML 98-0116 | 0.001024 |
| Corynebacterium stationis | 0.000577 |
| Corynebacterium striatum | 0.04709 |
| Corynebacterium timonense | 0.001321 |
| Corynebacterium urealyticum | 0.00107 |
| Corynebacterium uterequi | 0.000642 |
| Corynebacterium yudongzhengii | 0.000689 |
| Cutibacterium acnes | 0.002298 |
| Dehalococcoides mccartyi | 0.006123 |
| Dermabacter jinjuensis | 0.01404 |
| Dermabacter vaginalis | 0.001265 |
| Fastidiosipila sanguinis | 0.003536 |
| Finegoldia magna | 0.06368 |
| Helcococcus kunzii | 0.00014 |
| Homo sapiens | 1.985 |
| Lawsonella clevelandensis | 0.003154 |
| Mycobacterium gallinarum | 0.000261 |
| Mycobacterium sp. DL592 | 0.00013 |
| Mycobacterium sp. ELW1 | 0.001107 |
| Mycobacterium sp. EPa45 | 0.002298 |
| Mycobacterium sp. PYR15 | 0.008328 |
| Mycolicibacterium aichiense | 0.000223 |
| Negativicoccus massiliensis | 0.001935 |
| Peptoniphilus harei | 0.04272 |
| Peptoniphilus sp. ING2-D1G | 0.000893 |
| Porphyromonas asaccharolytica | 0.06443 |
| Porphyromonas bennonis | 0.000521 |
| Propionibacterium freudenreichii | 0.000465 |
| Schaalia radingae | 0.001089 |
| Streptococcus pyogenes | 0.00241 |
| Streptococcus sp. NCTC 11567 | 0.000149 |
| Sutterella stercoricanis | 0.000149 |
| Tessaracoccus timonensis | 0.00094 |
| uncultured Chroococcidiopsis sp. | 0.000242 |
| uncultured Rhizobium sp. | 0.000772 |
We could also produce single value statistical measures — for example Chi2. We have an a priori expected value of 1% in each bucket.
IMHO, percentages of percentiles is likely more effective in evaluating an individual person’s gut microbiome. It seems to be able to separate the noise from what is significant, for example Corynebacterium cited above where the cause is a proliferation of species and not dominance of one species.
This has since cascaded into an Eubiosis Index.
Recent Comments