There are many approaches that can be taken. With the same data, different methods can reap a huge variation of harvest (i.e. the number of statistically significant relationships found).
I will use the Pearson’s Chi2 to determine significance and a simple “does the presence of bacteria A results in a shift of bacteria B”. By a shift, I mean either an increase/decrease of the number of bacteria above a threshold or below count. The threshold for bacteria count varies from bacteria to bacteria, and lab to lab.
To illustrate:
Bacteria Present
Bacteria Impacted
Low Zone
High Zone
Lactobacillus
Rickettsieae
528
185
The naive “expected number” is (528+185)/2=356.5, The actual expected number is lower 198 for both zones, yielding a chi2 of 647! The middle values have shifted lower. The conclusion that having Lactobacillus reduces the risk of Rickettsieae appears confirmed in publications such as Use of Lactobacillus to prevent infection by pathogenic bacteria [2002].
Looking in the opposite direction, we have a reduced Chi2 of just 29 with the apparent intrepretaion being that the prescience of Rickettsieae reduces Lactobacillus slightly (‘Odds ratio’ of 1.35, versus 2.66 going the other direction).
Bacteria Present
Bacteria Impacted
Low Zone
High Zone
Rickettsieae
Lactobacillus
268
202
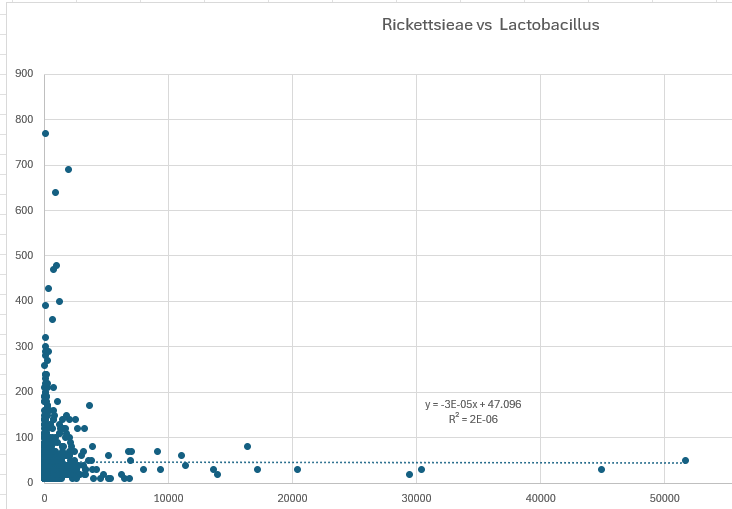
IMHO, this approach yields more significant findings than looking at the differences of averages using standard deviations. Some people will attempt to find a linear regression between the counts of Lactobacillus and Rickettsieae. An example using the same data is below. I will leave it to the reader to reconcile.
A key philosophical question is whether we need to use all data, or only data that is significant. My resolution of this question is that the high and low levels are what is significant and the middle data is effectively just noise. Determining the cutoff points with backing mathematics/statistics is essential.
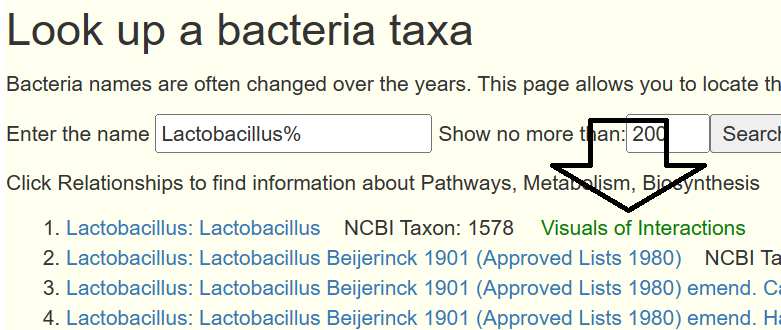
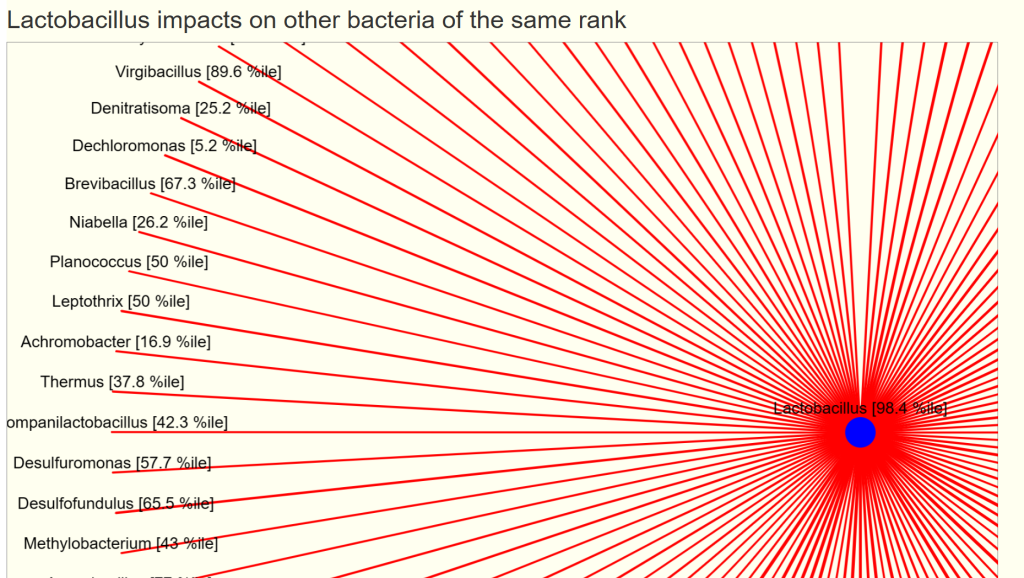
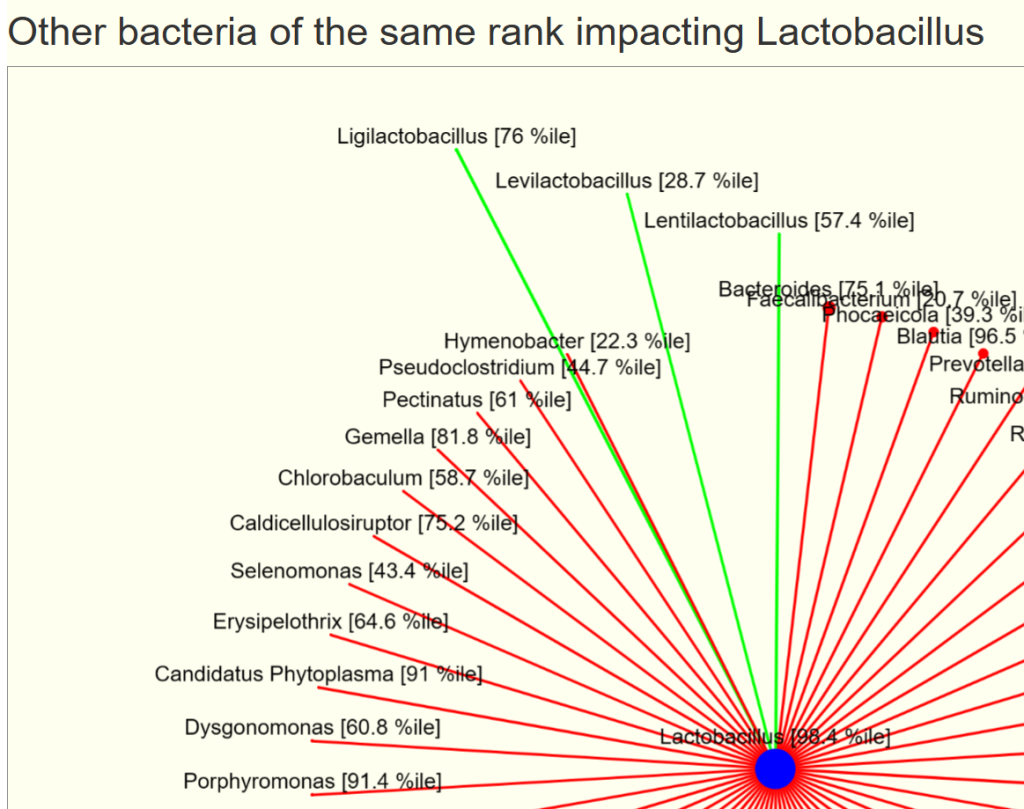
I have put interactions between bacteria of the same rank into Look up a bacteria taxa web site. Just search for a bacteria of interest and click the link.
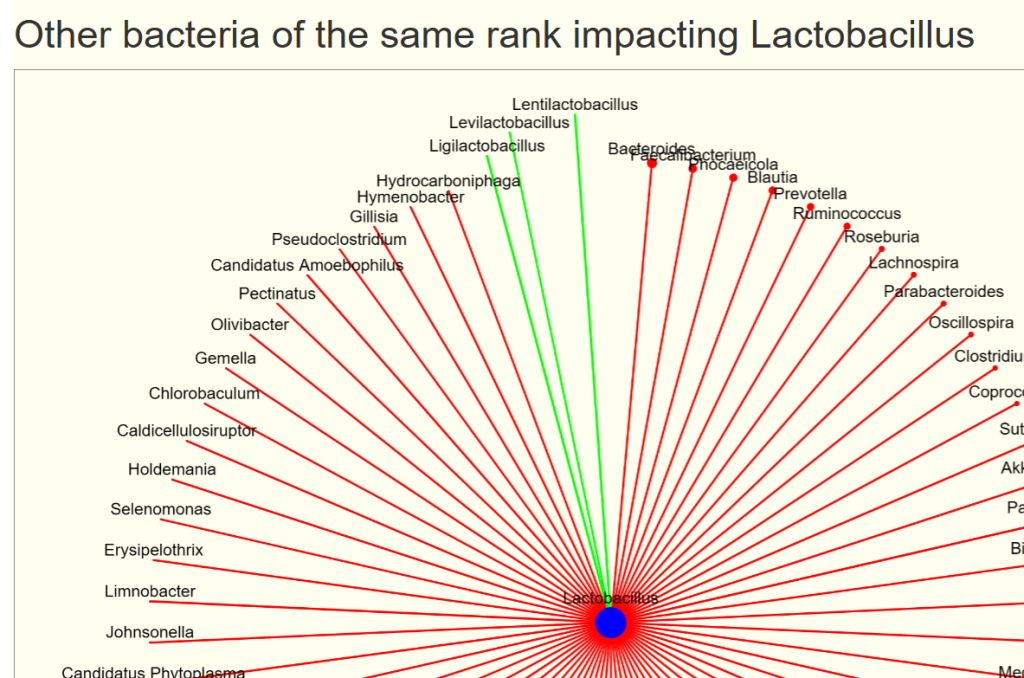
You will see two charts, impacts and impacted by. For our example bacteria, we see that three other genus increases it (and looking at the names, no surprise!)
The size of the circles reflect the relative average count scaled
The width of the lines reflect the relative chi2 (significance), thicker lines implies more impact.
Green indicates increases/feed
Red indicates decreases/reduces
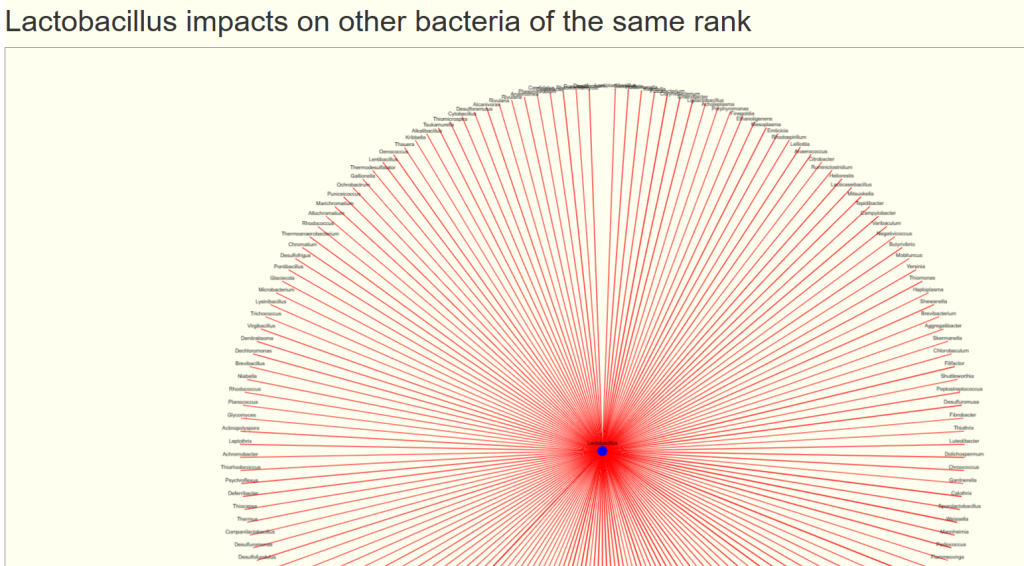
And a ton of bacteria that is reduced by its presence.
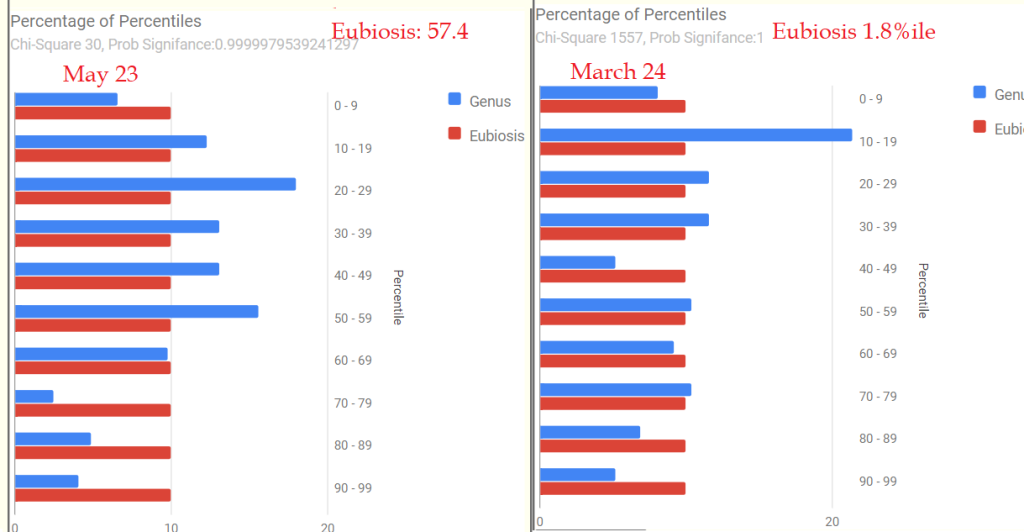
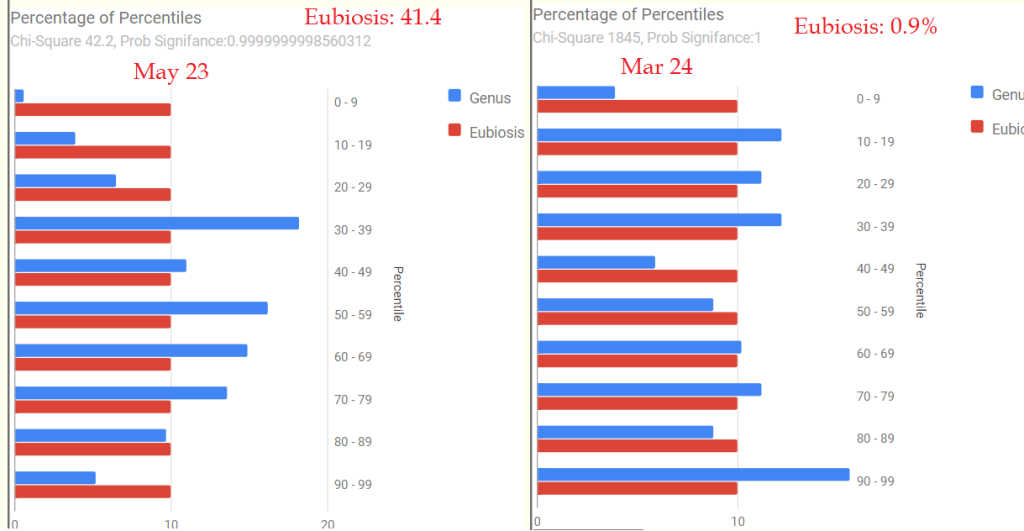
Applying to a Sample
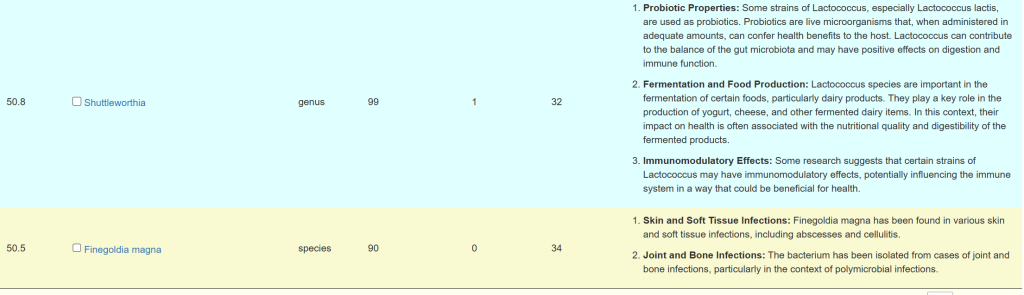
Many of the bacteria above are rare. With an explicit sample, we filter to what is shown in the sample. We display them with their percentile ranking (i.e. a good indicator of relative amount)
Data Availability
The data (over 400K statistically significant impacts) will be available at MicrobiomePrescription Citizen Science for anyone wishing to compare against their own data. The data used was from Biomesight, a 16s provider that ships worldwide.
For me it’s still LongCovid > ME/CFS (thanks to SarsCov2) and unfortunately, in February, I had to take a 14-day course of antibiotics (amoxicillin 100 mg 3 times a day) because of Helicobacter Pylori
and also Pantoprazole 40 mg twice daily), which my micorobiome certainly didn’t like.
My PEM is less frequent and not as terrible as it used to be. My baseline has also improved, but I’m still at Bell 40 and pacing a lot. You already know the rest of my story.
Unfortunately, my daughter Carlotta looks as if she is slowly moving from the LongCovid control group to the LongCovid affected group. Which of course makes me particularly worried about my ME/CFS. She is also quite hypermobile.
Regarding her history, it should be mentioned that she developed bad migraines when she was around 5 years old (now 17). Which was triggered by certain foods. On a test it showed at 60 out of 80
Food intolerance. This could be almost completely remedied through a strict diet. The migraines were now rare, but have become more frequent recently. (maybe also interesting, there is a suspicion of Asperger’s Syndrome / Autism Level 1)
Mother
It seems that the microbiome has gone downhill over the year.
US National Library of Medicine Pattern Matching
2023: multiple chemical sensitivity [MCS], SIBO, Graves’ disease, Acne, hypertension
2024: hypertension, Menopause
Symptoms
2023: Not entered
2024: 101 Symptoms …
Dr. Jason Hawrelak Criteria: 66%ile
Daughter
The same pattern of the microbiome going downhill over the year.is seen here.
2023: Nothing entered (entering long afterwards is discouraged for the sake of accuracy)
2024: Neurocognitive: Can only focus on one thing at a time, Neurological: Joint hypermobility, Need to nap during each day, Impaired Memory & concentration, Onset: Gradual, Headaches, Migraine, Viral infections with prolonged recovery periods, Joint: Tenderness, Official Diagnosis: COVID19 (Fully Recovered), Acne, Difficulty falling asleep, Easily irritated, Tinnitus (ringing in ear)
Dr. Jason Hawrelak Criteria: 13%ile (i.e. bad)
Going Forward
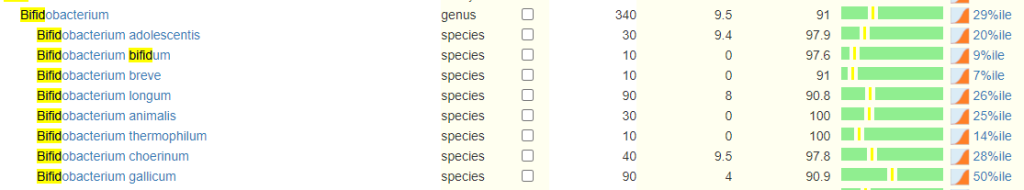
The daughter’s Bifidobacterium was at 5%ile (extremely low with few species) and the mother’s at 29%ile with many species at low levels. This leads directly to my next observation.
My personal experience post-COVID was that a mixture of Bifidobacterium probiotics cleared a lot of symptoms in less than 2 weeks. I tried that based on the first published study below, with support from other studies:
A synbiotic preparation (SIM01) for post-acute COVID-19 syndrome in Hong Kong (RECOVERY): a randomised, double-blind, placebo-controlled trial [2023]
“Overall, Bifidobacterium was associated with both protective effects and reduced abundance in relation to the disease. The genus has been found to be abundant in some cases and linked to disease severity. The studies evaluating the use of Bifidobacterium as probiotics have demonstrated the potential of this genus in reducing symptoms, improving pulmonary function, reducing inflammatory markers, alleviating gastrointestinal symptoms, and even contributing to better control of mortality. In summary,” [2023]
“Growing evidence demonstrate that gut microbiota alteration is associated with COVID-19 progress and severity, and post-COVID-19 syndrome, characterized by decrease of anti-inflammatory bacteria like Bifidobacterium” [2023]
“Specifically, it suggests an association of anti-inflammatory bacteria, including Bifidobacteria species and Eubacterium rectale, with lower severity, and pro-inflammatory bacteria such as Prevotella copri with higher severity. ” [2022]
“Although the mortality rate was 5% in the [Bifidobacterium] probiotic group, it was 25% in the non-probiotic group. ” [2021]
“positive patients overall had lower relative abundances of Bifidobacterium ” [2022]
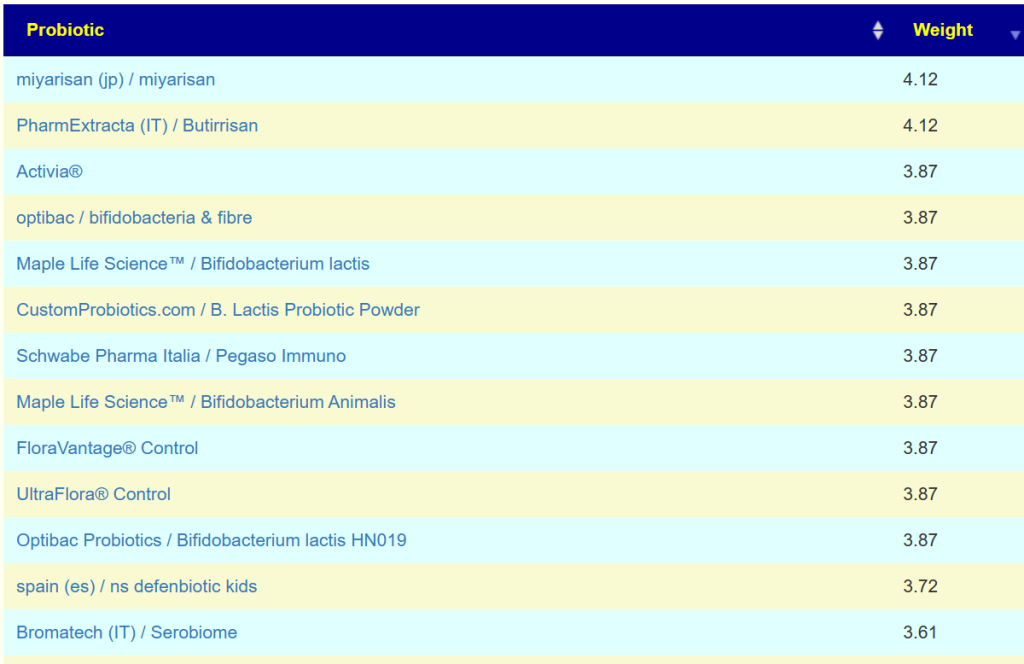
Thus, I was interested in what the KEGG Probiotics Suggestions came up with:
These KEGG suggestions appear to agree with the literature. See Explanation of the methodology if you are interested in the mechanics of these suggestions. I also looked at the revised supplements from KEGG (just done). Remember, using KEGG is not trying to fix individual bacteria, rather to make sure all of the nutrients needed in the “microbiome soil” are there in the hope of producing a bountiful healthy crop.
For the mother
NADH (due to low 3-Oxoadipyl-CoA), alternatively, regular niacin
Since she has acne, and the first two are often prescribed for acne… it may not be that hard to these prescribed.
What I found very interesting is the great similarity between suggestions of the mother and the child. Same DNA, similar diet, and likely similar time since COVID. I will leave them to review the avoid list. I will point out that the other B-Vitamins are on the avoid list. I should also point out that NADH and Niacin are closely related so we have agreement between the KEGG data and our usual expert system. Vitamin K is not often on our expert system list (little data to work from).
Key Take Away:
Depending on finances, retest after being on it for 6-12 weeks. Correcting the microbiome is usually a long list of course corrections.
Rotate and change Probiotics (maximum time on any one should be two weeks).
At least 10 BCFU for each probiotic species
Have Barley Porridge each morning with some butter
There was no strong converge in diet style (diet is very subjective with most studies and usually problematic to interpret). The following are specific items you should consider
I am not a licensed medical professional and there are strict laws where I live about “appearing to practice medicine”. I am safe when it is “academic models” and I keep to the language of science, especially statistics. I am not safe when the explanations have possible overtones of advising a patient instead of presenting data to be evaluated by a medical professional before implementing.
I cannot tell people what they should take or not take. I can inform people items that have better odds of improving their microbiome as a results on numeric calculations. I am a trained experienced statistician with appropriate degrees and professional memberships. All suggestions should be reviewed by your medical professional before starting.
The answers above describe my logic and thinking and is not intended to give advice to this person or any one. Always review with your knowledgeable medical professional.
There are two approaches to identifying bacteria associated with a group of symptoms:
UNION — you just join the bacteria associated with each symptom into a single list. This is often done when there is not sufficient data. It’s simple to do.
INTERSECTION — this identifies all people with the same combination of symptoms and then identify what is associated. This requires statistical computations to be done each time.
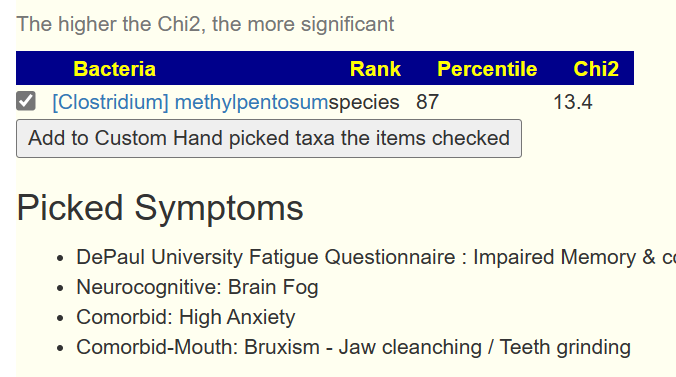
The video below is a quick walkthrough. What is interesting to note is that the number of significant bacteria can increase as more symptoms are added. Why? because you are filtering out noise from the bacteria.
You can also have bacteria appearing that were not in the prior list by adding one more symptom. Example below.
Bottom Line
With a large enough sample and enough characteristics recorded, you can drill down into a lot more data using the appropriate statistical techniques.
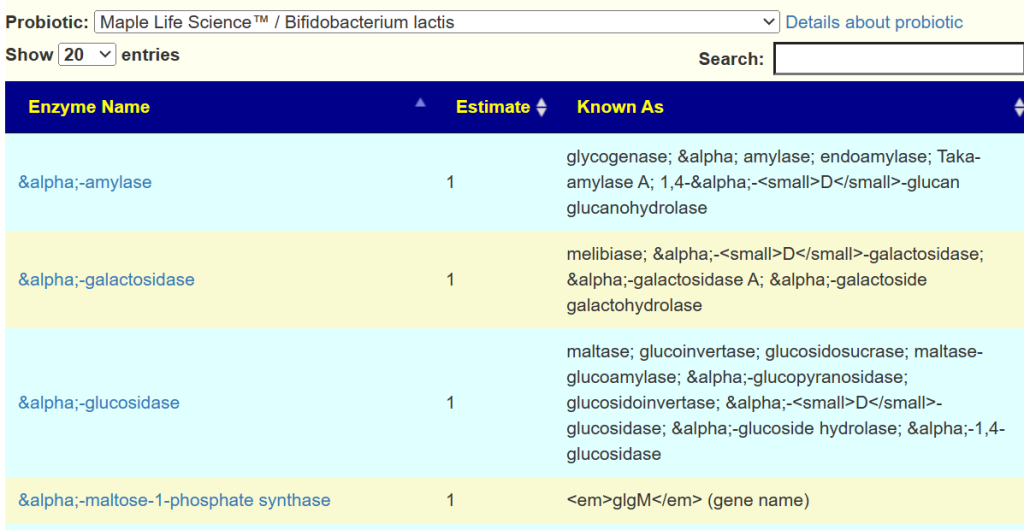
We have the Enzymes produces by a wide variety of strains on the KEGG: Kyoto Encyclopedia of Genes and Genomes. We can aggregate(i.e. average) this data up to the species level and then estimate the enzymes that a probiotic species or retail probiotic mixture may produce.
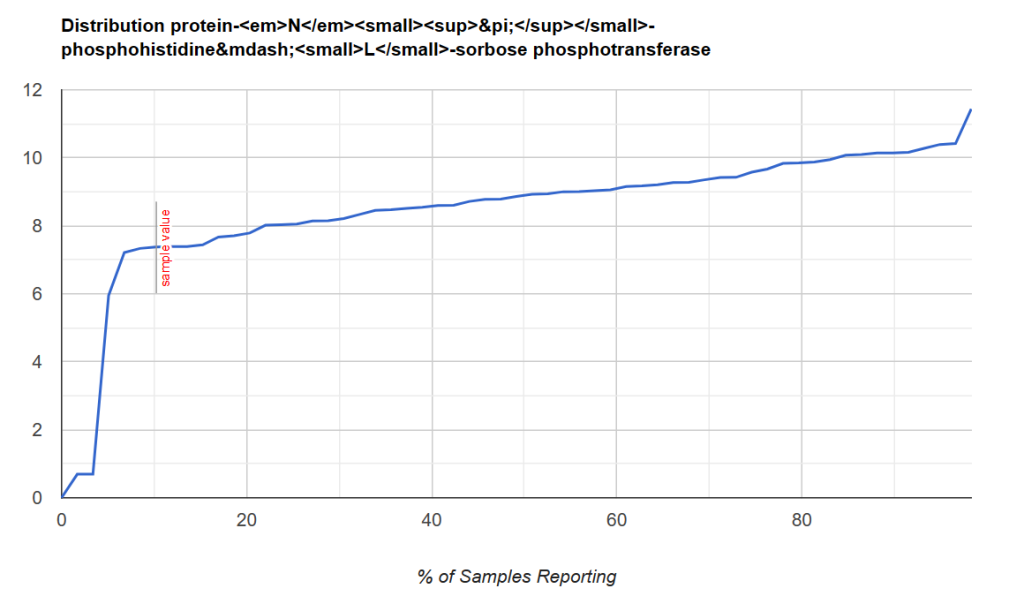
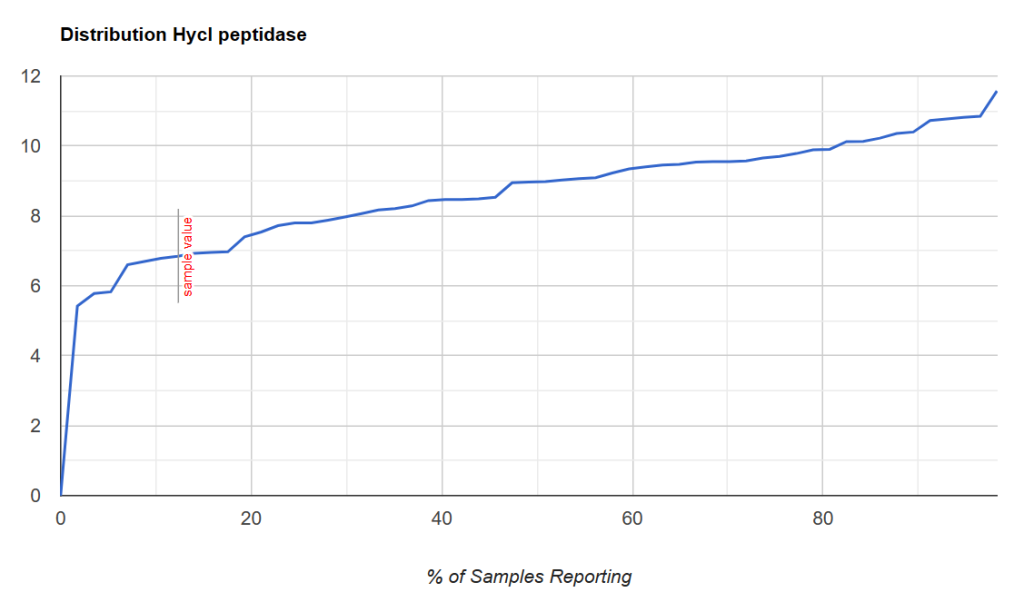
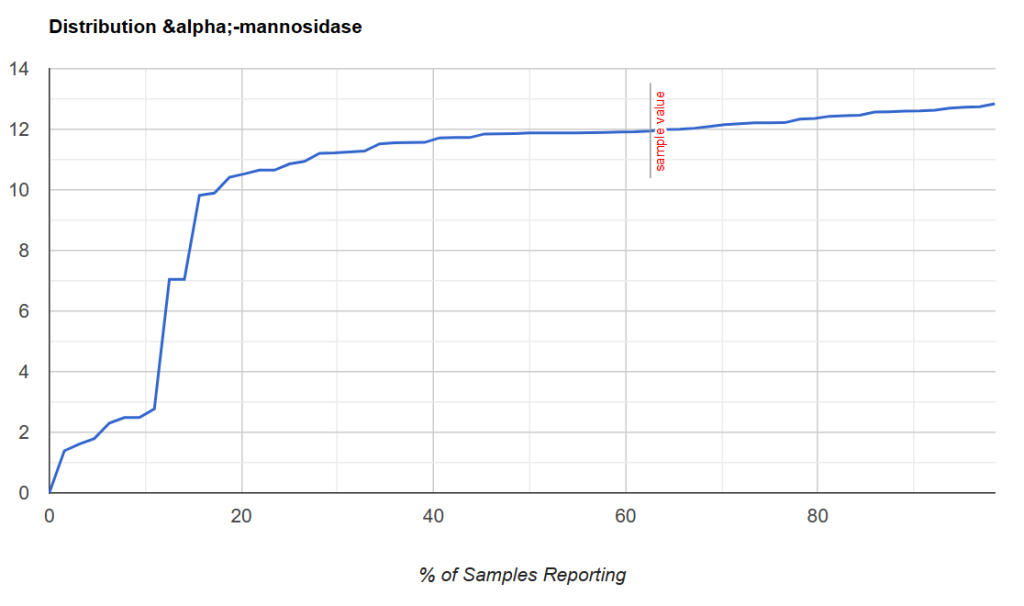
The next step is to identify the enzymes that a person is deficient in. I use the Kaltoft-Moltrup (KM) method to determine the bottom boundaries.
Some visual examples, with this point being around the 8th percentile.
Another example with this point being between 2 and 7%ile
A sample with the cutoff being close to 20%ile.
Thus it is possible to determine:
If a person is likely deficient enough that supplementing enzymes via probiotic may be helpful
We could infer dosages by the distance from the KM cutoff point.
Then we can proceed to apply this to a collection of retail probiotics products
For example, Bifidobacterium Lactis was estimated to produce some 458 different enzymes.
Bottom Line
This approach does not try to “fix bacteria”, rather it tries to make sure that the fuel and oxygen need for the microbiome fire are there. Thus the bacteria issues resolve themselves! A very different way of trying to address microbiome dysfunction.
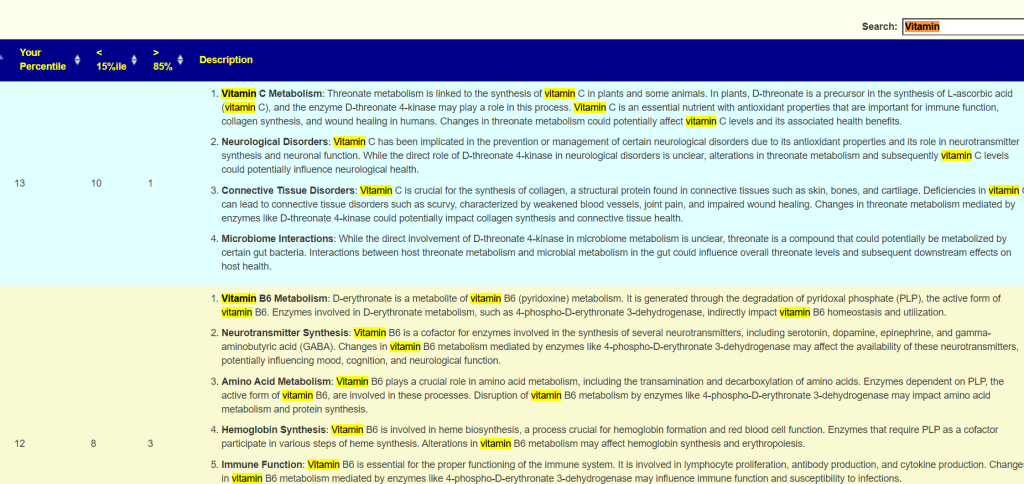
On April 14th, this new/revised feature was released. It determines shifts in these items by looking at the top and bottom 15% of people with these symptoms compared to the annotated sample population. This makes it easy to understand how significance is determined.
The basis is simple:
We count the number of people with symptoms that have a percentile ranking below 15%ile or above 85%ile.
If there is no association, then the numbers should be closed, i.e. 21 for each with the example below.
Rather than get into statistics, we show the common sense counts.
How to get there?
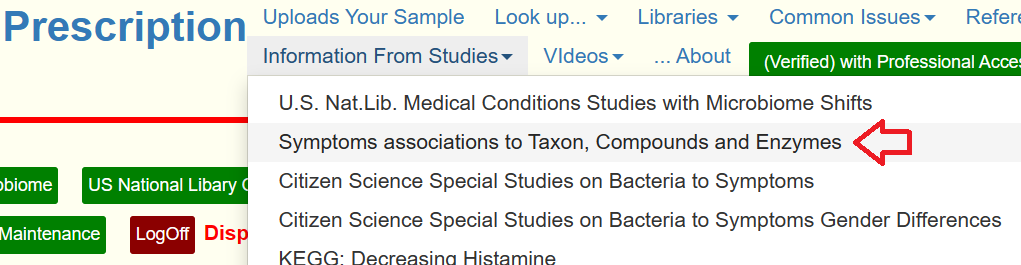
Upon logging with samples you will see this new menu item.
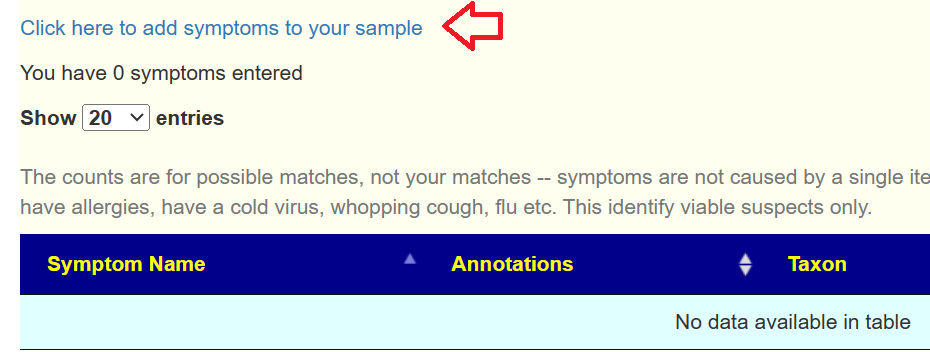
The next screen will matched against annotated symptoms for this sample. If you have no symptoms, this will be shown. You should add your symptoms via the link on this
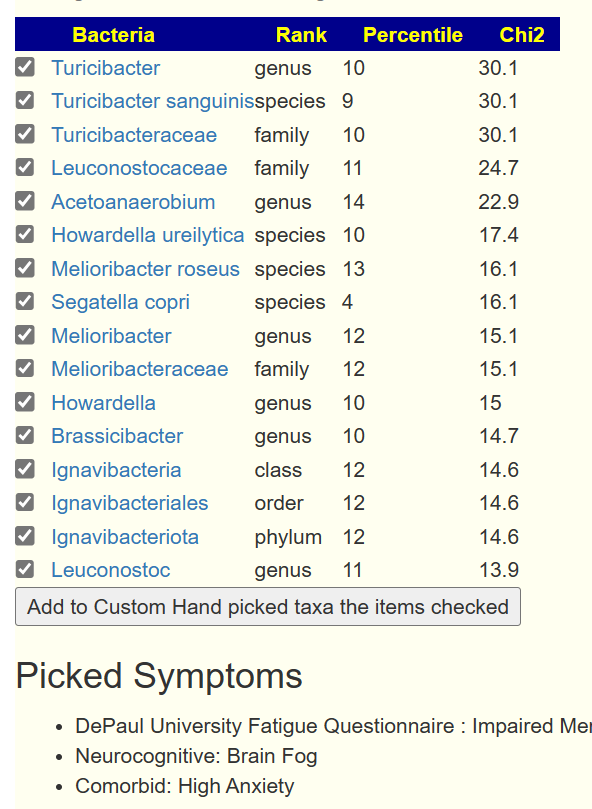
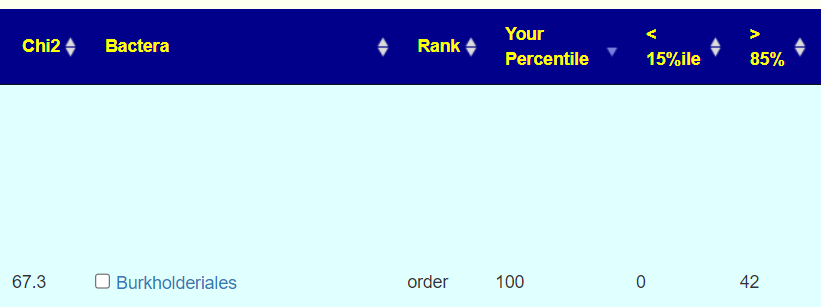
If you have symptoms entered, then you will be shown a summary of what has been associated (according to samples from the lab you used)
The right three columns are hyperlinked. The number of actual matches will be shown when you click the hyperlink. In some cases, many matches in other cases none.
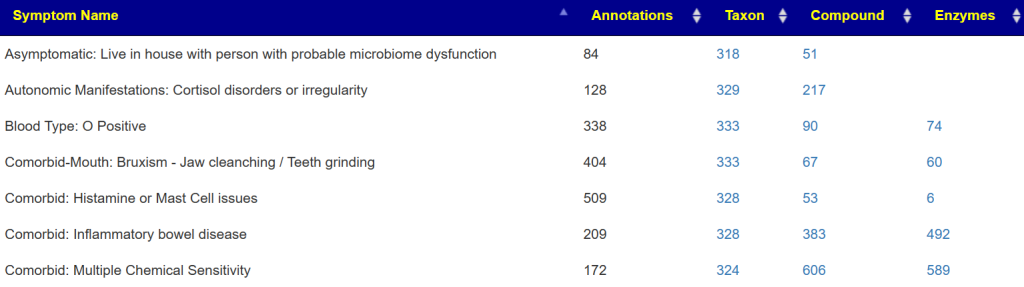
A general description is on the right. For Enzymes, typing “vitamin” in the search box. If the percentile is low, then you should consider supplementing with the vitamins listed. Why? you appears to be deficient in one or more enzymes that produces or uses it (as always, seek an opinion from an expert first)
Video Walk Thru
P.S. all of the bugs identified has been fixed.
Data Availability?
See https://citizenscience.microbiomeprescription.com/ for data. Kegg data on compounds and enzymes needs to be obtained from http://kegg.jp/ (licensing issue).
The notation “3.3e12” is scientific notation, which is a compact way of representing very large numbers. In this notation, the “e” stands for “exponent.” So, “3.3e12” means 3.3×10^12 .
Breaking it down:
3.3 is the coefficient or mantissa.
10 is the base.
12 is the exponent or power of 10.
Therefore, “3.3e12” is equivalent to 3.3 multiplied by 10 raised to the power of 12 , which equals 3.3 followed by 12 zeros:
3.3×1012=3,300,000,000,000.
In other words, “3.3e12” represents 3.3 trillion.
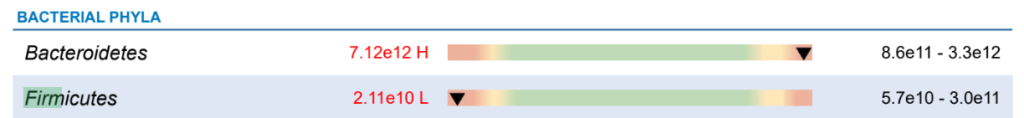
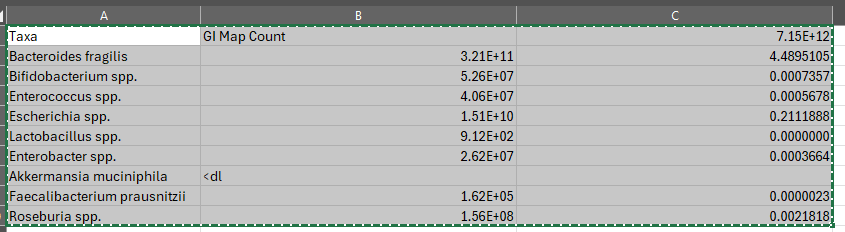
Total Bacteria
Ideally, you would add up all of the phylums; unfortunately GI-MAP only provides two
So the total in this sample is 7.15e12 which is above the reference range max of 3.6e12. So for the purposes of this discussion, we will assume 7.15e12 (with the difference from reference being other phylums).
How does GI-MAP work?
The GI-MAP (Gastrointestinal Microbial Assay Plus) is a diagnostic tool used to assess the composition of bacteria, parasites, and other microorganisms present in the gastrointestinal tract. It utilizes a technique called quantitative polymerase chain reaction (qPCR) to measure the abundance of specific microbial DNA in a stool sample. Here’s how it works:
Stool Sample Collection: A patient provides a stool sample, typically collected at home and sent to a laboratory for analysis.
DNA Extraction: The laboratory extracts microbial DNA from the stool sample. This step involves breaking open the cells of the microorganisms to release their genetic material.
Primer Design: Primers are short DNA sequences designed to bind specifically to the target DNA sequences of interest. For the GI-MAP, these primers target specific regions of the microbial DNA that are unique to certain bacterial species, parasites, or other microorganisms.
qPCR Amplification: The extracted microbial DNA is mixed with the primers and other reagents in a reaction mixture. The qPCR machine then cycles through a series of temperature changes to amplify (copy) the target DNA sequences. Each cycle doubles the amount of DNA present, allowing for the exponential amplification of the target DNA.
Fluorescent Detection: During the qPCR process, fluorescent reporter molecules are incorporated into the DNA as it is amplified. As the amount of amplified DNA increases, so does the fluorescence signal. This allows the qPCR machine to detect and quantify the amount of DNA present in the sample.
Data Analysis: The fluorescence data collected during the qPCR process are analyzed to determine the abundance of specific microbial DNA targets in the stool sample. By comparing the fluorescence signals to standard curves generated from known concentrations of DNA, the laboratory can quantify the relative abundance of different microorganisms present in the sample.
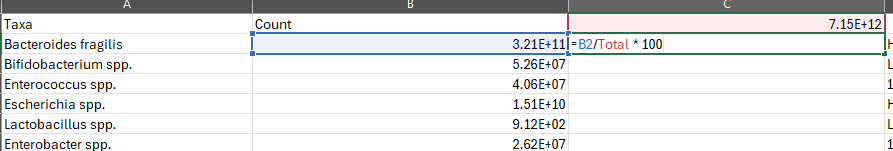
Converting to Percentage
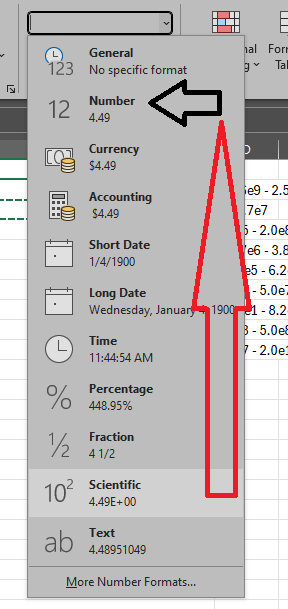
Now, how do we convert. The easy way is to use EXCEL or other spreadsheets. Example of the formula is below.
Then change the display from Scientific to Percentage

Recent Comments