Eubiosis is a measure of Representative-ness in the Gut
If you look at a place of employment, ideally you would see each part of society represented in the employees. For example:
- 50% males and 50% females
- 62% white
- 19% Hispanic or Latino
- 12.4% Black or Africian American
- 2% with Autism
- 3% Native American
- .01 with Down Syndrome
- etc
A place that matches (or close to matches) could be said to have 100% Eubiosis – that is the percentage expected in reflected in the employees. This does not reflect this firms profitability or employee turnover rates or any of a dozen of other measures. It is an adjunct measure that is statistically based. Most estimates of gut health are subjective, often based on beliefs or for a specific type of condition. This measure can be low for someone in good health with no symptoms, but the odds are low.
To illustrate this, the following is from one individual over time. Genus and Overall are from special studies.
| Date | Eubiosis | Hawrelak | Genus | Overall |
| 2024-03-05 | 0.7%ile | 12%ile | 30% | 96% |
| 2023-12-06 | 49.7 %ile | 26.1%ile | 100% | 79% |
| 2023-07-03 | 48.3%ile | 16%ile | 79% | 71% |
| 2022-12-28 | 46.2%il | 80%ile | 28% | 99% |
The Eubiosis and Hawrelak both indicates worsening in the latest sample (my usual first question is: Any virus caught between samples? Second question is any vaccinations in the 6 weeks prior to the sample). Overall Citizen Science being high for symptoms indicates a strong pattern match to symptoms — which implies a worsening microbiome.
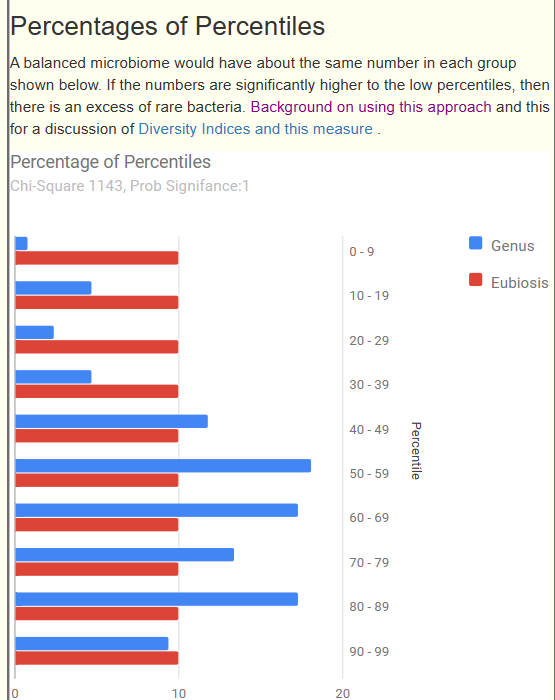
Below we have a bad Eubiosis, 3.9 — why is it bad because the amounts in each range is very far from the expected (statistically). The blue and red bars should be close to each other.
This note in a continuation of an earlier note:
I am a statistician and operations research person by training and experience. I tend to take novel approaches to many issues based on mathematics. These are recorded in this series of notes
I have some 4,600 different unique microbiome samples uploaded to my citizen science site. Most of these are from people with gut issues. Some are from health hackers (i.e. no issues).
A simple Chi2 experiment using percentages of percentiles is done. I bucketized the genus data into 10% percentile ranges resulting in 10 buckets, compute the chi2 and thus we have 9 degree of freedom.
Genus has adequate counts per sample. Species reporting is often very sparse for some tests (depending on the number of reads that the lab set as a threshold, etc.). Genus gives the highest count for a specific taxonomy rank in this dataset.
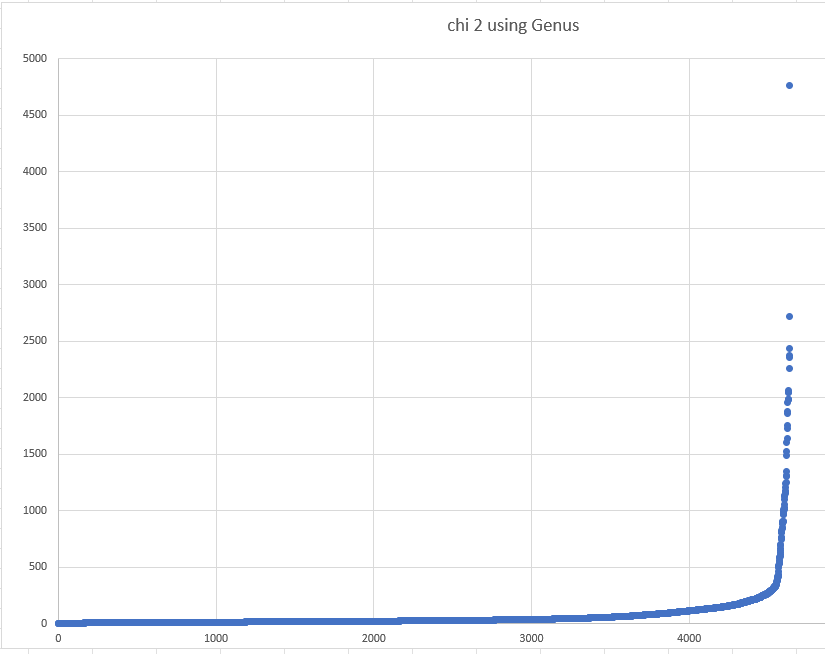
I then proceeded to plot the values to see what the data looks like. Note the significance levels for 9 degree of freedom below
- 14.7 is 0.1
- 16.9 is 0.05
- 19.02 is 0.025
- 21.7 is 0.01
- 27.9 is 0.001
Over all of the values, we do see some extreme values
But let us look a less extreme values
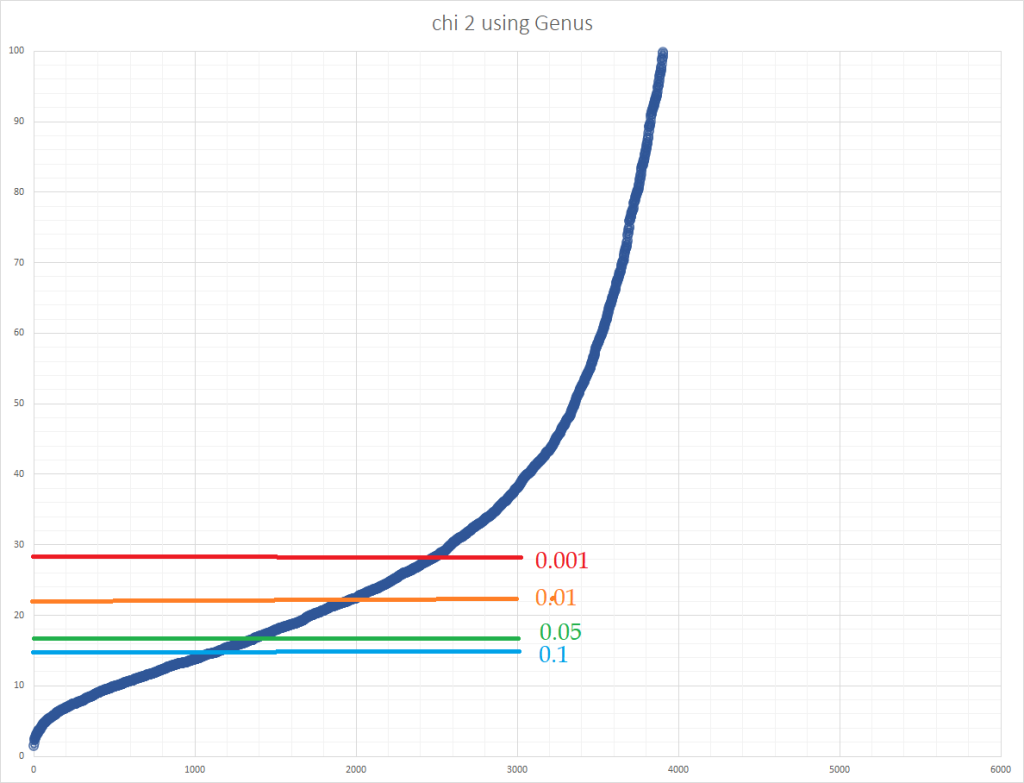
We now need to do a little math assuming there was no significance, i.e. the numbers were happening random.
- 0.1 (aka 10%) means that 90% of the samples would be expected to have a chi2 value of 14.7 or less. We have 1130/4600 or 24% of the samples
We could start working to lower values, but using 14.7 means that 1/4 of the samples at this value may not have dysbiosis. Taking 0.1 and this ratio, we can estimate that we have around a 97% chance of correctly identifying dysbiosis
General conclusion is that a gut without dysbiosis would have a chi2 value of 15 or below for genus.
The Challenge of Getting a “Health Index” for the Microbiome
Looking at a variety of microbiome testing sites I see a lot of “flying by the seats of their pants” being tossed out. IMHO, these sites are soiling their pants — somewhat appropriate for this business :-).
I believe we can create a statistically valid index that works solely off the numbers and not some idealized concept of what a healthy gut should be. We use the above analysis to create this index.
People like have a percentage number for a healthy gut, then the following is suggested (which is actually a percentile ranking):
- Under 15: 100% good
- Over 15: 100 – (Percentile over those over 15)
For lack of a better name (and keeping with naming practices for indices), I will call this the Lassesen Eubiosis Index with 100% being no apparent sign of dysbiosis and good eubiosis.
From the set of samples used above, I extracted a reference table (which may vary according to the test used and the population used). Since I know that the majority of samples have dysbiosis issues, this is likely a reasonable guideline.
| Eubiosis Index | Chi2 |
| 90 | 18 |
| 80 | 21.3 |
| 70 | 24.5 |
| 60 | 29.1 |
| 50 | 35.6 |
| 40 | 45.2 |
| 30 | 65.3 |
| 20 | 106 |
| 10 | 168 |
| 5 | 248 |
The joy of this approach is that it simple, statistically valid and is taxonomy agnostic. No judgement calls are being made on good or bad bacteria.
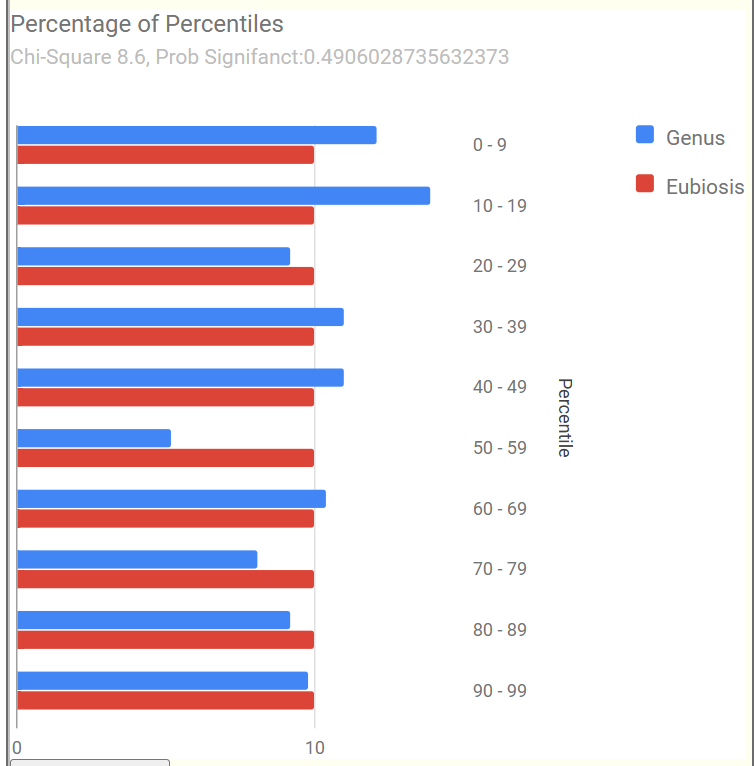
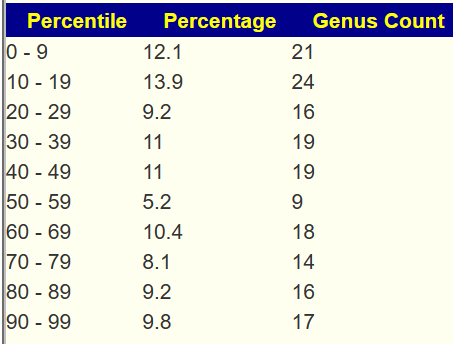
Example of 100% Eubiosis
We see a dip at the 50-59%ile range but this minor disturbance does not register as a likely dysbiosis.
Recent Comments