To me, the more information about the microbiome that you have, the better it is to identify issues and build a treatment course. Below, the numbers will speak for themselves.
Second Class Tests
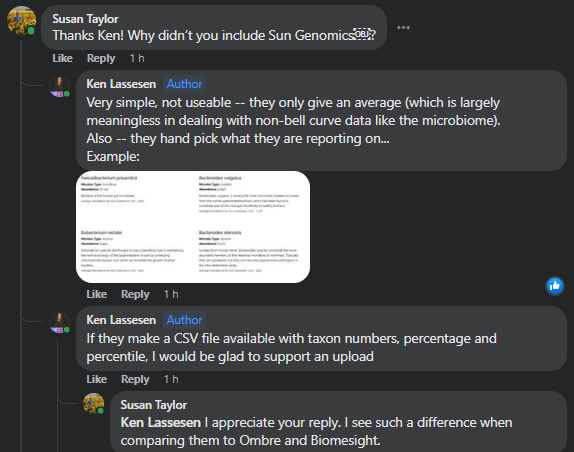
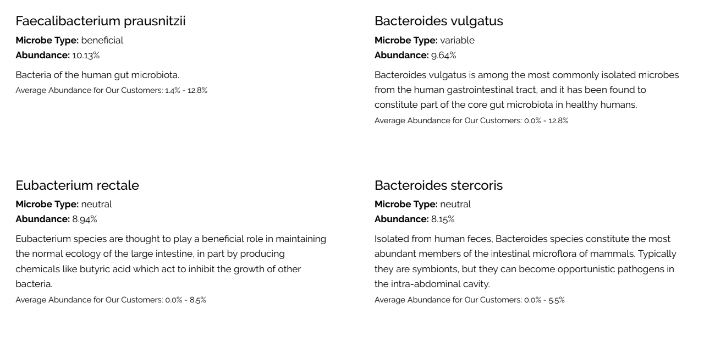
I deem these as 2nd class for several reasons: the number of bacteria reported is low (compare to others), the lab method requires the bacteria to be culturable (hence many bacteria will never be reported), they do no provide a suitable CSV file for upload to Microbiome Prescription (allowing 2nd opinions for treatment), they mechanism of measurement is not compatible to Microbiome Prescription (and most recent microbiome studies on the US National Library of Medicine)
| Lab Name | BacteriaReported |
| Bioscreen (cfu/gm) | 17 |
| Biovis Microbiome Plus (cfu/g) | 40 |
| DayTwo | 76 |
| Diagnostic Solution GI-Map (cfu/gm) | 38 |
| GanzImmun Diagnostic A6 (cfu/gm) | 76 |
| GanzImmun Diagnostics AG Befundbericht | 25 |
| Genova Gi Effects (cfu/g) | 28 |
| Genova Parasitology (cfu/g) | 7 |
| GI EcologiX (Invivo) | 55 |
| GI360 Stool (UK) | 67 |
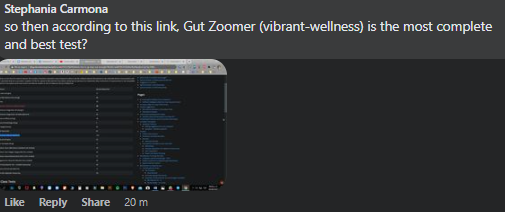
| Gut Zoomer (vibrant-wellness) | 152 |
| InVitaLab (cfu/gm) | 23 |
| Kyber Kompakt (cfu/g) | 11 |
| Medivere: Darm Mikrobiom Stuhltest (16s limited) | 16 |
| Medivere: Darn Magen Diagnostik (16s Limited) | 16 |
| Medivere: Gesundsheitscheck Darm (16s Limited) | 17 |
| Metagenomics Stool (De Meirleir) (16s Limited) | 53 |
| Smart Gut (ubiome 16s – Limited Taxonomy) | 23 |
| Verisana (cfu/ml) aka (kbe/ml) | 11 |
| Viome (No objective measures) | 29 |
First Class Tests
These are first class because: they allow an easy upload to Microbiome Prescription, use an appropriate measurement process, report based on bacteria DNA/RNA and not cultured count. The key words are 16s and shotgun analysis and not cultured.
There can be considerable cost differences between these labs (links to my first choices are below).
| Lab/Processor | Low | Typical | High | Uploads |
|---|---|---|---|---|
| AmericanGut | 73 | 156 | 213 | 18 |
| BiomeSight | 11 | 570 | 1305 | 1283 |
| BiomeSightRdp | 279 | 656 | 862 | 11 |
| Nirvana / CosmosId | 6 | 430 | 705 | 33 |
| es-xenogene | 1461 | 2880 | 5225 | 4 |
| Medivere | 530 | 721 | 934 | 7 |
| Microba | 53 | 122 | 153 | 16 |
| SequentiaBiotech | 166 | 313 | 460 | 36 |
| Ombre Labs | 185 | 667 | 2238 | 1066 |
| uBiome (Out of Business) | 6 | 249 | 589 | 813 |
Most Useful Lab?
Microbiome Prescription does some Fuzzy Logic Artificial Intelligence (FLAI) a.k.a. Dr. Artificial Intelligence. The accuracy is a function of the data available to him, that is the number of uploads from a specific lab. The newer lab BiomeSight is the winner here. This preference is made stronger because they will ship worldwide while #2, OmbreLabs (according to feedback) will only ship to the US. Microbiome Prescription mission is to support people worldwide .. so the handwriting on the statistics board is clear.
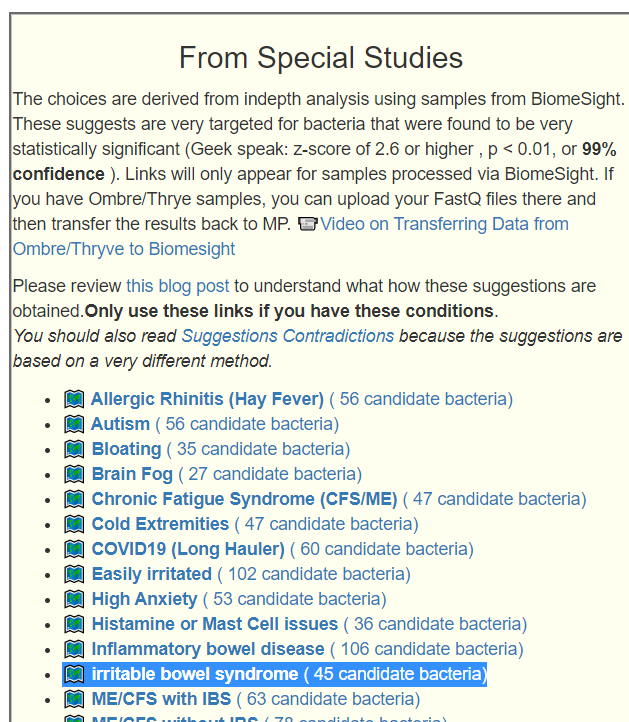
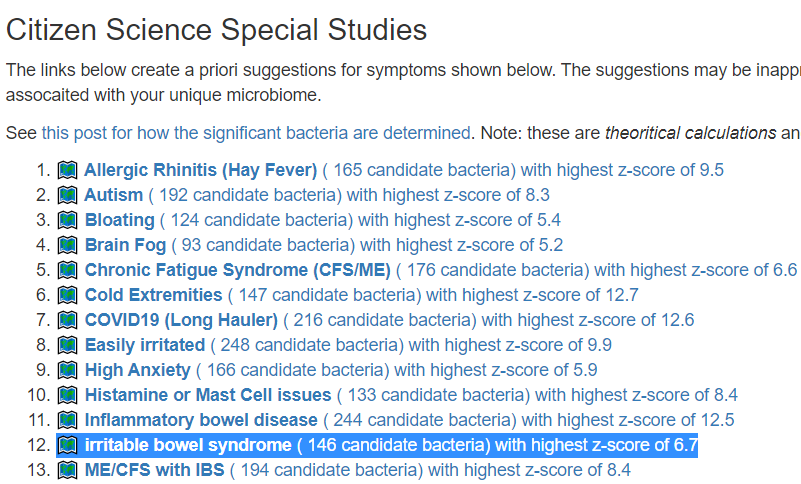
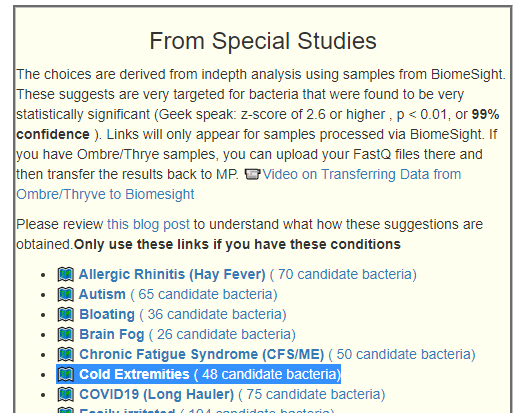
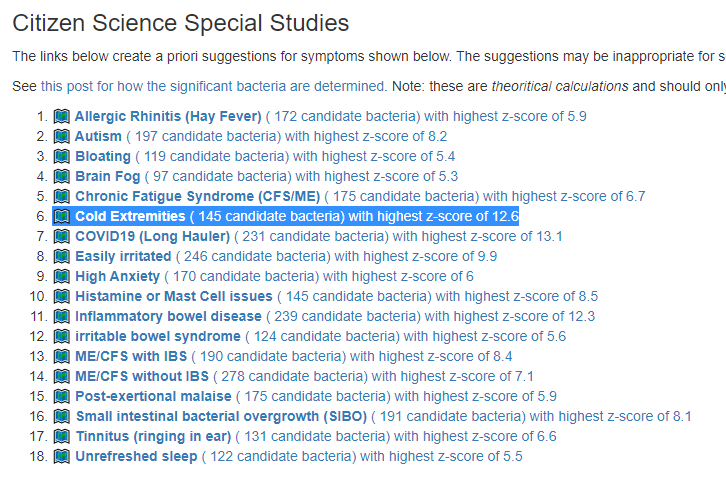
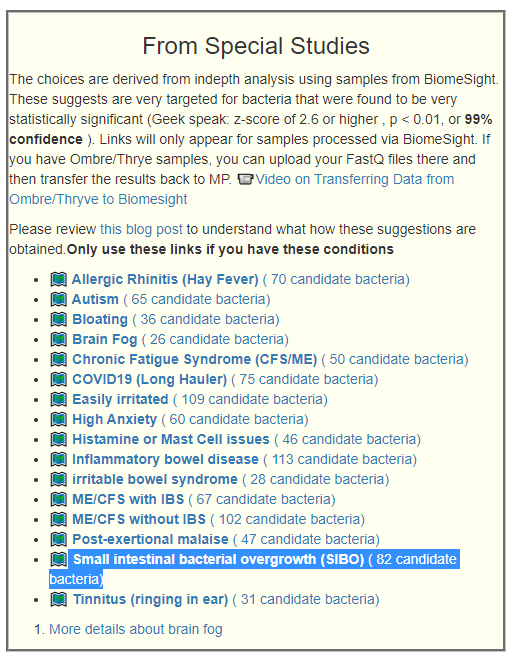
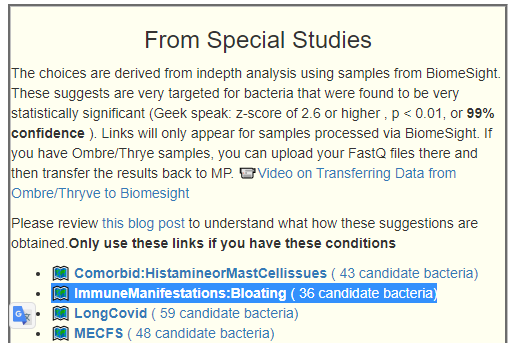
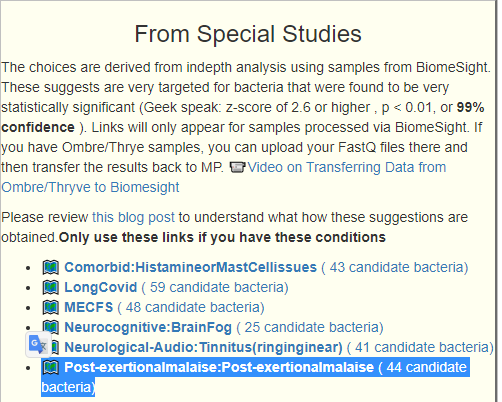
We have a growing number of special studies using BiomeSight data.
- ?️ Allergic Rhinitis (Hay Fever) ( 165 candidate bacteria) with highest z-score of 9.5
- ?️ Autism ( 192 candidate bacteria) with highest z-score of 8.3
- ?️ Bloating ( 126 candidate bacteria) with highest z-score of 5.4
- ?️ Brain Fog ( 93 candidate bacteria) with highest z-score of 5.2
- ?️ Chronic Fatigue Syndrome (CFS/ME) ( 170 candidate bacteria) with highest z-score of 6.6
- ?️ Cold Extremities ( 145 candidate bacteria) with highest z-score of 12.7
- ?️ COVID19 (Long Hauler) ( 218 candidate bacteria) with highest z-score of 12.6
- ?️ Easily irritated ( 248 candidate bacteria) with highest z-score of 9.9
- ?️ High Anxiety ( 170 candidate bacteria) with highest z-score of 5.9
- ?️ Histamine or Mast Cell issues ( 138 candidate bacteria) with highest z-score of 8.4
- ?️ Inflammatory bowel disease ( 245 candidate bacteria) with highest z-score of 12.5
- ?️ irritable bowel syndrome ( 150 candidate bacteria) with highest z-score of 6.7
- ?️ ME/CFS with IBS ( 193 candidate bacteria) with highest z-score of 8.4
- ?️ ME/CFS without IBS ( 251 candidate bacteria) with highest z-score of 7.3
- ?️ Post-exertional malaise ( 175 candidate bacteria) with highest z-score of 6
- ?️ Tinnitus (ringing in ear) ( 133 candidate bacteria) with highest z-score of 6.7
- ?️ Unrefreshed sleep ( 165 candidate bacteria) with highest z-score of 6.9
Social Media Questions
For other tests not covered above, see 16s Providers
On Sun Genomics
On Gut Zoomer
“Show me the beef!” This appears to be pure marketing hype — or more specifically, a substance for microbiome analysis that is high in pathogens!
Gut Zoomer [Est. 2016] – 170 -200 species (per their advertising) must be ordered thru a physician
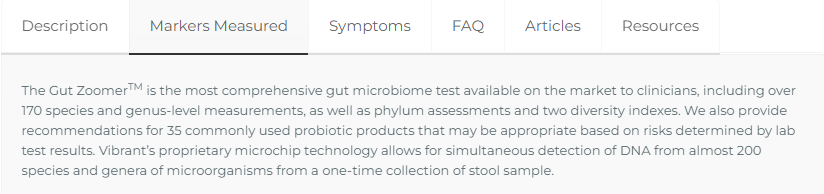
While Xerogene typically reports TEN TIMES as many!!! It is DEFINITELY NOT THE MOST COMPLETE, it is infact at the bottom of their first class competitors but the top of second class competitors.
What about Biohm?
Based on their official View a sample report. they report on only 44 bacteria items.


Recent Comments