As we have seen, the microbiome is NOT a normal or bell curve. I struggled for almost a year trying to get statistical significance out of the data with parametric techniques. While I did get some results, the results were disappointing. When I switched to a non-parametric approach, I shouted EUREKA (without becoming a streaker thru town, unlike a certain ancient greek did).
In the last post we dealt with both continuous and category factors associated with a person. In terms of my existing site, using symptom explorer you will see tables such as the one shown below with used 4-quantilies.
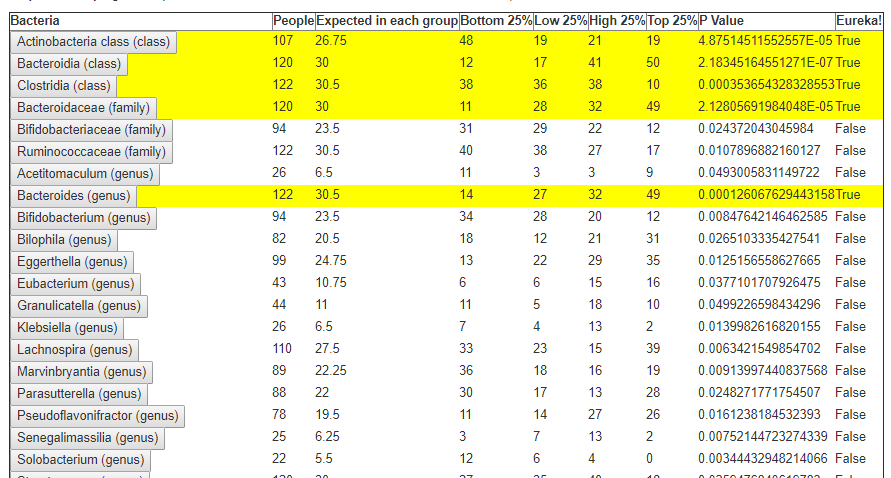
In our earlier post on statistics, we saw how we can compute the quantiles for the available taxonomy. In this lesson we will use that data plus a category variable to detect significance as shown above in real time. This means that the results may change as more data is added — to me, this makes it a living research document.
First the Nerd Stuff — Moving to Libraries
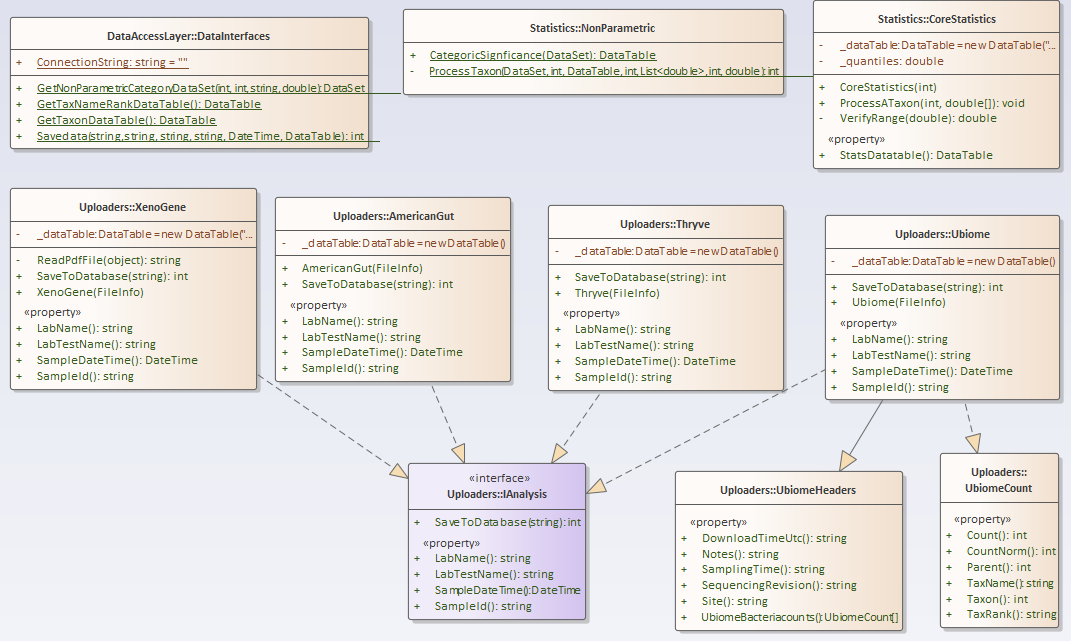
For this example, I have consolidated into a library most of the key stuff from prior posts. The class diagram is below. I plan to keep expanding it with future posts.
https://github.com/Lassesen/Microbiome2/tree/master/MicrobiomeLibrary
Computating the non-parametric
This is done by selecting a LabTest (remember that technically we cannot compare uBiome numbers to XenoType numbers to Thryve numbers) and then some Category. I opted not to go down the control group to category group path because with my donated data, it is not reliable. I opted to go down the population to category group path, which while technically less sensitive — it is a reasonable approach.
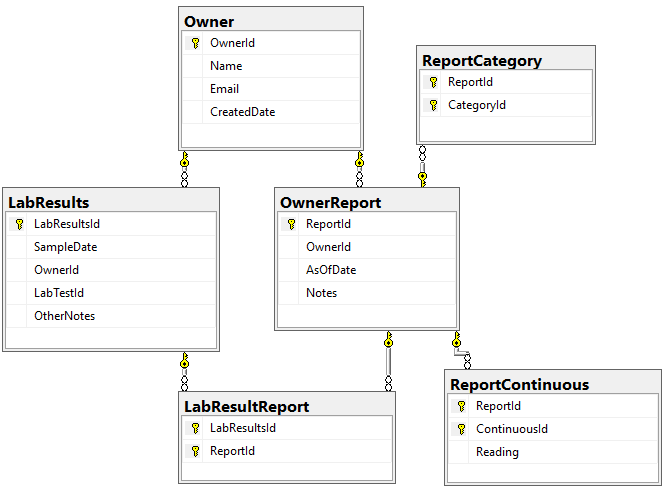
We need to associate Category and Continuous Reports to Lab Results and this means just adding one new table LabResultReport as shown below, it links two timeline items together.
From the @LabTestId and @CategoryId we just need to select which quantile to use. Did we divide data into 3,4,5,6,7 etc. buckets. If you look at the prior post, we see that it is easy to select which one, “Q3_”, “Q4_”, etc is the @quantileRoot. We need one more value: @MinSamples – if we do not have at reasonable number, there is almost no change of getting significant. I usually require 4 data points per bin — so Q3_ -> 12, Q4_-> 16, Q5->20.
Passing these number to a stored procedure, we get a dataset back as shown below:
- Quantiles
- Taxon
- Count
- StatisticsValue
- StatisticsName (i.e. Q3_1,Q3_2 or Q4_1,Q4_2,Q4_3 etc)
- User Data
- Taxon
- Value
- Taxon Data
- Taxon
- TaxonName
The process is simply counting the data in User Data in each range and then applying some simple statistics to get P Values.
In terms of the calling program, the code is very simple:
var data = DataInterfaces.GetNonParametricCategoryDataSet(1, 1, "Q4_", 20);
var matrix = MicrobiomeLibrary.Statistics.NonParametric.CategoricSignficance(data);
matrix.WriteXml("Matrix.xml");
I just dump the data to a file for simplicity sake. You can open this file via excel to get a nice spreadsheet.
For myself, I wrote a long running (24hrs) program that iterated thru the range of values for Categories (and combinations of categories!) with different quantiles.
https://github.com/Lassesen/Microbiome2/tree/master/ConsoleTestLibrary
Homework
When we work with Continuous variables, we need to convert the ranges into quantiles (just like we did for taxon). This could be done using the ranges we entered, or by breaking into quantiles. Personally, using quantiles would be my preference because too many numbers are not bell/normal curves but are assumed to be just that. I will leave people to do pull requests with their code suggestions.
Recent Comments