There are many approaches that can be taken. With the same data, different methods can reap a huge variation of harvest (i.e. the number of statistically significant relationships found).
I will use the Pearson’s Chi2 to determine significance and a simple “does the presence of bacteria A results in a shift of bacteria B”. By a shift, I mean either an increase/decrease of the number of bacteria above a threshold or below count. The threshold for bacteria count varies from bacteria to bacteria, and lab to lab.
To illustrate:
| Bacteria Present | Bacteria Impacted | Low Zone | High Zone |
| Lactobacillus | Rickettsieae | 528 | 185 |
The naive “expected number” is (528+185)/2=356.5, The actual expected number is lower 198 for both zones, yielding a chi2 of 647! The middle values have shifted lower. The conclusion that having Lactobacillus reduces the risk of Rickettsieae appears confirmed in publications such as Use of Lactobacillus to prevent infection by pathogenic bacteria [2002].
Looking in the opposite direction, we have a reduced Chi2 of just 29 with the apparent intrepretaion being that the prescience of Rickettsieae reduces Lactobacillus slightly (‘Odds ratio’ of 1.35, versus 2.66 going the other direction).
| Bacteria Present | Bacteria Impacted | Low Zone | High Zone |
| Rickettsieae | Lactobacillus | 268 | 202 |
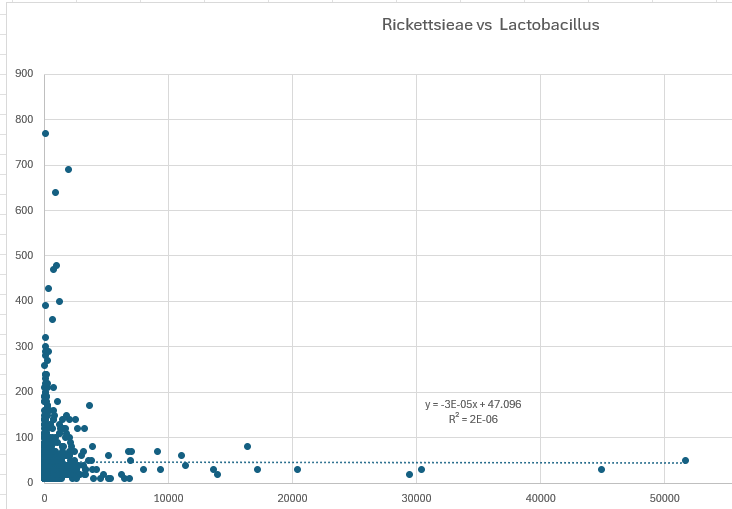
IMHO, this approach yields more significant findings than looking at the differences of averages using standard deviations. Some people will attempt to find a linear regression between the counts of Lactobacillus and Rickettsieae. An example using the same data is below. I will leave it to the reader to reconcile.
A key philosophical question is whether we need to use all data, or only data that is significant. My resolution of this question is that the high and low levels are what is significant and the middle data is effectively just noise. Determining the cutoff points with backing mathematics/statistics is essential.
This week’s presentation from The Institute for Systems Biology was the inspiration for this post and data extraction.
In Action
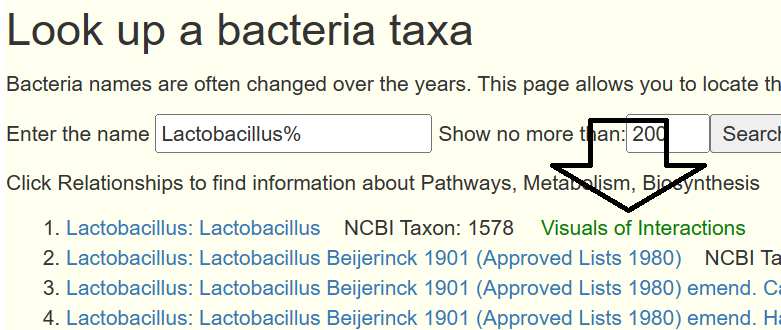
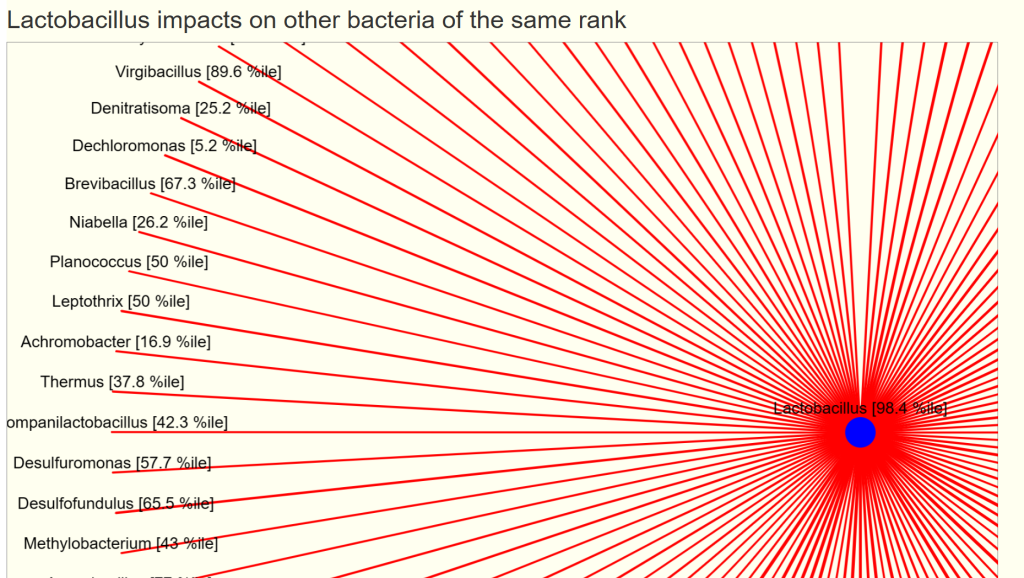
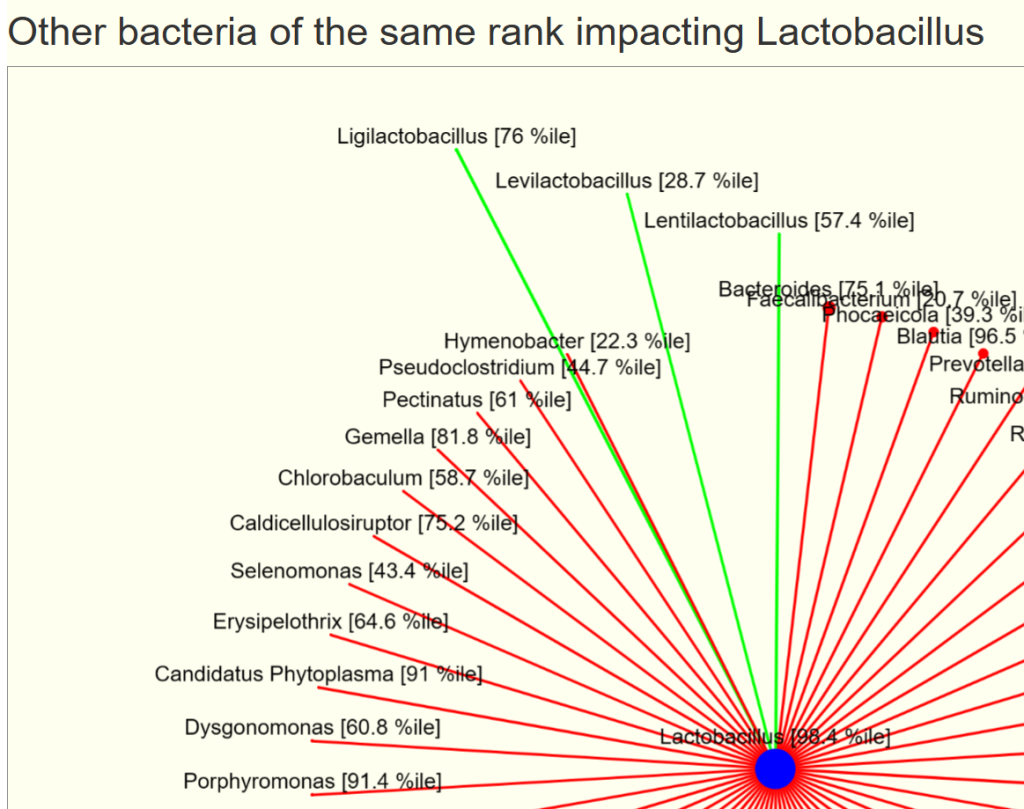
I have put interactions between bacteria of the same rank into Look up a bacteria taxa web site. Just search for a bacteria of interest and click the link.
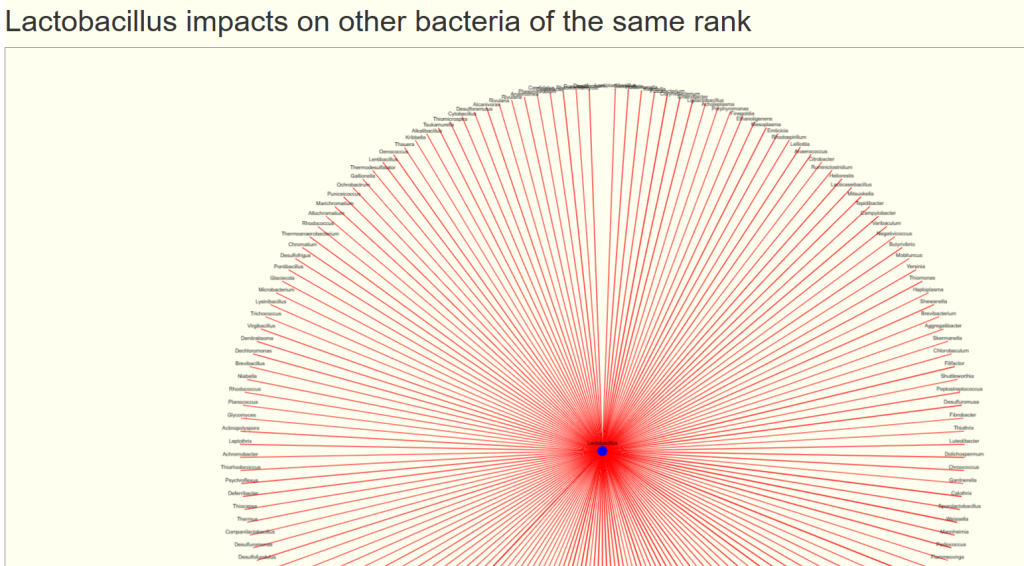
You will see two charts, impacts and impacted by. For our example bacteria, we see that three other genus increases it (and looking at the names, no surprise!)
- The size of the circles reflect the relative average count scaled
- The width of the lines reflect the relative chi2 (significance), thicker lines implies more impact.
- Green indicates increases/feed
- Red indicates decreases/reduces
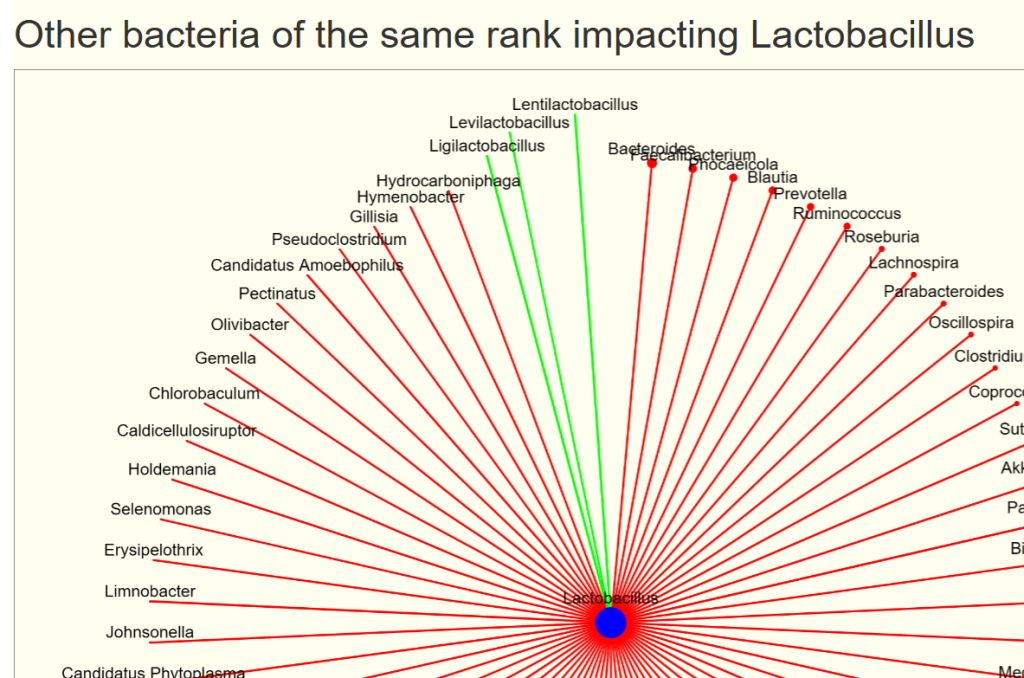
And a ton of bacteria that is reduced by its presence.
Applying to a Sample
Many of the bacteria above are rare. With an explicit sample, we filter to what is shown in the sample. We display them with their percentile ranking (i.e. a good indicator of relative amount)
Data Availability
The data (over 400K statistically significant impacts) will be available at MicrobiomePrescription Citizen Science for anyone wishing to compare against their own data. The data used was from Biomesight, a 16s provider that ships worldwide.
Recent Comments