Recently, I released Odds Ratio–based suggestions and reports, such as the example shown here.
The underlying concepts are straightforward:
If you are in an unhealthy range, the goal is to move out of that range.
If you are not in an unhealthy range but fall outside a defined healthy range, the goal is to move into the healthy range.
For healthy ranges, interpretation is simple—you are either too high or too low, so the direction of adjustment is clear.
If the range is 10%ile to 30 %ile and you are at 29%ile, should you increase or decrease?
If the range is 70%ile to 90 %ile and you are at 85%ile, should you increase or decrease?
Unhealthy ranges, however, are more nuanced.
For example:
If the unhealthy range is the 10th to 30th percentile and your value is at the 29th percentile, should you increase or decrease?
If the unhealthy range is the 70th to 90th percentile and your value is at the 85th percentile, should you increase or decrease?
The core issue is understanding why the range is considered unhealthy—specifically, whether the problem arises from having too little of something or too much.
Lactobacillus delbrueckii
Unhealthy: 0 – 45%ile
Healthy: 48%- 72%ile
Lactobacillus gasseri (A Surprise!): 0 -100%ile is Unhealthy
Lactobacillus johnsonii: 0 – 72%ile Healthy
Lactobacillus taiwanensis: 23-56%ile Unhealthy
Limosilactobacillus reuteri: 0-52%ile Unhealthy
The above numbers are slightly suspect because many are P > 0.002, so may not be significant.
Confidence
Bacteria this or less significant
Bacteria More Significant
P < 0.001
2081 Ranges
694 Ranges
P < 0.0001
2383 Ranges
392 Ranges
P < 0.00001
2495
280
A List of Families with high significance
It is interesting to note that neither Lactobacillaceae (Lactobacillus) nor Bifidobacteriaceae (Bifidobacterium) were found to be significant at this level. Nor were they at the genus level, only at the specific species level (see below)
tax_name
Range
Nature
Anaplasmataceae
0 to 75
Unhealthy
Bartonellaceae
0 to 79
Unhealthy
Chlorobiaceae
0 to 58
Unhealthy
Chrysiogenaceae
0 to 83
Unhealthy
Clostridiales Family XVI. Incertae Sedis
0 to 100
Unhealthy
Comamonadaceae
0 to 28
Unhealthy
Comamonadaceae
34 to 52
Unhealthy
Cyanobacteriaceae
21 to 99
Unhealthy
Deinococcaceae
0 to 46
Unhealthy
Desulfonatronaceae
0 to 50
Unhealthy
Enterococcaceae
0 to 66
Healthy
Enterococcaceae
68 to 71
Unhealthy
Euzebyaceae
13 to 100
Unhealthy
Hyphomicrobiaceae
0 to 87
Unhealthy
Kiloniellaceae
20 to 99
Unhealthy
Legionellaceae
0 to 100
Unhealthy
Listeriaceae
74 to 88
Unhealthy
Litorivicinaceae
0 to 18
Unhealthy
Lysobacteraceae
0 to 27
Unhealthy
Methylophilaceae
0 to 96
Unhealthy
Nostocaceae
14 to 88
Unhealthy
Oxalobacteraceae
0 to 30
Unhealthy
Pseudanabaenaceae
0 to 100
Unhealthy
Shewanellaceae
0 to 73
Unhealthy
Sporolactobacillaceae
0 to 100
Unhealthy
Streptosporangiaceae
53 to 88
Unhealthy
Symbiobacteriaceae
0 to 81
Unhealthy
Synechococcaceae
0 to 9
Unhealthy
Synechococcaceae
48 to 85
Unhealthy
Thermoanaerobacterales Family III. Incertae Sedis
3 to 50
Unhealthy
Thiotrichaceae
7 to 100
Unhealthy
Weeksellaceae
0 to 100
Unhealthy
Significant Bifidobacterium Species
tax_name
Range
Nature
Bifidobacterium adolescentis
0 to 49
Unhealthy
Bifidobacterium angulatum
0 to 73
Healthy
Bifidobacterium breve
0 to 76
Unhealthy
Bifidobacterium catenulatum
0 to 100
Healthy
Bifidobacterium dentium
0 to 50
Unhealthy
Bifidobacterium scardovii
0 to 79
Unhealthy
Significant Lactobacillus Species
tax_name
Range
Nature
Lacticaseibacillus brantae
33 to 70
Unhealthy
Lactobacillus acidophilus
0 to 76
Unhealthy
Lactobacillus amylovorus
0 to 100
Unhealthy
Ligilactobacillus murinus
0 to 100
Unhealthy
Summary
I am hoping to expand the size of my “Healthy Samples” in the next weeks. This should improve the ranges and significance.
For example, Odoribacter denticanis was only 0.002%, Clostridium akagii was 0.002%, and Symbiobacterium was 0.004%. The natural question is whether bacteria present at such tiny levels could have any meaningful impact. Interestingly, these values are not extreme outliers; they appear to be fairly common at these levels.
There are several ways to approach microbiome adjustment. One is to focus on bacteria that dominate the microbiome. Another is to target bacteria with extreme values. A third is to focus on bacteria whose mechanisms of impact are known, such as those that produce metabolites linked to leaky gut.
My own approach is based on strong statistical associations. Association does not prove causation, and in microbiome research, the causal details are often not well established. My working assumption is that bacteria strongly associated with a condition are likely influencing it, perhaps through metabolites they produce or consume. If so, reducing those bacteria should reduce the metabolic effect.
The low-abundance dilemma
The microbiome can be thought of as a population, much like a country’s human population. If there were 989 billionaires[Forbes] in the United States, that would still be only about 0.0003% of the population. Yet few people would conclude from that alone that billionaires have little influence on the country. In practice, a very small number of highly influential actors can still shape outcomes in major ways.
The same logic applies to microbiome analysis. Low abundance does not necessarily mean low impact.
The odds ratios used here are not based on an ideal dataset, but on the best data currently available. The choice is not between perfect evidence and flawed evidence; it is between using the best evidence now or waiting indefinitely for perfect data. In that sense, this is a best-effort approach grounded in the data we have rather than silence in the face of incomplete evidence.
Reader Response
I think the question is whether such low values represent an actual organism or noise. I remember in the days of Ubiome, a reading of 0.001% meant only a single organism was found. Ubiome actually discarded it if there was only one found. They only reported if there were two or more. Thryve otoh, reported everything, which is one of the reasons they found more than Ubiome.
ofc, some of these results are more than one organism, but the question still remains as to whether this is a real organism or noise. It just seems that there are a lot of variables in this analysis with big error margins, and you are compounding them by bundling them all together. The error margin in the final result is likely huge.
Resolution
The way to handle this issue was requiring the raw count to be at least 5. This should reduce the noise level to acceptable levels. The dilemma remains on identification differences between tests (See this post for details). With aggregation across different tests, this issue should be reduced.
In the decades that I have been working with the microbiome, the scientist in me have become very troubled. Some of the key concerns have been:
Massive inconsistency between tests results in terms of percentage of different bacteria found [more information]
Medical practitioner picking certain key bacteria to focus on based on rote or hearsay.
No studies showing any bacteria are more important than other possible bacteria.
Suggestions often do not consider counter-indication / adverse effects on other bacteria
Healthy ranges are determined using normal distributions (Normal Range) which is grossly invalid given the typical bacteria distributions [more information]
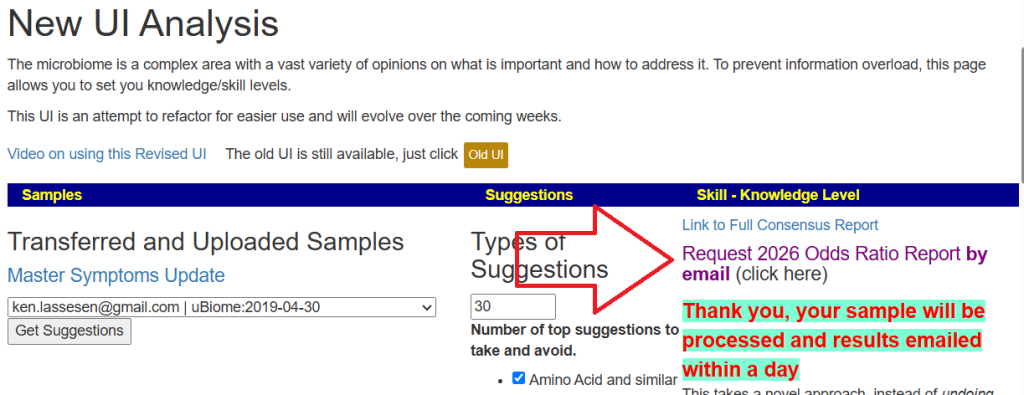
Microbiome Prescription current suggestion algorithms appears to have over a 75% chance of improving microbiome tests results (with typical subjective improvement reported) [more information]. For those not responding well to those suggestions, I have been researching an alternative, more rigorous, approach based on computationally intense computation. This method is not practical to run on a website, instead it is computed off-line and then emailed to the person.
The new suggestions are based on the following:
Using Percentile ranking for better comparison
Using Odds Ratios (a rigorous statistical process using P < 0.001) to select bacteria
Every suggestion is checked against every selected bacteria to insure no adverse effect
The new suggestions set consists of three reports:
Focus on the top 20 bacteria associated with being unhealthy
Focus on the top 20 bacteria associated with being healthy
Focus on the top 40 bacteria associated with both unhealthy and healthy
Selection is based on the statistical significance. Why three? As more and more bacteria are added to the target bacteria, the fewer modifiers are left that does not have adverse effect on some of the bacteria.
The goal is to shift the bacteria outside of the unhealthy range. Often it is to eliminate it, but in other cases it may be just to push it up and outside the range.
Nostocaceae [family] [1162] 47.5 %ile Unhealthy Range [14 – 88], Plan:Decrease Signif: 36.74, Odds:-4.34 Decreases This Bacteria
No Substances without adverse effect on other bacteria
Klebsiella [genus] [570] 46.1%ile Healthy Range [1 – 56], Plan:Increase Signif: 26.39, Odds:-3.40 Increases This Bacteria
4 :Sinapis alba {yellow mustard} @Food (excluding seasonings)
4 :Cathelicidin antimicrobial peptide {LL37} @Amino Acid and similar
3 :Bixa orellana {annatto } @Herb or Spice
3 :Rhus coriaria {Sumac} @Herb or Spice
2 :Withania somnifera {Ashwagandha} @Herb or Spice
Streptococcus alactolyticus [species] [29389] 99.0%ile Healthy Range [1 – 75], Plan:Decrease to Healthy Range Signif: 17.33, Odds:1.55 Decreases This Bacteria
5 :Olea europaea {Olive leaf} @Herb or Spice
5 :Micromeria fruticosa {White-leaved Savory} @Herb or Spice
When new suitable samples are uploaded, these reports are automatically generated and email within a day.
If you want an older sample processed, just click this link on the site
Note: If you do not receive it in 36 hours, check your spam and trash folders.
After some user feedback, a single report is sent. This report looks at bacteria in the unhealthy range and those that are outside of the healthy range. Most bacteria has one OR the other.
In common medical practice, bacteria ranges tend to be very random. Often it becomes values above or below average plus/minus 1.96 Standard Deviations. Bacteria are abnormal (i.e. are not a normal or bell curve distribution).
My training is in statistics and operations research. This post and other posts are intended to ask “why not do things this way” and to inspire lifting the bar in approaching the microbiome.
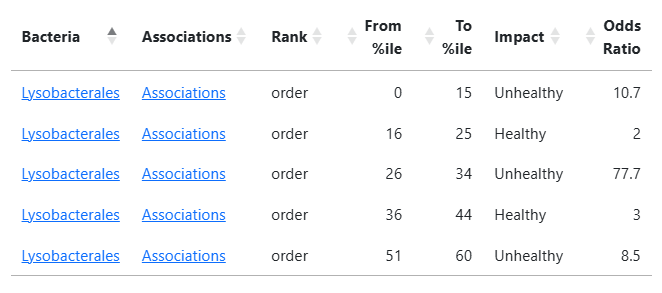
From some 7,500 samples I computed statistical ranges for 2,470 different bacteria with a threshold of Chi2 > 6.6 (around p < 0.01). The higher the odds, the more significant. The ranges apply only is the bacteria was detected in the sample. The page is available here.
So far, most of the numbers appear to follow common sense (see Highlights above). Bacteria with multiple ranges is more of a challenge to understand and exposes a concept close to a “Yin/Yang” of the microbiome.
A more interesting one is: Lysobacterales. The low odds ratios for healthy hints that we may wish to discard those values resulting in < 60 as unhealthy.
Adding to Microbiome Prescription
I am planning to add it as a bacteria selection method using a higher Chi2 value then used for the demo table. Stay tune.
I will be using P < 0.001 to safely identify the bacteria of concern.
The organization Vitract.com recently referenced Jona Health during a conference call, noting that Jona’s platform reportedly incorporates approximately 200,000 studies. This claim prompted closer examination, particularly regarding how such figures are defined and communicated.
Public-facing descriptions of Jona’s methodology indicate that its system has “read” approximately 220,000 peer-reviewed studies, with an ongoing ingestion rate of roughly 2,000 new studies per month as microbiome research evolves. However, the distinction between studies that are “read” versus those that are critically evaluated and actively utilized is nontrivial. The use of the term “read” appears to function as a marketing construct, potentially conflating exposure to literature with meaningful incorporation into a validated analytical framework.
For comparative purposes, equivalent metrics from the Microbiome Prescription database demonstrate substantially greater scale and curation rigor. The system has processed a total of 2,953,169 studies—an order of magnitude greater than the figures cited above. Recent weekly ingestion rates further illustrate this difference:
May 29, 2026: 5,871 new studies
May 22, 2026: 4,984 new studies
May 15, 2026: 5,584 new studies
May 8, 2026: 5,582 new studies
Importantly, each study undergoes manual review prior to inclusion, reflecting the inherent complexity and nuance of microbiome literature that cannot be reliably interpreted through automated methods alone.
More critical than raw ingestion counts is the subset of studies that yield actionable, high-quality data. Within the Microbiome Prescription system, 21,391 studies have been identified as containing usable information and are actively incorporated into the knowledge base. These curated studies underpin approximately 14,518,553 PubMed-derived data points within the expert system. In addition, the platform includes approximately 71,000 experimentally derived bacterial interaction data points sourced from raw datasets.
These distinctions underscore the importance of evaluating not only the quantity of literature processed but also the depth of curation and the proportion of data that is methodologically sound and practically usable.
In conclusion, numerical claims regarding literature scale should be interpreted with caution, particularly when used in marketing contexts. The critical question is not how many studies are nominally “read,” but rather how many are rigorously evaluated and meaningfully integrated into a reliable analytical framework. Microbiome Prescription operates as a not-for-profit, citizen science initiative with the explicit goal of advancing microbiome-informed decision-making through careful curation and transparent methodology, rather than promotional positioning.
Bottom Line
As with all things marketing “Where’s the beef?” and not the hype. Microbiome Prescription is a not profit seeking citizen science endeavor seeking to improve the use of the microbiome.
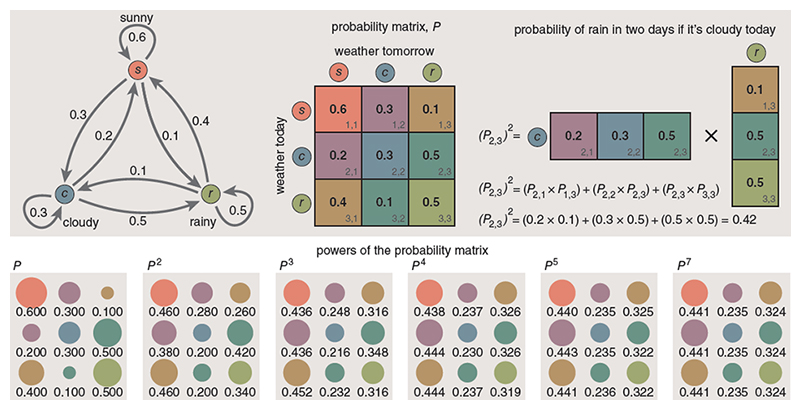
During my Probability and Statistics studies in the early 1970s, I developed a strong interest in Markov chains. The core idea behind a Markov process is straightforward: the next state of a system depends only on its current state and a set of transition probabilities. Given that the microbiome is full of interactions, it seems the ideal model.
In practical terms, this can be represented as a matrix—similar to an Excel spreadsheet—where each column represents an intervention or event, and each row represents a state variable. When a given event occurs, its associated column of values describes how each variable is expected to shift.
To illustrate this concept in a microbiome context, consider a simplified model using R²-derived relationships between probiotics and bacterial taxa. In this matrix, each value represents the directional influence of a probiotic on a specific bacterium, where zero indicates no measurable effect.
Example interaction matrix:
Target Bacteria
Pro 1
Pro 2
Pro 3
Pro 4
A
-0.23
0.44
0.11
0.00
B
0.2
0.32
-0.22
0.14
C
0.18
-0.11
0.11
0.12
D
-0.31
0.13
0.22
-0.28
From this, we can evaluate each probiotic independently by applying its column to the current microbiome state and observing whether each bacterium moves toward or away from its target range.
A simplified qualitative interpretation might look like this:
Target Bacteria
Pro 1
Pro 2
Pro 3
Pro 4
A
n/a
worse
worse
need improvement
B
worse
worse
better
worse
C
n/a
worse
better
better
D
n/a
worse
worse
better
In this example, Probiotic 1 appears to be the best initial choice, as it minimizes negative outcomes relative to the others.
Once the first intervention is applied, we update the microbiome to its predicted new state. This updated state becomes the input for the next evaluation cycle. For instance, after adjusting bacterium B, we might find:
Target Bacteria
Pro 1
Pro 2
Pro 3
Pro 4
B
worse
worse
better
n/a
This suggests that Probiotic 3 is the most suitable follow-up intervention for B.
In practice, this process must be applied across all bacteria simultaneously—including those currently within the acceptable range—to generate a full predicted microbiome after each intervention. The goal is to evaluate all candidate substances and select the one that produces the greatest overall improvement.
By iterating this process, we can construct a sequence of interventions such as:
Herb 1
Probiotic 2
Diet Change 3
Once a candidate sequence is identified, it is important to test whether the order of interventions materially affects the outcome. This can be done by randomizing the sequence and comparing predicted results. If the sequence proves immaterial, then some interventions may be applied concurrently rather than sequentially.
That is the basic concept, the mathematics are a little more complex. How do you estimate the amount of shift?
A Rule of Thumb
My working assumptions are:
All bacterial abundances are converted to percentiles, with defined target percentile ranges.
For probiotics, assume a ±10 percentile shift scaled by the R² relationship for a given bacterium.
For other substances, estimate impact based on available studies:
One study: approximately 1 percentile shift.
Mixed evidence: net effect equals positive studies minus negative studies (e.g., 8 positive and 2 negative yields a 6 percentile shift).
Cap the maximum effect at 10 percentiles regardless of study volume.
These values are approximations and likely imperfect, but they provide a consistent framework given current data limitations.
Method Summary
Convert microbiome measurements into percentiles.
Identify bacteria that fall outside their target ranges.
Apply each candidate intervention to the current state and compute the predicted microbiome.
Select the intervention that produces the greatest reduction in out-of-range bacteria (or other chosen objective function).
Update the microbiome to this predicted state.
Repeat the process until all bacteria are within range or no further improvement can be achieved.
The result is an ordered sequence of interventions designed to progressively normalize the microbiome. Questions of dosage, duration, and clinical appropriateness are intentionally excluded from this model and should be addressed by qualified professionals.
This is a major transition from “Let us try this and see what happens” to an objective/numeric prioritization based on a reasonable mathematic model. Odds are, that the results will be better for the patient.
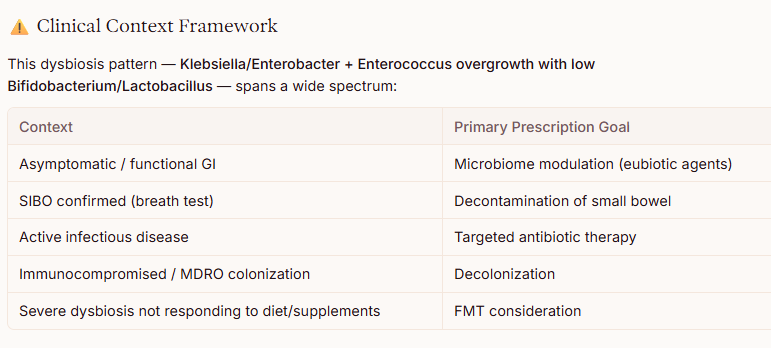
I am going to use microbiome data from the 1998 Alison Hunter Memorial Foundation conference on ME/CFS. The pattern reported is very common with sufferers of ME/CFS and Long COVID. I will use that report to phrase some questions. In theory, this is what could have been suggested by a progressive MD using AI in 1999. At the bottom are some comments from reviewing these responses. I have not mentioned the condition to the AI.
With a microbiome with decreased E.Coli (50% below normal), Bifidobacterium, Lactobacillus AND increased klebsiella/Enterobacter and Enterococcus how should a patient diet and supplements be changed?
With a microbiome with decreased E.Coli (50% below normal), Bifidobacterium, Lactobacillus AND increased klebsiella/Enterobacter and Enterococcus what prescription drugs be given?
Remember, with multiple answers from different experts:
Just go there and copy the above questions for full details including references.
A high-fiber, plant-rich diet is the most evidence-supported single intervention — it creates SCFA production, lowers colonic pH, and suppresses Enterobacteriaceae overgrowth
Prebiotics (inulin, FOS, GOS) selectively stimulate Bifidobacterium and Lactobacillus and attenuate Enterobacteriaceae blooms
Berberine shows antimicrobial activity against Klebsiella and Enterococcus at gut-relevant concentrations but caution is warranted as it may paradoxically increase Enterococcus in some contexts
Avoid refined carbohydrates, simple sugars, and ultra-processed foods — these preferentially fuel Enterobacteriaceae and Enterococcus growth
Importantly, note that the low E. coli finding is likely a relative reflection of the Enterobacteriaceae dysbiosis, not an independent deficiency requiring specific treatment
Simple sugars feed pathogenic bacteria and worsen dysbiosis
Feed Bifido & Lactobacillus
High diverse fiber from non-starchy veggies: leafy greens, broccoli, cabbage, zucchini, cucumbers, bell peppers, mushrooms, asparagus (if tolerated), artichokes
Fiber → short-chain fatty acids (SCFAs) that protect against pathogens and support beneficial bacteria
Low-FODMAP prebiotics if SIBO symptoms: start with psyllium husk, small amounts of oats, berries, citrus, carrots, green bananas
Supports good bacteria without excessive fermentation; high-FODMAP prebiotics (garlic/onion/jerusalem artichoke) can worsen SIBO initially
Use under professional guidance only; cycle (e.g., 2–4 weeks), then re-test. Avoid long-term use.
E. coli probiotic (Mutaflor/Symbioflor)
Contains specific E. coli Nissle strain to replenish low E. coli; used clinically for gut balance
Discuss with clinician; some protocols pulse then maintain
Prescription
No specific “best” prescription drug is indicated purely by this microbiome pattern; if treatment is needed, clinicians usually treat it as small intestinal/colonic bacterial overgrowth with short courses of narrowest‑possible antibiotics guided by symptoms, cultures, and resistance patterns, plus a prescription‐grade probiotic such as E. coli Nissle in some cases.
A Mediterranean-style dietary pattern rich in fruits, vegetables, whole grains, legumes, nuts, olive oil, and fish is the best-supported overall framework. This pattern is associated with favorable gut microbial profiles, increased fiber-degrading beneficial bacteria (including Faecalibacterium and Ruminococcus), and lower subclinical intestinal inflammation. [1-3] Ultraprocessed foods should be minimized, as they are linked to dysbiosis. [1]
Key dietary components to emphasize:
Prebiotic fibers — particularly fructans (inulin, FOS) and galacto-oligosaccharides (GOS) — have the strongest evidence for selectively increasing Bifidobacterium and Lactobacillus abundance. A meta-analysis of 64 RCTs (n=2099) demonstrated significantly higher Bifidobacterium (SMD 0.64, P<0.00001) and Lactobacillus (SMD 0.22, P=0.02) with dietary fiber interventions, with fructans and GOS showing the greatest effect. Food sources include chicory root, garlic, onions, leeks, asparagus, bananas, and Jerusalem artichokes. [4]
Resistant starch (found in cooked-and-cooled potatoes/rice, green bananas, legumes, and whole grains) acts as a fermentable substrate that promotes Bifidobacterium and Lactobacillus growth and increases butyrate production. [5-6]
Polyphenol-rich foods — berries, apples, grapes, green tea, dark chocolate, and extra-virgin olive oil — may help suppress Enterobacteriaceae (including Klebsiella). In vivo studies show resveratrol, phloretin (apples/strawberries), and other polyphenols can reduce Enterobacteriaceae levels while promoting beneficial bacteria, though most data are from animal models. [7-8]
Lactose restriction may be worth considering given the Enterococcus overgrowth. A recent study in a transplant unit found that implementing a lactose-free diet significantly reduced VRE carriage (16% → 3.6%), consistent with evidence that lactose can fuel Enterococcus growth. [9]
Fermented foods — yogurt, kefir, kimchi, sauerkraut, miso — provide live Lactobacillus and Bifidobacterium species that can transiently colonize the gut and modulate the microbiome. A high-fermented-food diet has been associated with increased microbial diversity and decreased inflammatory markers. [10-12]
Supplement Recommendations
Probiotic supplementation with multi-strain formulations containing Bifidobacterium (B. longum, B. lactis, B. bifidum) and Lactobacillus (L. rhamnosus, L. acidophilus, L. plantarum, L. paracasei) species is the most direct approach to replenishing depleted populations. L. paracasei CNCM I-3689 has specifically been shown to reduce Enterococcus persistence and promote Bacteroidetes recovery in a dysbiosis model. Probiotics suppress pathogens through competitive exclusion, bacteriocin production, pH lowering, and gut barrier enhancement. [13-17]
Prebiotic supplements — inulin-type fructans (ITF) and arabinoxylan-oligosaccharides (AXOS) — selectively stimulate Bifidobacterium growth and promote butyrate production through cross-feeding with butyrate-producing bacteria. A synbiotic approach (combining prebiotics with probiotics) may enhance probiotic colonization and provide synergistic benefits. [14][18-19]
Butyrate supplementation or butyrate-promoting strategies may help strengthen the gut barrier and create an environment less favorable to facultative anaerobes like Klebsiella and Enterococcus, as butyrate lowers colonic pH and supports epithelial integrity. [16][18]
Prescription
It is important to emphasize that no prescription drugs are FDA-approved specifically for treating gut dysbiosis as identified by stool microbiome testing. The clinical significance of specific bacterial abundance thresholds on commercial microbiome panels remains debated, and treatment should be guided by symptoms and clinical context rather than microbiome test results alone. That said, several prescription medications can be considered based on the specific dysbiotic pattern described:
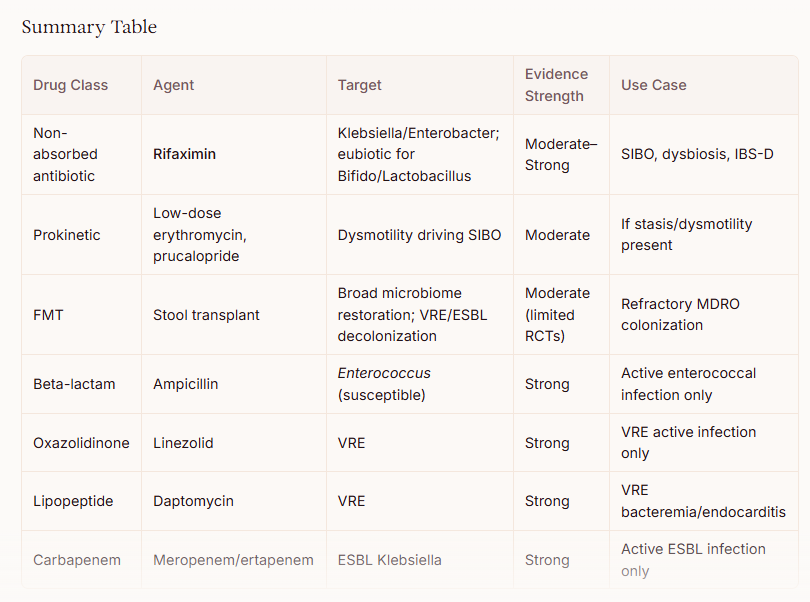
Rifaximin (Xifaxan) — The Most Relevant Prescription Option
Rifaximin 550 mg TID for 14 days is the prescription drug with the strongest rationale for this dysbiotic profile. Unlike conventional antibiotics, rifaximin has unique “eubiotic” properties — it selectively increases Lactobacillus and Bifidobacterium abundance while suppressing pathobionts, without significantly disrupting overall microbial diversity. [1-3] Metagenomic analyses have confirmed a significant increase in Lactobacilli persisting in the short term after rifaximin treatment, independent of the underlying disease. [2] Rifaximin also reduces bacterial virulence and translocation, and has anti-inflammatory effects via PXR nuclear receptor activation. [4] The ACG recommends rifaximin as first-line therapy for SIBO at 550 mg TID for 14 days, with an overall ~70% eradication rate. [5-8] However, SIBO is not an FDA-approved indication, and insurance coverage may be challenging. [5]
E. coli Nissle 1917 (Mutaflor)
For the specific finding of depleted E. coli, E. coli Nissle 1917 (marketed as Mutaflor) is a prescription-grade probiotic available in some countries (Germany, Canada) but not FDA-approved in the United States. It is the only probiotic recommended in ECCO guidelines as an effective alternative to mesalazine for maintenance of remission in ulcerative colitis. [9] EcN stimulates human β-defensin 2 production, protects the mucosal barrier, and has demonstrated antagonistic effects against Salmonella, Shigella, and other invasive commensals. [10-11] It directly addresses the depleted commensal E. coli niche.
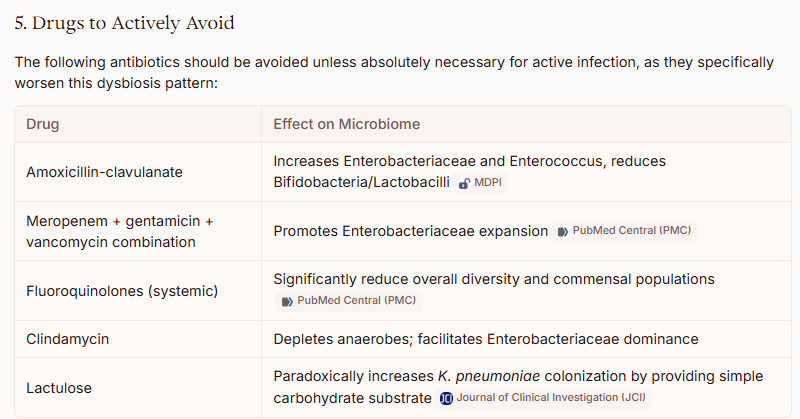
If the Klebsiella/Enterobacter overgrowth is causing clinical infection (not merely colonization), targeted antibiotics may be warranted:
For susceptible Enterobacterales: fluoroquinolones (ciprofloxacin), TMP-SMX, or amoxicillin-clavulanate based on susceptibility testing [5-6]
For AmpC-producing Enterobacter: cefepime is recommended by IDSA guidelines [12-13]
For ESBL-producing organisms: carbapenems (meropenem, imipenem) are preferred for serious infections [14-15]
However, broad-spectrum antibiotics for asymptomatic colonization are not recommended, as they would likely worsen the underlying dysbiosis. [6]
Antibiotics Targeting Enterococcus Overgrowth
Similarly, Enterococcus overgrowth in the absence of clinical infection does not typically warrant antibiotic treatment. If treatment is needed:
Ampicillin/amoxicillin is preferred when susceptible [16]
For VRE: linezolid or daptomycin have demonstrated clinical efficacy [16]
A novel decolonization approach combining bowel preparation with polyethylene glycol, oral linezolid + non-absorbable daptomycin, followed by Lactobacillus rhamnosus GG to maintain colonization resistance, has shown success in clearing VRE carriage in a small case series. [17]
Low-fermentation, low-starch approach initially: Klebsiella and Enterobacter thrive on resistant starch and certain fibers, producing gas, LPS, and histamine. A temporary low-FODMAP + low-starch phase (2–4 weeks) helps reduce their load.
Prebiotics with caution: Instead of high-FODMAP fibers (inulin, chicory, large amounts of legumes), use acacia fiber or PHGG (partially hydrolyzed guar gum) in small, increasing doses—these favor Bifidobacteria without overly feeding Klebsiella.
Polyphenol-rich foods: Berries, green tea, pomegranate, dark chocolate (>70%), and olive oil. Polyphenols inhibit Enterococcus and Klebsiella while promoting Lactobacillus.
Animal protein + low-carb vegetables: Grass-fed meat, eggs, fish, and leafy greens—limited fermentation in the colon.
Fermented foods if tolerated: Small amounts of sauerkraut, kimchi, or kefir (start with 1 tbsp) can reintroduce beneficial strains, but watch for histamine reactions due to possible gut permeability.
Colostrum or immunoglobulin G (IgG) – binds LPS from Enterobacter and helps clear pathobionts.
Butyrate (tributyrin or resistant starch only after pathogens reduced) – feeds colonocytes, suppresses Enterococcus.
3. Special considerations
Low E. coli means reduced production of colicins (natural antimicrobials against Klebsiella). In some contexts, supplementing a non-pathogenic E. coli strain (like E. coli Nissle 1917, Mutaflor) can be beneficial, but use only after pathogen load is reduced, and under medical guidance (risk of UTI in susceptible patients).
Low Bifidobacterium and Lactobacillus → consider human milk oligosaccharides (HMOs) like 2’FL (1–2 g/day) – very specific prebiotic for Bifidobacteria, minimally used by Klebsiella.
Biotin and B vitamins – overgrowth of Klebsiella/Enterococcus consumes biotin; supplementation may help host metabolism.
Prescription
? 1. Treating the Overgrowth: A Targeted Approach
Prescription antibiotics are only indicated if the overgrowth of Klebsiella, Enterobacter, or Enterococcus is causing a confirmed active infection (e.g., urinary tract infection, pneumonia, bacteremia) or a diagnosed condition like Small Intestinal Bacterial Overgrowth (SIBO).
If treatment is necessary, the choice is not one-size-fits-all. Because these bacteria have high rates of antibiotic resistance, therapy must be guided by antibiotic susceptibility testing (culture and sensitivity) .
Overgrown Organism
Condition
Potential Prescription Approach
Klebsiella / Enterobacter
Confirmed SIBO or specific infection
Rifaximin is a non-absorbable antibiotic often used for SIBO, but studies show its effectiveness varies significantly. It inhibits only about 43.6% of Klebsiella and 34.8% of Enterobacter strains . For systemic infections, other antibiotics like third-generation cephalosporins, carbapenems, or fluoroquinolones may be used, but this depends entirely on resistance testing .
Enterococcus
Confirmed infection (e.g., UTI, bacteremia)
Ampicillin or amoxicillin are the agents of choice for susceptible strains . High-level resistance is common, especially with E. faecium, often requiring infectious disease consultation for drugs like linezolid or daptomycin .
Important note on antibiotics: Using systemic antibiotics to target the bacteria in the gut lumen is generally avoided. It will likely worsen the underlying dysbiosis by further reducing beneficial Bifidobacterium and Lactobacillus, which are already low .
? 2. Restoring the Microbiome: Fecal Microbiota Transplantation (FMT)
Rather than using a drug to kill the “bad” bacteria, a more logical approach to restoring the balance of E. coli, Bifidobacterium, and Lactobacillus is Fecal Microbiota Transplantation (FMT).
FMT involves infusing healthy donor stool into the patient’s intestine to directly restore a diverse and balanced microbiome. However, its use is currently restricted by clinical guidelines:
Approved Use: FMT is strongly recommended by the American Gastroenterological Association (AGA) for patients with recurrent Clostridioides difficile infection (CDI) .
Off-Label and Experimental: For the specific pattern of dysbiosis you described (without a CDI diagnosis), FMT is not recommended outside of clinical trials . While Chinese expert consensus suggests it may be explored for severe gut dysbiosis, this is not a standard or approved practice in most other regions .
? A Note on E. coli Restoration
You noted that E. coli is 50% below normal. While E. coli is often thought of as a pathogen, certain strains are a normal part of a healthy gut microbiome. A specific probiotic called E. coli Nissle 1917 has been studied for its ability to support gut health. However, this is generally available as a medical food or supplement, not a standard prescription drug, and should only be used under the guidance of a physician. This is not a standard treatment in most clinical settings.
The most evidence-supported approach is usually to encourage beneficial bacteria through diet rather than trying to eliminate specific organisms.
Increase prebiotic fibers gradually
These preferentially support Bifidobacterium and other beneficial microbes:
Onions
Garlic
Leeks
Asparagus
Jerusalem artichokes
Oats
Barley
Legumes (if tolerated)
Green bananas
Cooked-and-cooled potatoes or rice (resistant starch)
If bloating is severe, introduce these slowly.
Increase diverse plant intake
Studies consistently associate greater microbial diversity with consuming a wide variety of plant foods.
A common target is:
25–40 g/day fiber (depending on tolerance and medical conditions)
20–30 different plant foods per week
Consider fermented foods
If tolerated:
Yogurt with live cultures
Kefir
Sauerkraut
Kimchi
Miso
These may help increase exposure to beneficial microbes, though they do not necessarily permanently colonize the gut.
Limit factors associated with Enterobacteriaceae overgrowth
Klebsiella and Enterobacter belong to the family Enterobacteriaceae.
Potentially helpful:
Reduce ultra-processed foods.
Reduce excessive refined sugars.
Moderate alcohol intake.
Ensure adequate fiber.
Evidence for aggressively restricting carbohydrates specifically to suppress these organisms is limited.
Supplements that may be discussed with a clinician
Bifidobacterium-containing probiotics
Given low Bifidobacterium, strains commonly studied include:
Bifidobacterium longum
Bifidobacterium lactis
Bifidobacterium bifidum
Lactobacillus-containing probiotics
Given low Lactobacillus, strains commonly studied include:
Lactobacillus rhamnosus GG
Lactobacillus plantarum
Lactobacillus reuteri
Prebiotics
Often more effective at increasing resident beneficial bacteria than probiotics alone:
Inulin
FOS (fructooligosaccharides)
GOS (galactooligosaccharides)
Resistant starch
GOS in particular is frequently associated with increases in Bifidobacterium.
Partially hydrolyzed guar gum (PHGG)
PHGG has some evidence for:
Increasing beneficial bacteria
Improving constipation and IBS symptoms in some people
Being better tolerated than some other fibers
Things to be cautious about
Antimicrobial supplements
Products marketed to “kill Klebsiella” or “eradicate Enterococcus” (oregano oil, berberine, etc.) can sometimes further disrupt the microbiome. Whether they are appropriate depends on the clinical situation and should not be based solely on a stool microbiome report.
Very restrictive diets
Long-term low-fiber or highly restrictive diets may further reduce Bifidobacterium and Lactobacillus populations.
Prescription
There is no standard prescription drug regimen that should be given solely because a microbiome report shows low E. coli, low Bifidobacterium, low Lactobacillus, and elevated Klebsiella/Enterobacter and Enterococcus.
In current clinical practice, doctors generally treat diseases and symptoms, not microbiome composition alone. A stool microbiome test cannot reliably determine which prescription drug is appropriate.
Summary
First unfortunate fact is that most retail and many clinical microbiome tests do not accurately measure E.Coli.In my own experience, the E.Coli probiotics cited several times above were very effective (with the warning that it can cause a major die off)
Concerning antibiotics, the Jadin approach of rotating with just one course per month is recommended.
A reader wrote asked about apparent inconsistencies in suggestions. That is a very valid request.
What’s the difference between ‘General suggestions’ on the odds ratio suggestions page and ‘Probiotic suggestions’? The results seem almost unrelated. Two examples: in my results, Bifidobacterium breve is in the ‘General suggestions’ listed as having a negative impact, yet in ‘Probiotic suggestions’ it has a highly positive impact, is even mentioned as the second best probiotic (see image down below)! The one there mentioned as the top probiotic, Enterococcus faecalis, is in my ‘General suggestions’ hardly a suggestion, having barely any positive impact (0.87, with many probiotics having more impact).
Clinical Studies Based versus Modelled Probiotics
When I saw an opportunity to model the impact of probiotics instead of relying on published studies, I jumped at the opportunity. The key reasons are below:
Clinical studies often given contradictory results on the impact of a probiotic on other bacteria.
There are many reasons that this would occur naturally:
The studies were in the context of an existing condition (thus altered microbiome to start with)
The studies used different reference libraries to determine bacteria (See Nightmare post)
The studies usually gives a simple increase or decrease.
Example: for Pseudomonas, we have 2 studies saying it is increased and 2 studies saying it is decreased by B. subtilis
Modelled uses:
Healthy individuals for modelling (thus no existing conditions!)
The same reference library for all samples
The model gives a numeric estimate of how much changes is expected (R2)
What is the practical implementation? Looking at the differences below (The full tables are bottom) we see that the model shows impact on a magnitude more of different bacteria.
In theory, over time, with enough studies on healthy individual with sufficient size of each study, there will likely be convergence of the numbers. Studies are time consuming to do — so these results are likely not likely to be fully available until the next millenium.
Microbiome Prescription generates suggestions using both methods. There is no mechanism to determine which is better. Personally, I prefer the model because there is a lot more data available and the data is quantitative and not a binary of (increase/decrease).
The model assumes this logic:
If you take a (living) probiotic, then the amount in your microbiome will increase and all of the cascading impacts of this increase will likely match the impact of healthy individuals who naturally have more of that bacteria.
Why Contradictions?
There are massive interactions occurring. If you ignore (or have no data) on some impacts, then you can easily go very off course.
Consider Lactobacillus brevis: Assuming that 10% of your bacteria are out of wack, the recommendation with studies would be based on just 2 bacteria (10% of 23). Recommendations from the model would use around 16 bacteria (10% of 157). In short, more factors would be considered.
Back in my Uni days, one of my favorite profs taught probability and was a specialist in models of disease spread. A few of her papers below
Epidemic highs and lows: a stochastic diffusion model for active cases. Journal of Biological Dynamics
The effect of patterns of infectiousness on epidemic size. Mathematical Biosciences and Engineering 5 (2008), 429-435.
Bimodal epidemic sizedistributions for near-critical SIR with vaccination. Bulletin of Mathematical Biology 70(2008), 589-602.
Stochastic epidemic modeling. In: Mathematical and Statistical Estimation Approaches in Epidemiology, Ed. G. Chowell, Springer (2009), 31-52.
Often her work includes the use of Markovian chains. This mathematical framework was a foundation for the work on Microbiome Prescription dealing with bacteria.
Contemporary Pandemics
There are three potential pandemics in scope as summarized in the table below
Disease
Total Cases
Death Rate
Primary Transmission
Incubation Period
Presymptomatic Transmission
SARS
8,422
9.6-11%
Respiratory droplets, aerosols, fomites
2-10 days (median 4-6)
Minimal
COVID-19
779+ million
Variable (~1-2% overall)
Respiratory droplets, aerosols, surfaces
4.9-7.5 days
40-80% of transmission occurs 2-4 days before symptoms
Andes Hantavirus
Hundreds (regional)
36-38%
Rodent excreta inhalation; person-to-person (unique among hantaviruses)
7-39 days (median 18)
Yes, during early prodromal phase
SARS (2002-2003)
The SARS outbreak resulted in 8,422 cases worldwide with 916 deaths, yielding a case fatality rate of approximately 9.6-11%. The virus transmits primarily through respiratory droplets, aerosols, and contact with contaminated surfaces (fomites). The incubation period ranges from 2-10 days (median 4-6 days), with most estimates around 5.3 days. SARS transmission occurs primarily after symptom onset, particularly fever, with minimal evidence of presymptomatic transmission.
COVID-19 (2019-Present)
COVID-19 has caused over 779 million confirmed cases and 7.1 million deaths globally as of 2026, with a variable case fatality rate depending on healthcare access and population demographics. The virus spreads through respiratory droplets, aerosols, and surface contact. The mean incubation period is approximately 4.9-7.5 days, depending on the variant and population studied. Critically, 40-80% of COVID-19 transmission occurs 2-4 days before symptom onset, with presymptomatic individuals consistently accounting for over 50-52% of daily new infections.
Andes Hantavirus
Andes virus causes Hantavirus Cardiopulmonary Syndrome (HCPS) with a case fatality rate of 36-38%. While most hantaviruses transmit only through inhalation of aerosolized rodent excreta, Andes virus is unique among hantaviruses in its capacity for person-to-person transmission, which occurs during the early prodromal phase. The incubation period ranges from 7-39 days (median 18 days), with most cases showing symptoms within 14-32 days after brief exposure. A recent cruise ship outbreak in May 2026 reported 8 cases with 3 deaths. Person-to-person transmission has been documented in household clusters and confirmed through genetic sequencing in Argentina and Chile.
Public Health Official Misinformation
Over the last week, I have seen a constant ignorance (failing to read the literature) as well as “calm the masses” speeches. “All Hanta virus are the same”. I did see one news program that did an interview with an informed Harvard professor.
Causes for Anxiety
As you see above, N95 masks are being used for protection for Hanta virus. Properly fitted N95 respirators have a filtration efficiency of 95-99% for viral particles, translating to a failure rate of 1-5% under optimal conditions. To translate it, with 1 person on a flight with 100 souls, up to 5 new infection could be expected. If every one was wearing N-95 properly , then the odds of another new infection become 1 in 400. Personally, I use P100 masks. The failure rate of P100 respirators is approximately 0.03% for viral particles, compared to N95’s 1-5% failure rate. T
Protection Against Viral Infections
N95 masks reduce the risk of coronavirus infections (SARS-CoV-1 and SARS-CoV-2) by 70% compared to surgical masks (OR 0.30, 95% CI 0.20-0.44). When worn by infected individuals, duckbill N95 masks block 98-99% of COVID-19 viral particles from escaping into the air, reducing transmission risk by up to ninefold when used population-wide and threefold with individual use. [source]
Failure Rates and Limitations
While N95 respirators are highly effective, some penetration occurs at the most challenging particle size (~50 nm). Studies found that penetration rates can slightly exceed 5% at this size, though this may include viral fragments rather than viable infectious particles. The primary failure mode is improper fit rather than filter inadequacy—N95 masks with suboptimal fit still maintain >90% filtration efficiency, but leakage around the edges significantly reduces overall protection. [source]
What will the future reveal?
Detection issue:
For Andes virus specifically, RT-qPCR can detect viral RNA in peripheral blood cells 5-15 days before symptom onset and before antibodies appear. The test demonstrates 94.9% sensitivity and 100% specificity with a very low detection limit of approximately 10 viral copies [source]
So with 42 days before symptoms, a person with Hanta virus will test negative for 27 days (while being contagious), This is very different from the other two virus. The significance of this depends on other factors in the Markov matrix. The prior Chile and Argentina outbreaks was for a localized area (effectively local isolation). The current outbreaks have possible cases flying across the world.
Timeline of the 2026 Andes Hantavirus Cruise Ship Outbreak
Pre-Outbreak Period
November 27, 2025 – April 1, 2026: The index case (Case 1), a Dutch adult male passenger, traveled for four months on a road trip through Chile, Uruguay, and Argentina, where he likely contracted the virus.
April 2026
April 1: MV Hondius, a Dutch-flagged cruise ship, departed from Ushuaia, Argentina with 147 passengers and crew from 23 countries.ecdc.europa+1
April 11: Case 1 died onboard the ship; he is considered a probable case (no microbiological tests were performed).
April 24: The ship stopped at Saint Helena, where Case 1’s body was removed and his wife disembarked; 30 passengers total disembarked at this port.wikipedia
April 26: Case 1’s wife died in a Johannesburg, South Africa hospital.wikipedia
May 2026
May 2: The cluster of severe respiratory illness was officially reported to the World Health Organization (WHO) and CDC; at this time, 34 passengers and crew had disembarked from the ship.cdc+2
May 4: WHO confirmed the outbreak publicly and reported seven infections with three fatalities.pbs
May 6: WHO confirmed the specific hantavirus strain as Andes virus (ANDV) through PCR and sequencing; one additional case was identified.cdc+1
May 7: CDC sent a team to meet the cruise ship in the Canary Islands following its travel from Cape Verde; three ill passengers were evacuated.cdc+1
May 8: WHO reported eight total cases (six confirmed, two probable) including three deaths, for a 38% case fatality ratio; all confirmed cases tested positive for Andes virus.
May 9: CDC issued a Level 3 emergency response and classified the situation as a current outbreak; CDC began coordinating repatriation of American passengers to a specialized medical facility in Nebraska.
May 10: MV Hondius arrived at the port of Granadilla, Tenerife, Canary Islands; disembarkation and repatriation flights began.ecdc.europa
May 11 (as of 14:00): European Centre for Disease Prevention and Control (ECDC) reported nine total cases (seven confirmed, two probable).ecdc.europa
May 15th End of Isolation for persons who meet Patient 1 and did not sail on MV Hondius
June 25th: End of Isolation for persons who sailed on MV Hondius
June 25th: End of Isolation for persons who transferred people from MV Hondius (if N95 failure is considered)
Current Status
As of May 11, 2026, passengers are hospitalized across multiple countries including South Africa, the Netherlands, Germany, Saint Helena, Spain, France, and Switzerland. International contact tracing is ongoing through IHR National Focal Points for all passengers and crew who had contact with confirmed cases. The outbreak has drawn global attention as one of the largest and most high-profile hantavirus clusters in recent history, particularly concerning due to confirmed person-to-person transmission of Andes virus.
Worse Case Scenario
An airline staff flying patients home gets infected from N95 mask failure. This person proceed to fly for the next 5 weeks before becoming sick. This is estimated to having 1,680-2,880 unique passenger contacts. This person is likely to also infect all of their fellow workers, yielding over 10,000 exposures.
Fortunately, the airplane’s air filters do better than N95 so the actual numbers would be significantly less,
N95: ≥95% removal (often higher in practice, but certified at 95%).
The Saving Factor
R₀ (basic reproduction number): Average number of people one infected person will infect in a fully susceptible population.
basic reproduction number
Current Estimates from Literature
SARS
2-4
COVID
2-3
HANTA
< 1.0
If a mutation happens to increase R₀ then we are heading to a new lock down.. We have 8 cases from 1 individual (in a unique environment) which gives a possibility of R₀ being over 1.
Early this year I took one week of antibiotics to deal with possible developing cellulitis. About a year prior, I took the antibiotic for a prior incidence of cellulitis. I have been taking just one regular prescription drug (L) for the last few years.
About two weeks after finishing the antibiotics, I developed itching in the legs which I expected to just fade away. Suddenly I had eye edema as shown, rashes, etc. A lot of other symptoms that my wife (with verified by tests) Mast Cell Activation Syndrome.
At peak
Calming down
Our medical professional prescribed high dosage of multiple anti-histamines. After two weeks there was little progress. After a lot of prompting of an AI, it suggested “L” may be a contributor. I always took this at bed time, and symptoms became much worse at night. I stopped taking it, the result was significant improvement every day since. My wife has told me that I am looking more normal every day, but I still have some distance to go.
A hint of one possible cause?
Although many many symptoms matched my wife’s MCAS symptom, it appears that histamines were not the issue.
“L” breaks down bradykinin, so lisinopril can increase bradykinin levels; this helps vasodilation but is also linked to cough and angioedema risk.
“Bradykinin and mast cell activation can overlap because mast cells may help trigger the kallikrein-kinin system, which can increase bradykinin production. Bradykinin can also increase vascular leak and swelling, so some symptoms can look similar to MCAS flares.” Mast cell degranulation and bradykinin-induced angioedema – searching for the missing link, 2024
Bradykinin can be measured but not usually as a routine clinical test. In practice, doctors usually test for the cause of bradykinin-related swelling rather than measuring bradykinin itself, because bradykinin is very unstable and hard to measure directly in blood. The most direct method is a specialized blood test using LC-MS/MS or a similar lab technique that measures bradykinin and its breakdown products. Some research methods use special sample handling, like drawing blood into chilled tubes and processing it very quickly, because bradykinin can change fast after the blood is drawn, Bradykinin measurement by liquid chromatography tandem mass spectrometry in subjects with hereditary angioedema enhanced by cold activation ,2025
Excessive bradykinin can be treated. In my case, the treatment was easy, stopping L.
Also note: that all of the papers being cited are 2024 and later.
Microbiome Role?
Just before these events I did a microbiome test. In two more weeks I am planning to do a second test. I will attempt to identify possible changes and how such changes could have cause these change.
Stay tune!
Random Notes:
“L” half life is report to be around 50 hrs. using 5 half lives to fully clear “L”, that is 250 hours or 10 days. I am assuming even a small amount of this “toxin” is sufficient for triggering


Recent Comments