Where are we?
- We have implemented a microbiome reference from ncbi data
- We have implemented a medical condition reference from ICD
- We have implement the ability to store personal microbiome values.
- We have implement the computations on microbiome values (including non-parametrics, i.e. quantiles).
In this post we will look at storing personal medical conditions, lab results and symptoms. Medical parameters change over time, we need to date when these parameters is in effect (just like we date when microbiomes are done). All of the information at a particular time is a Report. I have my draft database diagram below (the SQL is uploaded at
https://github.com/Lassesen/Microbiome2/tree/master/DBV2
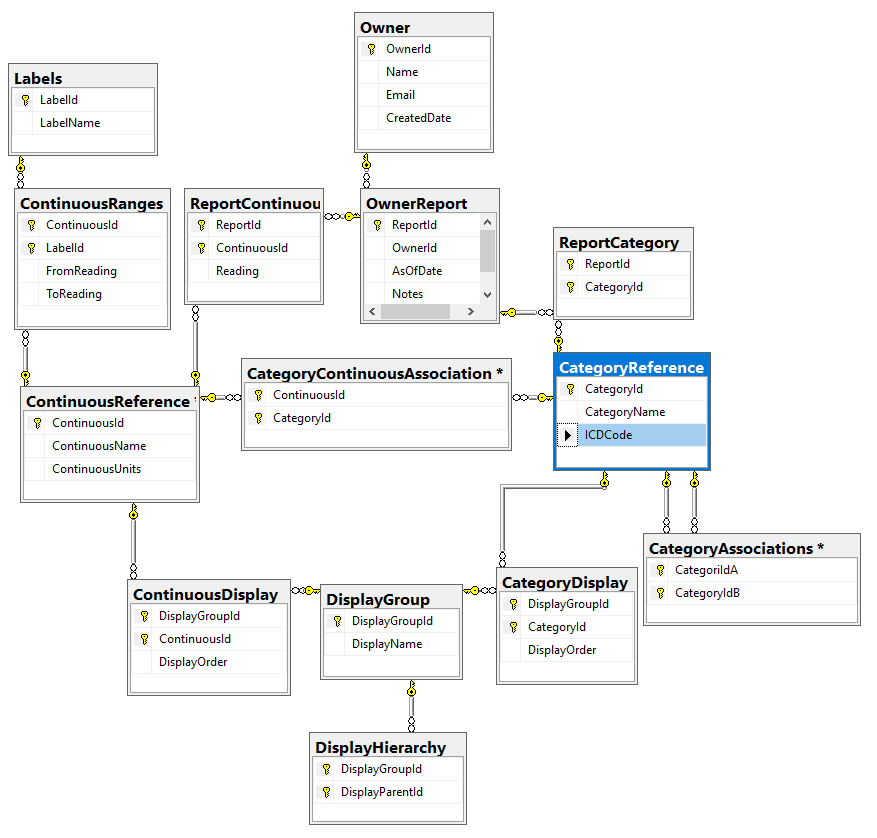
We are also going to add two more reference types which are up the user to define. There is no reference sources for these like we have for ICD and NCBI.
At the data modelling level these reference types are:
- Categoric, effectively Yes or No
- Do I have this ICD diagnosis?
- Do I have this symptoms?
- Am I a male or female?
- Continuous
- What is my C-Reactive Protein result?
- What level is my Vitamin 1,25 D
- How old am I
I call these items: Continuous Factors and Category Factors. For processing simplicity, instead of giving a choice for eye color of {Brown, Hazel, Blue, Green, Gray, Amber etc) – each is an independent choice (in the database). You could group them in the DisplayGroup as ‘Eye color’ and in the user interface allow only one to be chosen (although some people do have different color eyes!)
You will note that ICDCode is an optional column Category because I expect most sites will only use a subset of them. Having an Id (Integer) makes processing a lot easier for some non-parametric techniques.
Also note that we have Associations, for example, you may to wish to associate certain symptoms with IBS or IL-10 levels with Chronic Fatigue Syndrome. Thus if someone selects IBS, you may wish to present a short list of appropriate symptoms to select from (more on that in a later post – I did a patent filing on that approach years ago).
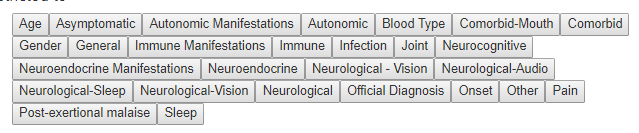
For the above tables we may wish to classify or group items for the sake of display. With this number of reports (from C-Reactive Protein to Brain Fog to DNA mutations) organizing the presentation on a web site can be a challenge.
On my current implementation, you will see that I have broken things into two large groups:
- Symptoms
- uBiome metabolism numbers
For symptoms, I ended up adding an additional layer as shown below. There can be poor UI designs – for example, hitting a person with 300 sequential questions often we result in the questions being only partially completed.
For common lab tests, I would suggest using Lab Tests Online as a starting point — remember each laboratory uses slightly different processes and have different reference ranges.
Continuous ranges also have ranges of values (with labels, for example on age: Infant 0-2, Toddler 2-5, Child 5-10, PreTeen 11-12 etc; or for other items: High, Normal, Low). The ranges help with interpretation and may often be used for the first cut with non-parametric techniques.
For symptoms, I strongly suggest for any ICD diagnosis, you search the web for symptoms often seen with each condition.
Bottom Line
Unlike prior tables where we can populate from prepared sources, we have to research, select and populate the table by hand. This can be a time consuming process to do right. Similarly, getting the user interface right is also time consuming.
Recent Comments