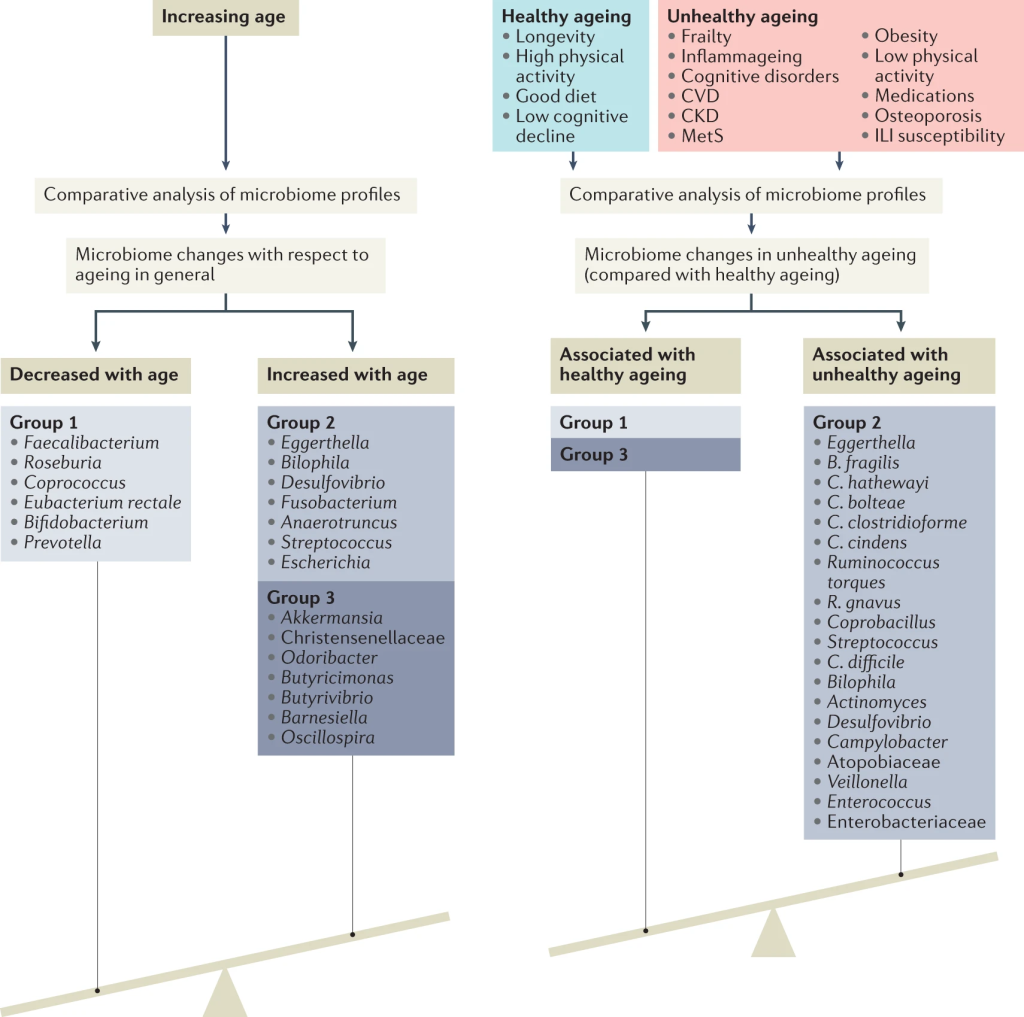
“The identified microbiome pattern of healthy ageing is characterized by a depletion of core genera found across most humans, primarily Bacteroides. Retaining a high Bacteroides dominance into older age, or having a low gut microbiome uniqueness measure, predicts decreased survival in a 4-year follow-up.” Gut microbiome pattern reflects healthy ageing and predicts survival in humans[2021]
While we have over 4000 samples, most of the samples are from people dealing with health issues. The average number of matches for each age group (when given) is shown below. If your own values is significantly above the number under Matches, you should have some concerns. We do see the number increases around 70.
Lab
Age Range
Matches
OmbreLab
Age: 30-40
5.1
OmbreLab
Age: 40-50
4.8
OmbreLab
Age: 50-60
4.7
OmbreLab
Age: 60-70
5.2
OmbreLab
Age: 70-80
6.7
BiomeSight
Age: 30-40
4.8
BiomeSight
Age: 40-50
4.5
BiomeSight
Age: 50-60
4.6
BiomeSight
Age: 60-70
4.2
BiomeSight
Age: 70-80
3.9
BiomeSight
Age: 80-90
7
I am 70, and decided to look at the last few years of samples. I noticed a blimp with a relapse of ME/CFS which slowly declined with remission.
Sample Date
Matches
Comment
October 20, 2019
5
December 6, 2019
7
ME/CFS Relapse
December 13, 2019
7
February 23, 2020
5
October 29, 2020
6
July 27, 2021
6
September 9, 2021
4
January 24, 2022
4
May 23, 2022
4
September 18, 2022
5
December 1, 2022
5
Using OmbreLab tests
Using BiomeSight processing (which allows my earlier ubiome data to be added). We see the unhealthy spike with ME/CFS
Sample Date
Matches
November 6, 2017
3
March 16, 2018
5
Work Stress
March 19, 2019
7
ME/CFS Flare
April 9, 2019
7
February 23, 2020
5
November 17, 2020
4
September 9, 2021
6
January 24, 2022
4
REMEMBER: Quality of processing of samples can vary greatly. The above should be taken with 0.1 grams of NaCl.
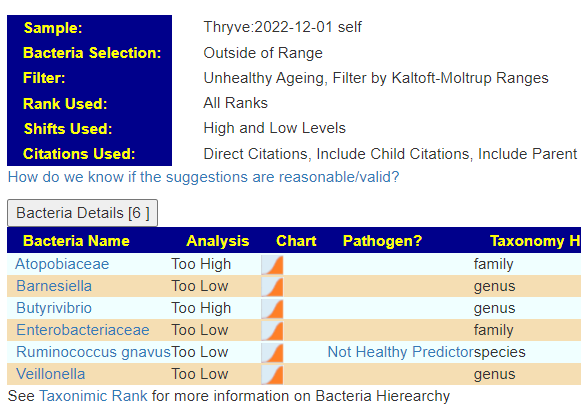
Example of Getting Suggestions
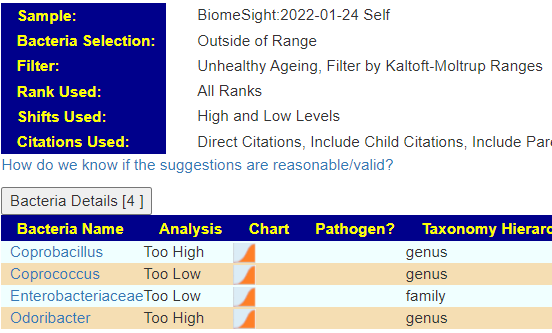
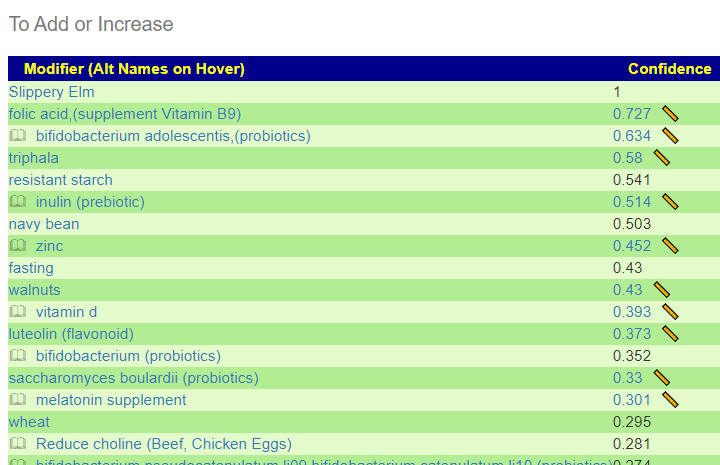
I used Microbiome Prescription site to identify these 4/5 and get suggestions. First, note that different labs detect things differently (See The taxonomy nightmare before Christmas…). The bacteria selections done below are based on the percentile ranking (> 75%ile or < 25%ile) of other lab results from the same lab.
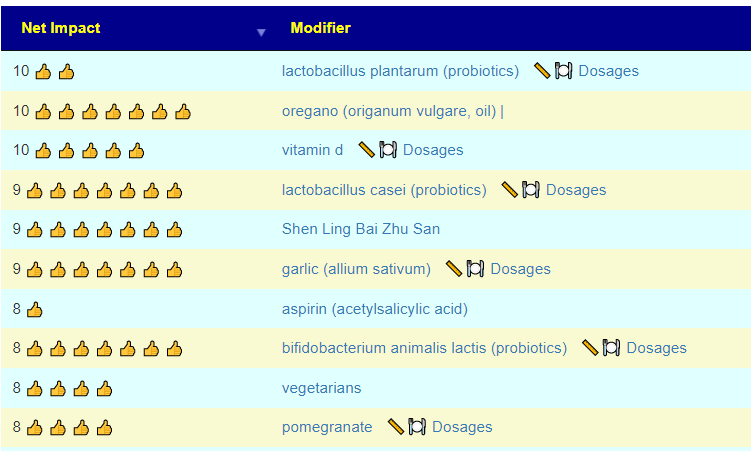
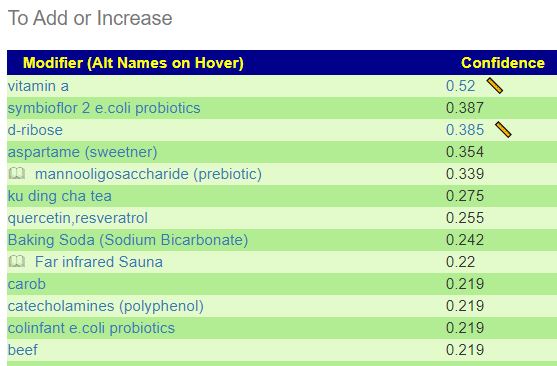
Top Suggestions
What we see is that 5+4 = 8 bacteria of concern — only Enterobacteriaceae was shared between labs.
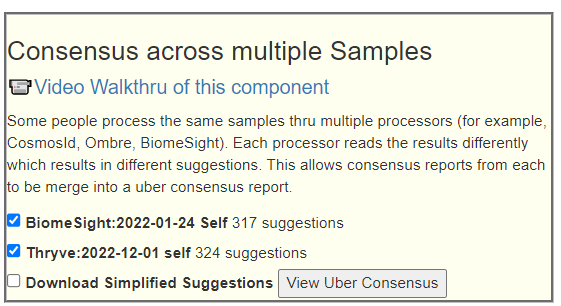
I then went over to Multiple Samples Tab and looked at the multiple sample Consensus
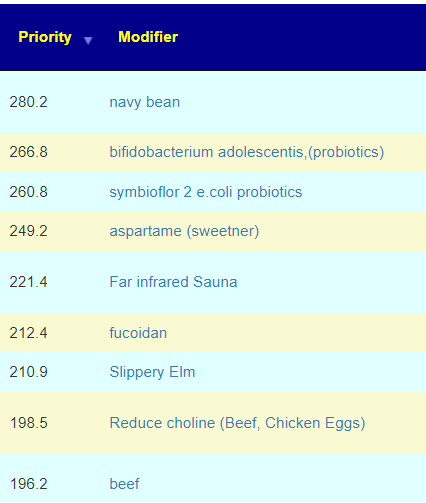
With the results shown below
The last two are interesting, with the consequence being a shift from chicken to using beef (and with likely smaller portions).
Bottom Line
As shown above, I would recommend getting your FASTQ files processed by both OmbreLab and BiomeSight … a continuing part of The taxonomy nightmare before Christmas… Then do both through this system and getting a Consensus report across samples.
The question of which bacteria may induce coagulation issues and micro clots with Myalgic encephalomyelitis/chronic fatigue syndrome and Long COVID has been an interest for many years (pre-COVID). This week I started digging (again) and this time we got sufficient information to do a sharing post.
Blood coagulation often accompanies bacterial infections and sepsis and is generally accepted as a consequence of immune responses. Though many bacterial species can directly activate individual coagulation factors, they have not been shown to directly initiate the coagulation cascade that precedes clot formation. Here we demonstrated, using microfluidics and surface patterning, that the spatial localization of bacteria substantially affects coagulation of human and mouse blood and plasma. Bacillus cereus and Bacillus anthracis, the anthrax-causing pathogen, directly initiated coagulation of blood in minutes when bacterial cells were clustered.
Paraprevotella had a positive correlation with fibrinogen
Succinatimonas had positive correlations with fibrinogen and homocysteine
Bacillus had positive correlations with fibrinogen and high-sensitivity C-reactive protein
Paraprevotella, Succinatimonas, and Bacillus were also associated with greater plaque volume
Helicobacter pylori, Chlamydia pneumoniae, Mycoplasma pneumoniae, Haemophilus influenzae, Streptococcus pneumoniae, Staphylococcus aureus, Streptococcus pyogenes, Pseudomonas aeruginosa, Klebsiella pneumoniae, Bartonella henselae and Escherichia coli, causing infections may increase the risk of thrombotic complications through platelet activation or may lead to an inflammatory reaction involving the fibrinolytic system. Acinetobacter, Burkholderia pseudomallei [2020]
“The found slight increases in FVIII:C and CRP levels might support the hypothesis that a vancomycin-induced gram-negative shift in the gut microbiome could induce increased systemic inflammation and thereby a procoagulant state.” [2021]
“significantly abundant genera were observed in the coronary thrombus in the patients: Escherichia, 1.25%; Parabacteroides, 0.25%; Christensenella, 0.0%; and Bacteroides, 7.48%. ” [2020]
The artificial intelligence producing these suggestions knows nothing about coagulation, it made these suggestions to solely reduce the bacteria identified above. Bacteria which may cause coagulation.
We would expect more matches for high bacteria levels (defined as > 75%ile) of the bacteria identified above with people with Long COVID and people with ME/CFS. This appears to be shown in the data. The reason that exogene has a very high number is that it reports on all of the candidate bacteria — which is not the case for 16s tests. Second, we see post-COVID people with full recovery having less matches then the combination of samples which includes those that provided no information (and which would likely contain some Long COVID and ME/CFS people)
Condition Reported
Lab
Reported
Not Reported
COVID
BiomeSight
2.44
2.23
Fully Recovered from COVID (No Long Covid)
BiomeSight
2.28
ME/CFS
es-xenogene
6
3.25
SequentiaBiotech
2.5
1.3
OmbreLabs
2.08
1.94
American Gut
5.74
3.10
BiomeSight
2.29
2.27
uBiome
1.54
1.51
Filtered to sufficient samples. Numbers above are based on the number of matches found
The list of bacteria above is known to be incomplete but the above results does suggest at least a partial identification of the bacteria responsible for coagulation and micro clots.
This is based on bacteria identified in Sleep and the Microbiome – Some Notes. Bacteria level shifts through the day and you do not want to feed the bacteria that are associated with sleep issues. This is theoretical lists that ignores the magnitude of shifts.
To Avoid Before Bed
arabinoxylan oligosaccharides (prebiotic)
bacillus subtilis (probiotics)
berberine
bifidobacterium longum (probiotics)
bile (acid/salts)
Burdock Root
Fisetin
ginger
glycine
inulin (prebiotic)
iron
lactobacillus casei (probiotics)
lactobacillus reuteri (probiotics)
lactobacillus rhamnosus gg (probiotics)
omega-3 fatty acids
saccharomyces boulardii (probiotics)
salt (sodium chloride)
Slippery Elm
sodium butyrate
vitamin d
walnuts
wheat
From Social MediaFrom Social Media
Fine to take
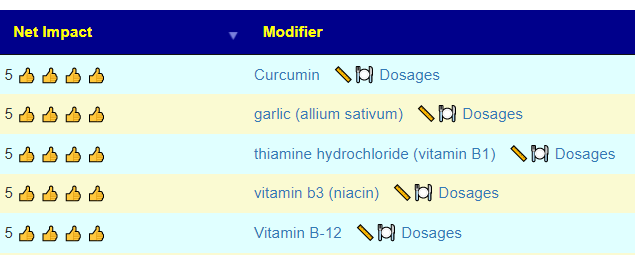
These items will have a reducing impact on at least one of the bacteria. Items in bold has the highest impact.
Arbutin (polyphenol)
bacillus amyloliquefaciens (probiotic)
bacillus coagulans (probiotics)
Baking Soda (Sodium Bicarbonate)
bentonite
Caffeine
camelina seed
cannabinoids
chitooligosaccharides (prebiotic)
diosmin,(polyphenol)
extra virgin olive oil
galacto-oligosaccharides (prebiotic)
Hesperidin (polyphenol)
l-glutamine
linseed(flaxseed)
luteolin (flavonoid)
melatonin supplement
N-Acetyl Cysteine (NAC),
pyridoxine hydrochloride (vitamin B6)
quercetin
resveratrol (grape seed/polyphenols/red wine)
sodium stearoyl lactylate
thiamine hydrochloride (vitamin B1)
Vitamin B-12
vitamin b3 (niacin)
vitamin b7 biotin (supplement) (vitamin B7)
Vitamin C (ascorbic acid)
xylan (prebiotic)
So we have melatonin supplement, camelina seed and a glass of red wine to take with some B-vitamins at bed time!
A special edition blog for the sleepless… Many studies are looking at the microbiome with co-morbid conditions — making conclusions difficult.
“Growing evidence suggests bi-directional links between gut microbiota and sleep quality as shared contributors to health.” [2023]
“Contrary to expectations, timed feeding rendered animals more sensitive to stress” [2023] — so eating by the clock and not the light impacts stress negatively.
“In older adults, shorter sleep duration is associated with an increase in pro-inflammatory bacteria whereas increasing sleep quality is positively associated with an increase of beneficial Verrucomicrobia and Lentisphaerae phyla.” [2022]
“several taxa (Lachnospiraceae, Corynebacterium, and Blautia) were negatively correlated with sleep measures” [2017]
“Blautiaand Eubacterium hallii were microbe markers in the sleep-disordered population” [2022]
“Relative abundances of Streptococcus salivarius and Veillonella were independent predictors of sleep disturbances in MHE patients” [2022]
“class Mollicutes in subjects with poor sleep quality were lower than in the healthy individuals. [2022]
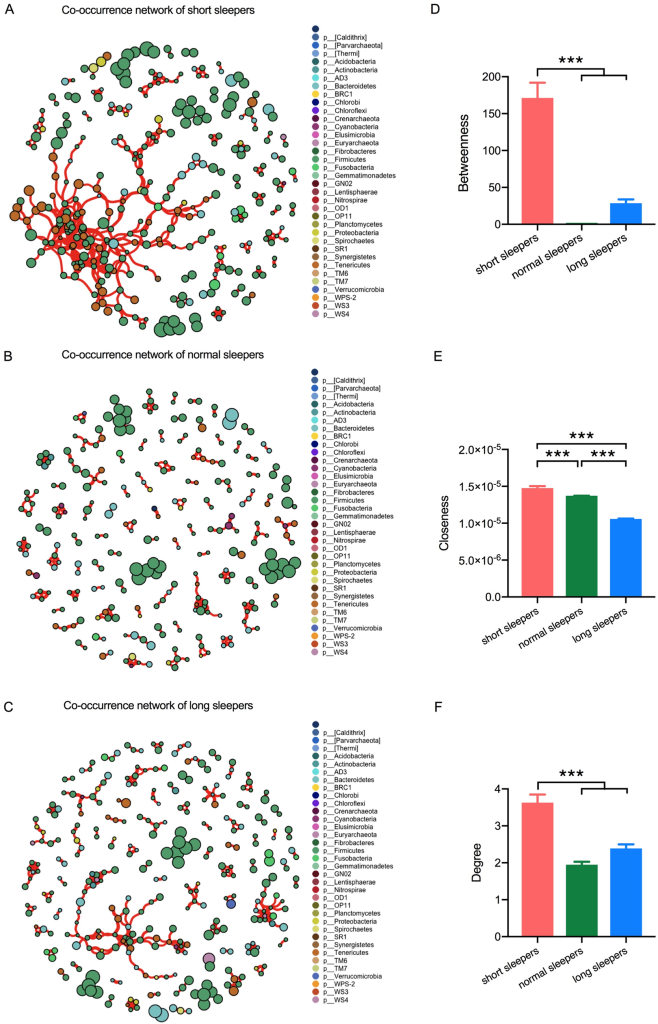
“The relative abundance of Sutterella was significantly lower (0.38% vs. 1.25%) and that of Pseudomonas was significantly higher (0.14% vs. 0.08%) in short sleepers than in normal sleepers” [2021]
“men with poor sleep (PSQI >5) tended to have lower alpha-diversity compared to men with normal sleep (Faith’s PD, beta= -0.15; 95% CI:-0.30-0.01, p=0.06). Sleep regularity was significantly associated with robust Aitchison distances (RPCA) and (phylogenetic-RPCA) PRPCA, even after adjusting for site, batch, age, ethnicity, body mass index, diabetes, antidepressant and sleep medication use, and health behaviors”
the top 5 positively associated with sleep regularity were Faecalibacterium prausnitzii G, OEMS01 sp0900199405, Oscillibacter valericigenes, Faecalibacterium prausnitzii A, and Faecalibacterium prausnitzii C.
[Poorer sleep] associated with Ruthenibacterium lactatiformans, Bacteroides uniformis, Alistipes putredinis, and Escherichia dysenteriae
My personal experience is that for most probiotics, taking just before bedtime helps with sleep. I say most — because a few of them will actually cause issues with falling a sleep. If you have single strains probiotics, you may wish to experiment with the impact of individual strains. Take one strain consistently at bed time, with a significant dosage, for a few days to see the impact (if any). One’s that cause wakefulness, may be ones you should take in the morning.
hello I do not want to bother, I have a question in the laboratories of my country, in the microbiota tests they put veillonella as virulent, but in a recent publication of microbiome prescription I saw that it could be a solution, why do the laboratories attribute virulence to it?
My Answer
That is equivalent to saying “Italians are criminals”. Why would someone say that? “Some Italians belong to the Mafia”
Veillonella is a genus of gram-negative, anaerobic bacteria that are commonly found in the human oral cavity, gastrointestinal tract, and respiratory tract. While some strains of Veillonella can cause infections, particularly in individuals with compromised immune systems, the majority of strains are considered to be non-virulent or opportunistic pathogens. Some studies have suggested that Veillonella may play a role in certain disease states, such as periodontal disease, but more research is needed to fully understand the potential pathogenic mechanisms of this genus.
From https://chat.openai.com/chat
For a lab to creditably state that, the lab would need to identify the specific strain. Veillonella is a genus, composed of many species, each species is composed of many strains. In terms of our Italian allergy, Italians come from many regions of Italy (species), within each regions are many families (strains). There may be some of these families that tend to being Mafia, others may tend to be priests (and eventually Popes).
Yin-Yang
My attitude is that Yin and yang is a better way of viewing bacteria. Bacteria are out of balance. Too many poor people results in high crime rates (out of desperation), Too many rich people results in low class mobility (the only people that get ahead are their friends, “old school ties”). The “right balance” for a well functioning society varies by country — for example, Iceland versus Haiti. Similarly, your DNA and diet influences what the right balance should be.
This family’s favorite and most effective probiotic is Mutaflor, an Escherichia coli probiotic. All E.Coli is not bad, trying to eliminate all E.Coli is likely a very dumb choice.
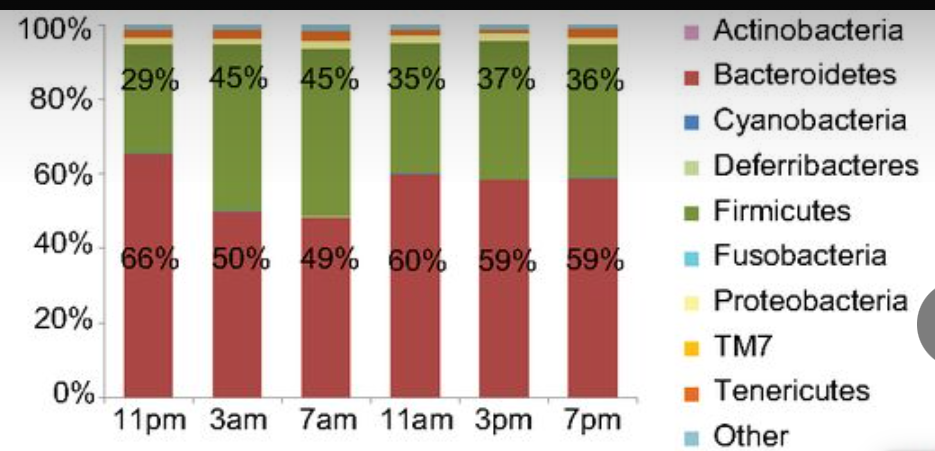
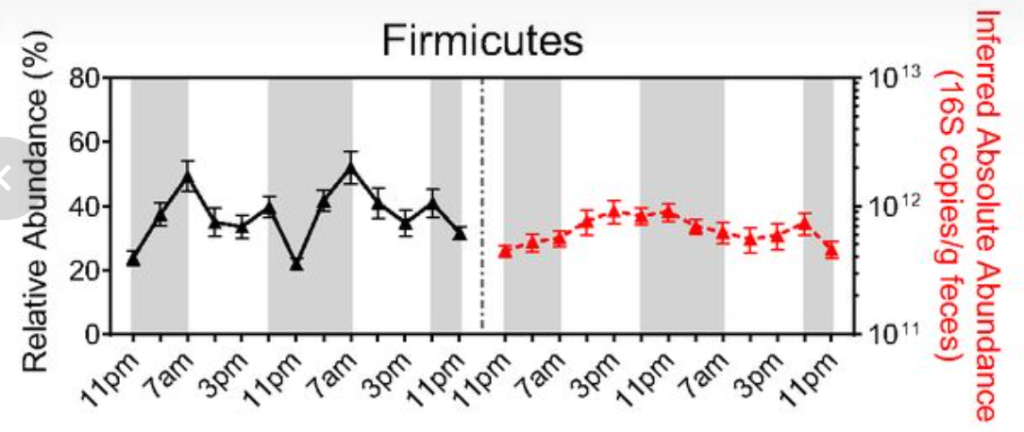
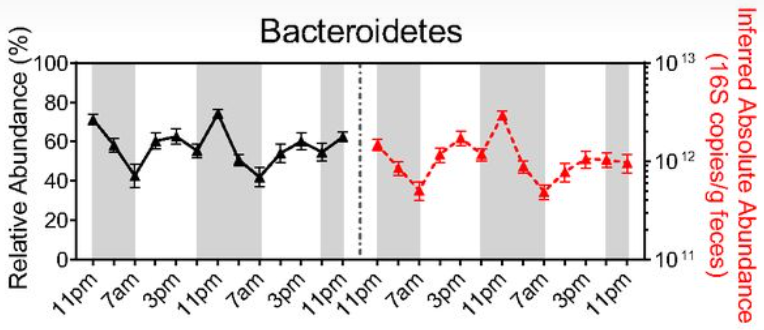
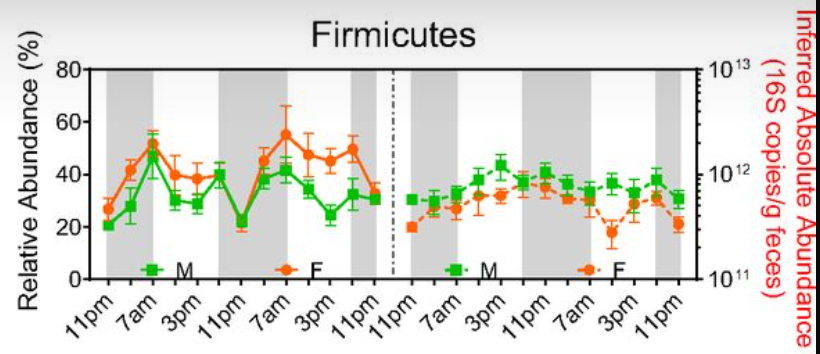
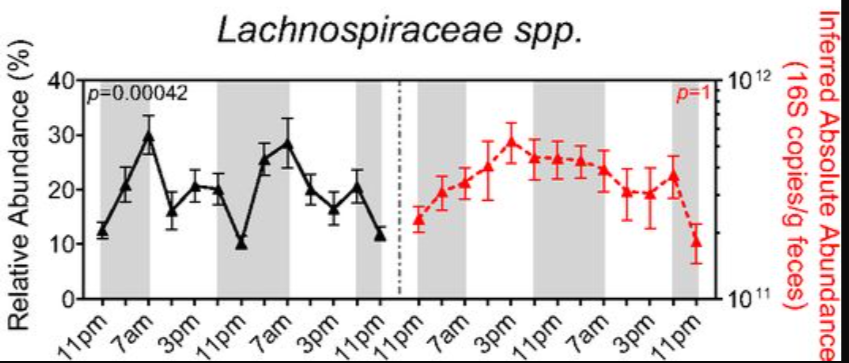
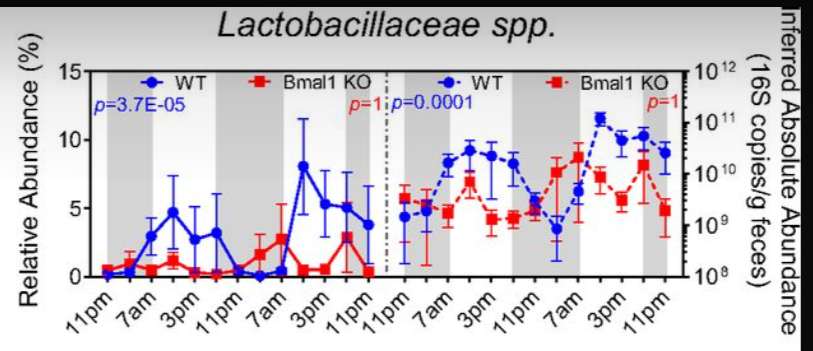
While working on a different blog post, I came across this study with a nice collection of charts to illustrate the importance of taking samples at the same time of day! It also makes implication that microbiome testing firms should be asking for the time of day that samples was taken (and provide gender, age and time of sample reference ranges — if they want to be creditable)
I have often compared the microbiome to a city. If you do a opinion survey, when in the city you take the survey and the time of day has a huge impact. Taking it at 7am in the morning, you will be bias for office workers. At 2pm, likely female shoppers. At 4am likely make shift workers.
This study demonstrates that a 14 days supplementation of ImmunoSEB + ProbioSEB CSC3 resolves post-COVID-19 fatigue. The proposed supplement regimen significantly reduces the burden of both, physical and mental fatigue and is effective as an early intervention in the recovery of COVID-19 patients, many of whom continue to experience severe fatigue including muscle weakness and “brain fog” several months after initial infection.
The substances used are very familiar to readers of my CFS Remission blog. They are:
Bacillus coagulans LBSC (DSM 17654)
Bacillus subtilis PLSSC (ATCC SD 7280)
Bacillus clausii 088AE (MCC 0538)
Serratiopeptidase,
Bromelain,
Amylase,
Lysozyme,
Peptidase,
Catalase,
Papain,
Glucoamylase
Lactoferrin
Some quick notes with citations for new readers:
“Serratiopeptidase is a proteolytic enzyme that has been used for reducing inflammation, it has antiedemic, analgesic, fibrinolytic and caesinolytic properties.” [2016]
Bromelain influences blood coagulation by increasing the serum fibrinolytic ability and by inhibiting the synthesis of fibrin, a protein involved in blood clotting [2012]
My personal experience with the Hemex approach is good and put me into remission in 2000. Objective measurements showed coagulation in some parts of the coagulation cascade with piracetam and heparin being my favorite cocktail (both taken sublingual).
The study ended at two weeks with no ongoing tracking of patients. My observations of ME/CFS people over several decades has been that short term remission is common with a slow regression back to fatigue. An excellent examples are ME/CFS in Australia doing Fecal Matter Transplants with remission within 48 hours and relapse in 4-8 weeks. Just as some bacteria (bacillus cited above) reduces coagulation, other bacteria triggers coagulation. If those triggering bacteria are not adequately suppressed then the fatigue and brain fog will return over time. Think of a leaking dike, you bring in the pumps and remove the water behind the dike, 3 weeks later the water is back — you need to fix the leak in the dike also.
A reader pointed out that the product is available on Amazon for $40. So a cheap experiment to try! If you do try it– please add your experience as a comment on this post.
Today I ran some queries to see how many progressions between the conditions that I have could be inferred from the current data. The following were used:
The taxon must be exact matches (no parent of a taxa or taxa children)
We count the number of times that the taxa shifts are the same direction, or are different
Each condition must share at least 10 bacteria.
All of the data (with sources) can be foundherefor people to dig further into relationships.
The results are below for those with 65% the same or more. Some are very expected, some are not
Chronic Fatigue Syndrome with
ME/CFS with IBS
ME/CFS without IBS
ME/CFS with IBS vs ME/CFS without IBS DOES NOT SHOW UP because they only have 5 bacteria in common
Small Intestinal Bacterial Overgrowth (SIBO) was not expected with
Colorectal Cancer
Rheumatoid Arthritis (RA),Spondyloarthritis (SpA)
Parkinson’s Disease
But expected with Irritable Bowel Syndrome
NOTE: Progression from one condition to another condition may be depend on DNA or epigenetics. If there is a high match up, it should be viewed as increased risk that may be mitigated with adjustments of the microbiome.
Condition Name
Condition Name
Same Direction Percentage
Different Direction Percentage
Alzheimer’s disease
Chronic Kidney Disease
86.7
13.3
ADHD
Chronic Kidney Disease
85.7
14.3
Chronic Fatigue Syndrome
ME/CFS with IBS
85.7
14.3
Chronic Urticaria (Hives)
Obesity
85.7
14.3
Chronic Fatigue Syndrome
ME/CFS without IBS
85.2
14.8
Chronic Urticaria (Hives)
obsessive-compulsive disorder
84.6
15.4
Chronic Urticaria (Hives)
Ulcerative colitis
83.3
16.7
Colorectal Cancer
Small Intestinal Bacterial Overgrowth (SIBO)
83.3
16.7
Histamine Issues,Mast Cell Issue, DAO Insufficiency
Ranges are created by labs to be able to give answers to people asking for them. The key word is created. They may have no actually be healthy ranges for your age, gender, diet style etc. Say again! Not actually healthy ranges for you.
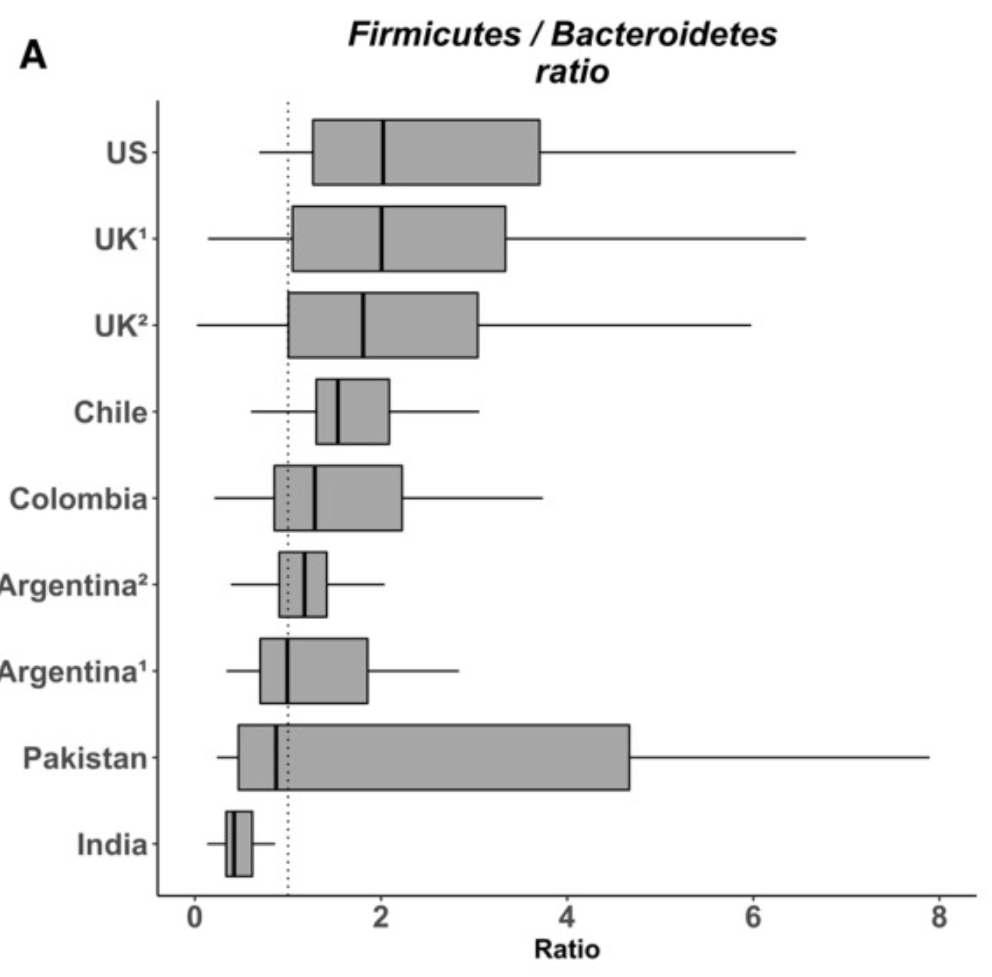
At the highest levels of the bacteria are phylums: (Firmicutes and Bacteroidetes). Almost every bacteria belongs to one of these two phylums. Almost every person in the US would be unhealthy by Indian Standards — well outside of the typical ranges. And almost every person in the India would be unhealthy by US Standards — well outside of the typical ranges. If you are of Indian descent living in the U.S. and eating a mixture of Indian and Western foods… any ideas of what you healthy range should be?
The classic approach in most labs for other tests (like Vitamin D, iron, etc) is to get a collection of apparently healthy individuals from physically around where the lab is and the assume that the data will be a bell curve/normal distribution. The people are typically self-declared to be healthy – for Americans, this will usually be high in people that have a high body-mass index [BI] (i.e. overweight). We know that a high BI causes changes in the microbiome…. From that data, compute the range — see typical instructions to labs here: Standard Lab Ranges (+/- 2 Standard Deviations). This assumption is never validated statistically on the data – lack of appropriate skills in the lab is a common cause. If you attempt to validate against almost any bacteria in the microbiome — it will fail, often extremely fail.
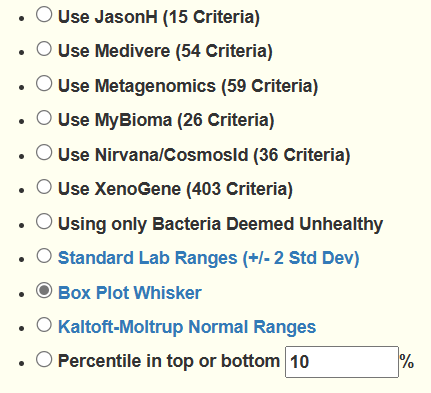
Research scientists knows that this is making a hugeassumption and will often in their research papers use a method called Box Plot Whisker. It is definitely better but typically require more samples to establish the ranges. A lab manager will opt not to do it when he may only need to do 30 samples to get the Standard Lab Ranges, and may need 150 samples to get a good Box Plot Whisker. Why should he want to increase costs when he can go cheap and claim that he is following standard processes.
Wait! There is More!
Suppose that you get 200 “healthy samples” — we can get the ranges using Box Plot Whisker and that’s it! We now know what healthy ranges are then!!!
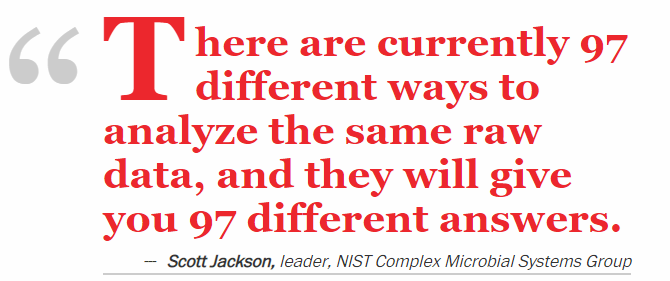
WRONG!!! VERY WRONG!!! The National Institute of Standards and Technology (the same people who define how long a foot is, or how many lumens a light bulb has) has made if very clear!!!!
If we have 200 samples, we will likely have 97 different ranges!!
From https://cfsremission.com/2019/12/22/the-taxonomy-nightmare-before-christmas/
Some of the ranges from different ways will be in significant contrast with each. To illustrate this, let us look at samples uploaded from OmbreLabs and Biomesight — they both use the same physical lab that has the same equipment — the difference is the software (“the ways”) that they use on the identically same data file!!!! We are NOT talking about two samples from the same stool; we are talking about one sample only
Lab
Bacteria/Taxa Types
BiomeSight
4193
OmbreLabs
6549
uBiome
2324
All consumes the same FASTQ raw data — the difference is the software they use
Looking at frequency of detection, we have some good matches at the genus level
Tax_Name
BiomeSight % Detected
OmbreLabs % Detected
BiomeSight Average %
OmbreLabs Average %
Vibrio
3.888
3.907
0.003
0.003
Nitrobacter
0.299
0.319
0.002
0.002
Prochlorococcus
0.179
0.159
0.003
0.003
Ruegeria
0.179
0.159
0.001
0.004
And some bad ones!
Tax_Name
BiomeSight % Detected
OmbreLabs % Detected
BiomeSight Average %
OmbreLabs Average %
Rhodothermus
90.371
1.914
0.275
0.039
Escherichia
80.742
5.183
0.536
0.058
Pedobacter
97.967
24.083
0.936
0.014
Alkaliphilus
97.189
28.628
0.348
0.011
Whose right? Both are right and both are wrong — there is no standard!!!! Right assumes a shared upon norm or consensus by people concerned.
What is my personal solution?
I am by academics and industrial experience, a statistician, operational research and Artificial Intelligence Software Engineer. The way to get the most probable solution from a difference of opinions, is to build a consensus model — take every ones suggestions and combined them!
At present I have good number of opinions that can be used, and if I get more expert opinions (and permission to use them) I will gladly add them.
I would love to see all of the labs make public the data they used to construct their ranges. Open data. I have discussed that with some of them and they deem it to be “proprietary” data. It is, in that the disclosure may reveal their mistakes and expose their ranges as questionable. Every one’s ranges are questionable (IMHO).
There is no right answer. There is no trustworthy range. A consensus answer is likely a good answer, the best that is available at the moment.
As an update, I’m nearly 5 weeks in and am beginning to feel better. My energy levels are perhaps the best they’ve been in the last 5 years. I’ve still got a very long way to go but the results thus far are promising!
I’m taking 5-7 foods/ supplements, 2-3X a day. And every 2 weeks I’m rotating all of it to prevent antibiotic resistance. In another month I plan to retest myself and make the necessary adjustments to my protocol.
I am a 39 year old male from the US whose symptoms appeared at or around the time of puberty. My case is not particularly severe – in fact it took me until the age of 23 to acknowledge to myself that I had a problem. While I fit the diagnostic criteria for ME/CFS, I specifically suffer from brain fog, low mental and physical energy, food sensitivities, 3 trips to the bathroom each morning, mild joint pain, and unrefreshing sleep. My symptoms have gradually worsened as I’ve aged. Certain vitamins, herbs, and foods have helped me to feel better but these solutions do not last more than a few days max. Nobody else in my family shares my symptoms, and I’m told I didn’t take antibiotics as a child. My BMI is 22.
Proforma Review
Well you can see the process in this My gut has gone to Firmicutes! post, I thought that I should do a step by step walk thru of the process that I use.
After logging in, I go to [My Profile] and then on the [Overview] panel, click Health Analysis.
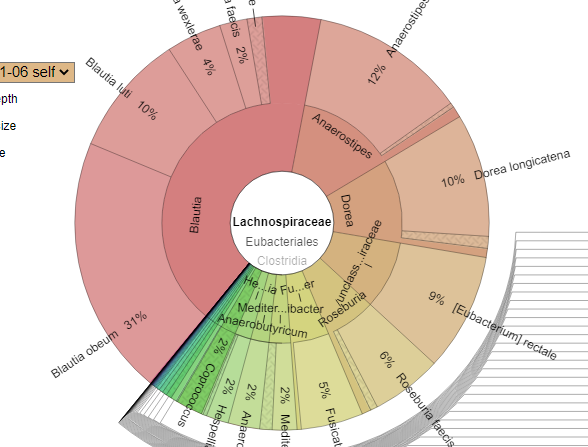
Similarly, [Bacteria deemed Unhealthy] had no red flags but does have a few bacteria that are not healthy predictors (Eggerthella lenta, Blautia producta, [Clostridium] symbiosum) and Collinsella (90%ile) which is viewed as proinflammatory – not unexpected with ME/CFS. Dr. Jason Hawrelak Recommendations came in at 98.8 percentile, so generally healthy. Blautia is of interest, it is at 36% of the microbiome versus Dr. Harelak preferred 5-10% and one of the highest levels in over 3,000 samples. This seems to be a possible smoking gun. The person is at the 70%iles using PubMed studies for ME/CFS without IBS.
Using the Krona Chart panel we see that the dominant species is Blautia obeum (which lacks any clear condition associations).
The next step is to look under [Visualizations] – Microbiome Tree, to visually scan for unusual disturbances. What I usually look for on the first pass are HIGH Percentiles with a high % of the microbiome. ?BOOM we had some major ones. The 100%ile means that the value was higher than any of the 3000+ samples
At this point, we have a ton of items that are overgrowth. This is a very atypical sample with a bunch of unusually high shifts. So we will move on to getting suggestions.
Because of the extreme values, I am also doing Percentile in top or bottom 5% [28 taxa picked], For all four of these, I am restricting the suggestions to High Items. We need to reduce bacteria to make room!
The list was interesting — and also typical for ME/CFS patients:
There is one interesting diet to consider: Eating traditional Indian (based on chart above) – i.e. meatless high spice diet consisting of a lot of Dal and other foods from Taste of India or Kitchens Of India. Alternatively, spend 6 months at a traditional Ashram in India. This diet appears to result in the lowest Firmicutes/Bacteroidetes ratio.
Probiotics
While there were a few suggestions, the computed impact were relatively low compare to those with negative impact. I would skip probiotics.
Questions from Reader
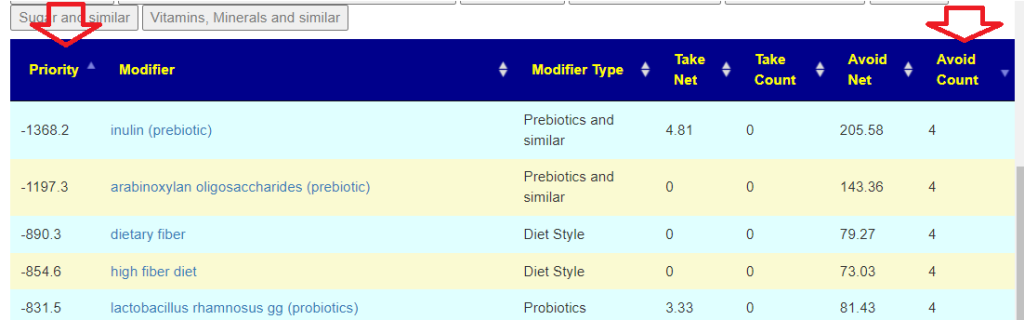
Q: Does the Consensus View only show me what to increase, or does it also show me what to avoid? A: Yes, Just click on the column titles to reverse the order. If you hold the shift key, you can do sorting by multiple columns.
Q: This may seem like a silly comment, but it’s difficult for me to envision a vitamin (such as B1) or a supplement (such as melatonin) significantly influencing the microbiome. I picture large foods filled with bacteria like sauerkraut, or sugary foods like cookies, as the items that would have the biggest impact. I clearly have a lot to learn.
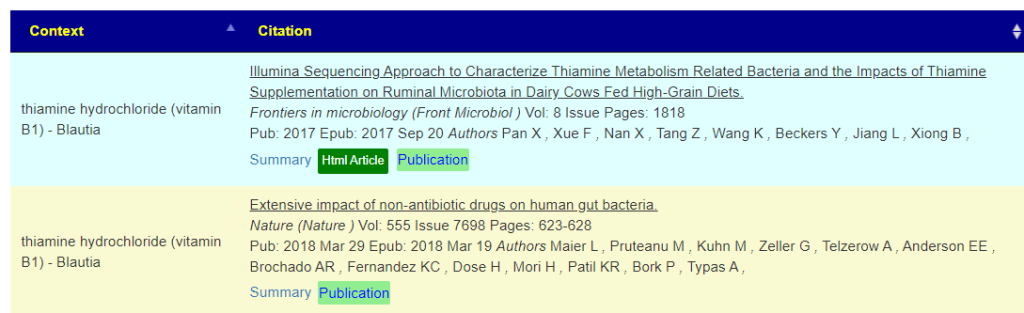
A: Bacteria feed on chemicals, including vitamins. If you click on the modifier name, i.e. thiamine hydrochloride (vitamin B1), AFTER setting display level to Intermediate, you will see a column called citations:
Clicking on Source Study will show where the data is coming from, with links to the studies.Some studies are on animals — but the bacteria is expected to respond in the same manner.
Remember: The site works off of actual peer-review studies only. Evidence, not speculation or wishful thinking.
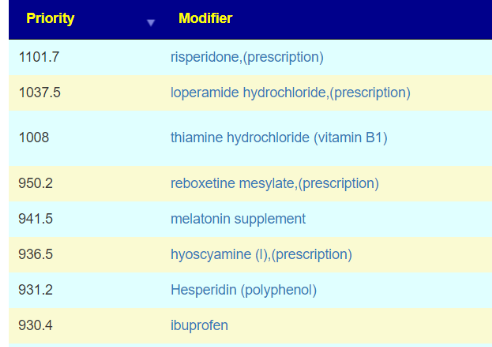
Q: When I adjust the recommendations to include prescription items, I get a whole bunch of prescriptions that show up. I’ll try to convince my doctor to prescribe! A: It is not worth the effort — because this is an off-label usage and there will be resistance. Especially since half of the top items in the list are not prescription and similar predicted impact. Hesperidin is in Lemons and Buchu, no prescription needed. Try the other items first, if the next test shows improvement (expected) and a prescription item jumps out far above the others — then it will be a good time to ask.
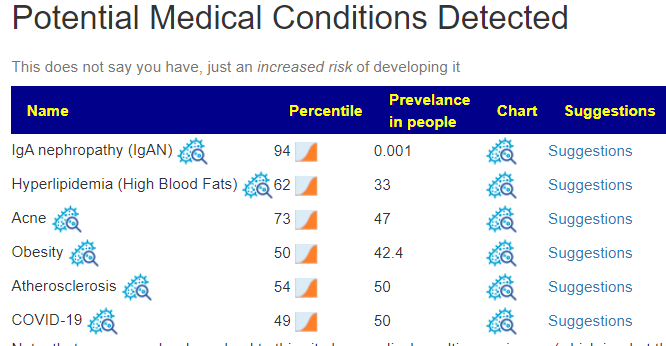
Q: Random question: The Probable Symptoms link under My Profile seems to be broken at the moment. This isn’t the same as the Potential Medical Conditions Detected under the Health Indicators, right? A: Correct, the probable symptoms is done by pattern matching. Your numbers are so different that the A.I. was unable to make a reasonable infererence.
Q: I’d think the microbiome would be a really accurate way to predict obesity, but under Potential Medical Conditions I was surprised to see i’m in the 100th percentile for Obesity. I weighed 120 pounds throughout high school and even now can’t break 150 lbs. I plan on getting updated samples every couple months, so i’ll be interested to see if my next sample shows something different here. A. Once we get things changing, we can use the National Library of Medicine Citations for Obesity to see how we want to target further shifts. We know what bacteria is associated with it, we just want to push the same bacteria in the opposite direct from that which was reported.
Course of Action
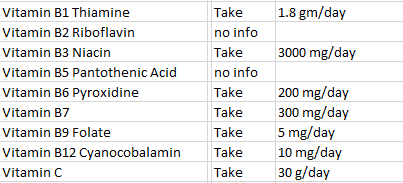
The first item of concern is simple: make sure that the dosages are adequate to effect changes. Taking a once-a-day supplements that has all of the vitamins listed above is unlikely to have any significant effect. Use the Dosages for Supplements to find the dosages. This can also be found by clicking on the Simplified Suggestions
Quick summary of dosages
After 4-8 weeks (depending on finances), repeat the microbiome test (using the same lab) and see what has changed. Recovery is like steering a sailing ship: it is a continuous set of course correction. Sometimes just a few to get to a safe harbor; other times, you may feel like you are circumnavigating the world.
Literature on ME/CFS and Firmicutes: I review studies on ME/CFS, Chronic Q-Fever, Lyme etc, and I do not find this pattern being cited. It is a very big ? BOOM pattern
Postscript – and Reminder
I am not a licensed medical professional and there are strict laws where I live about “appearing to practice medicine”. I am safe when it is “academic models” and I keep to the language of science, especially statistics. I am not safe when the explanations have possible overtones of advising a patient instead of presenting data to be evaluated by a medical professional before implementing.
I cannot tell people what they should take or not take. I can inform people items that appears to have better odds of improving their microbiome as a results on numeric calculations. I am a trained experienced statistician with appropriate degrees and professional memberships. All suggestions should be reviewed by your medical professional before starting.
I use modelling and various mathematical technique to estimate forecasts when there is no hard data available.
The information above should always be considered/discussed with your medical professional if possible.


Recent Comments