This is a continuation with real numbers of my 2019 post The taxonomy nightmare before Christmas….
See also: The taxonomy nightmare — Episode II
I have just updated the site using a refinement of the Kaltoft-Møldrup algorithm that became available to the site this weekend. Before getting into the nerdy details, let us recap the purpose.
In general, studies find associations between higher or lower levels of some bacteria to symptoms or conditions. These are primitive calculations with many deficiencies. In general, they do not establish causality, only association.
The common hypothesis is that being too high increases the risk. A common assumption for many medical conditions (when there is insufficient studies) is that the “top or bottom 5 percentage of patients” may be at risk. This can also be expressed as those in the bottom 5 percentile and top 5 percentile.
In many branches of physical science, this can be computed from the mean and standard deviation. This requires the data to be a normal distribution. This is not the case with microbiome data. Our purpose is to identify the values where we suspect that the risk has become significant.
The tables in this post illustrates the nightmare in my earlier post!
Scope of Investigations
I am going to the bacteria cited in Dr. Jason Hawrelak Recommendations to illustrate the issues. His levels came from published studies, observations and the test results of his patients (which could have been done using labs not covered in this post).
Whether his ranges applies to your sample depends on the lab that did the sample. In some cases, many of the labs have reasonable agreement. In other cases, major differences.
| Taxonomy | Rank | Low Percentage | High Percentage |
|---|---|---|---|
| Bacteroidia | class | 0 | 35 |
| Akkermansia | genus | 1 | 3 |
| Bacteroides | genus | 0 | 20 |
| Bifidobacterium | genus | 2.5 | 5 |
| Blautia | genus | 5 | 10 |
| Desulfovibrio | genus | 0 | 0.25 |
| Eubacterium | genus | 0 | 15 |
| Lactobacillus | genus | 0.01 | 1 |
| Methanobrevibacter | genus | 0.0001 | 0.02 |
| Roseburia | genus | 5 | 10 |
| Ruminococcus | genus | 0 | 15 |
| Proteobacteria | phylum | 0 | 4 |
| Bilophila wadsworthia | species | 0 | 0.25 |
| Escherichia coli | species | 0 | 0.01 |
| Faecalibacterium prausnitzii | species | 10 | 15 |
What are the numbers?
Unless %ile is after the number, the numbers are percentages reported.
- Lab Ranges use a computational method that is common with medical labs
- Lab Low means a value computed as Mean – 1.96 Standard Deviation. If the value is negative, it is set to zero because we cannot have a negative count.
- Lab High means a value computed as Mean + 1.96 Standard Deviation.
- KM is the Kaltoft-Moltrup algorithm that detects data that is akin or not akin to other numbers in the data set.
Bacteroidia 0 -35%
My impression is that this measurement does not matter. All of the ranges are much greater than Jason’s guidance.
Lab | KM Low | KM Percentile Low | KM High | KM Percentile High | Lab Low | Lab High | Mean | Standard Deviation |
|---|---|---|---|---|---|---|---|---|
| All | 25.7360 | 26 %ile | 89.6656 | 99 %ile | 0 | 82.6916 | 40.9174 | 21.3133 |
| BiomeSight | 23.9060 | 21.4 %ile | 81.0229 | 98.4 %ile | 2.8476 | 74.5331 | 38.6903 | 18.2871 |
| Ombre/Thryve | 4.0813 | 11.8 %ile | 100 | 100 %ile | 0 | 90.2312 | 41.8556 | 24.6814 |
| uBiome | 37.0967 | 25.8 %ile | 100 | 100 %ile | 9.6504 | 88.5812 | 49.1158 | 20.1354 |
Akkermansia 1-3%
The consensus pattern seem to be 0-10%.
| Lab | KM Low | KM Percentile Low | KM High | KM Percentile High | Lab Low | Lab High | Mean | Standard Deviation |
|---|---|---|---|---|---|---|---|---|
| All | 0.0030 | 8.5 %ile | 11.7689 | 97 %ile | 0 | 10.4247 | 1.7598.9 | 44208 |
| BiomeSight | 0.0020 | 10.6 %ile | 4.4380 | 92.6 %ile | 0 | 9.6732 | 1.4131.3 | 42143.2 |
| Ombre/Thryve | 0.0061 | 16.6 %ile | 10.8701 | 96.9 %ile | 0 | 10.4304 | 1.7167.3 | 44457.7 |
| uBiome | 0 | 0 %ile | 14.9127 | 95.9 %ile | 0 | 13.3284 | 3.2611.9 | 51363.5 |
Bacteroides 0 – 20%
Jason’s high level is below the average of every lab! The consensus for high level is around 50%
| Lab | KM Low | KM Percentile Low | KM High | KM Percentile High | Lab Low | Lab Hign | Mean | Standard Deviation |
|---|---|---|---|---|---|---|---|---|
| All | 8.1100 | 20.5 %ile | 58.9340 | 98.5 %ile | 0 | 51.5806 | 22.9882 | 14.5879 |
| BiomeSight | 9.8480 | 19.8 %ile | 58.5550 | 98.2 %ile | 0 | 52.2943 | 23.7279 | 14.5746 |
| Ombre/Thryve | 2.0953 | 16.7 %ile | 52.5618 | 96.8 %ile | 0 | 51.6341 | 21.3098 | 15.4715 |
| uBiome | 18.0540 | 26.8 %ile | 45.2831 | 95.4 %ile | 16466 | 49.4790 | 25.5627 | 12.2021 |
Bifidobacterium 2.5 to 5%
| Lab | KM Low | KM Percentile Low | KM High | KM Percentile High | Lab Low | Lab High | Mean | Standard Deviation |
|---|---|---|---|---|---|---|---|---|
| All | 0.0096 | 9 %ile | 8.4552 | 95.2 %ile | 0 | 13.0205 | 1.8287 | 5.7100 |
| BiomeSight | 0.0110 | 11 %ile | 7.2080 | 97.4 %ile | 0 | 7.2485 | 1.0863 | 3.1439 |
| Ombre/Thryve | 0.0053 | 7.5 %ile | 10.1484 | 93.6 %ile | 0 | 20.3438 | 3.0831 | 8.8064 |
| uBiome | 0 | 0 %ile | 7.2945 | 93.9 %ile | 0 | 12.8245 | 2.2096 | 5.4157 |
Blautia 5-10%
The consensus range appears to be 5-20%
| Lab | KM Low | KM Percentile Low | KM High | KM Percentile High | Lab Low | Lab High | Mean | Standard Deviation |
|---|---|---|---|---|---|---|---|---|
| All | 4.0480 | 19.4 %ile | 21.4510 | 95.9 %ile | 0 | 21.0998 | 8.8459 | 6.2519 |
| BiomeSight | 4.5750 | 18.7 %ile | 28.5110 | 98.2 %ile | 0 | 21.1671 | 9.1079 | 6.1526 |
| Ombre/Thryve | 2.9734 | 14.9 %ile | 23.2938 | 96 %ile | 0 | 22.2365 | 8.6022 | 6.9562 |
| uBiome | 6.6596 | 25.7 %ile | 19.0282 | 94.9 %ile | 0 | 20.1519 | 9.7336 | 5.3154 |
Desulfovibrio 0 – 0.25%
The consensus range appears to be 0- 1.5%
| Lab | KM Low | KM Percentile Low | KM High | KM Percentile High | Lab Low | Lab High | Mean | Standard Deviation |
|---|---|---|---|---|---|---|---|---|
| All | .0020 | 9.3 %ile | 1.9246 | 97.8 %ile | 0 | 1.5114 | 0.3311 | 0.6021 |
| BiomeSight | .0020 | 12.3 %ile | 1.5980 | 97.6 %ile | 0 | 1.1494 | 0.2244 | 0.4718 |
| Ombre/Thryve | .0024 | 6.8 %ile | 1.7445 | 96.9 %ile | 0 | 1.5812 | 0.4033 | 0.6009 |
| uBiome | 0 | 0 %ile | 2.1909 | 95.3 %ile | 0 | 2.2996 | 0.5799 | 0.8773 |
Eubacterium 0 – 15%
The consensus range appears to be 0 – 7%
| Lab | KM Low | KM Percentile Low | KM High | KM Percentile High | Lab Low | Lab High | Mean | Standard Deviation |
|---|---|---|---|---|---|---|---|---|
| All | 0.0060 | 9.9 %ile | 7.1513 | 95.1 %ile | 0 | 6.7982 | 1.4560 | 2.7256 |
| BiomeSight | 0.0040 | 10.5 %ile | 1.4510 | 96 %ile | 0 | 1.5494 | .2440 | 0.6660 |
| Ombre/Thryve | 1.1858 | 16.1 %ile | 11.7575 | 97.1 %ile | 0 | 11.0002 | 3.9347 | 3.6048 |
| uBiome | 0 | 0 %ile | 0.2976 | 94.1 %ile | 0 | 7.053 | 0.0844 | 0.3167 |
Lactobacillus 0.1 – 1%
The numbers are all over the place.
| Lab | KM Low | KM Percentile Low | KM High | KM Percentile High | Lab Low | Lab High | Mean | Standard Deviation |
|---|---|---|---|---|---|---|---|---|
| All | 0.0040 | 11.8 %ile | 1.2353 | 91.1 %ile | 0 | 7.0988 | .5206 | 3.3562 |
| BiomeSight | 0.0020 | 7.2 %ile | 0.1719 | 93.3 %ile | 0 | 5.6439 | .1551 | 2.8004 |
| Ombre/Thryve | 0.0129 | 14.9 %ile | 5.2409 | 97.2 %ile | 0 | 3.9082 | .8646 | 1.5528 |
| uBiome | 0 | 0 %ile | 0.3850 | 88.6 %ile | 0 | 13.1376 | 1.0906 | 6.1463 |
Methanobrevibacter 0.0001 – 0.02%
| Lab | KM Low | KM Percentile Low | KM High | KM Percentile High | Lab Low | Lab High | Mean | Standard Deviation |
|---|---|---|---|---|---|---|---|---|
| All | 0.0040 | 17.6 %ile | 2.7228 | 96.7 %ile | 0 | 4.2485 | 0.4806 | 1.9223 |
| BiomeSight | 0 | 0 %ile | 0.4900 | 94.5 %ile | 0 | 1.1064 | 0.1451 | .4904 |
| Ombre/Thryve | 0.0021 | 16.5 %ile | 1.6667 | 95.2 %ile | 0 | 1.6743 | 0.3337 | .6839 |
| uBiome | 0 | 0 %ile | 100 | 100 %ile | 0 | 4.1132 | 1.1688 | 1.5022 |
Roseburia 5-10%
Consensus range seems to be 0 – 10%
| Lab | KM Low | KM Percentile Low | KM High | KM Percentile High | Lab Low | Lab High | Mean | Standard Deviation |
|---|---|---|---|---|---|---|---|---|
| All | 0.1415 | 10.8 %ile | 11.3278 | 95.5 %ile | 0 | 10.9642 | 3.3780 | 3.8705 |
| BiomeSight | 0.0650 | 6.7 %ile | 13.5910 | 97.5 %ile | 0 | 10.6002 | 3.1089 | 3.8220 |
| Ombre/Thryve | 0.1083 | 14.5 %ile | 11.1568 | 96.4 %ile | 0 | 9.6754 | 2.6043 | 3.6076 |
| uBiome | 2.3416 | 22.9 %ile | 13.2358 | 96.2 %ile | 0 | 13.1313 | 5.5699 | 3.8578 |
Ruminococcus 0 – 15%
Note that there was not sufficient samples to compute KM for ubiome. In this case, the consensus is in close agreement with Jason’s target.
| Lab | KM Low | KM Percentile Low | KM High | KM Percentile High | Lab Low | Lab High | Mean | Standard Deviation |
|---|---|---|---|---|---|---|---|---|
| All | 1.3430 | 18.9 %ile | 14.0820 | 95.3 %ile | 0 | 14.2090 | 5.0708 | 4.6623 |
| BiomeSight | 2.0310 | 13.4 %ile | 13.1570 | 92.4 %ile | 0 | 15.0357 | 5.9824 | 4.6190 |
| Ombre/Thryve | 0.1699 | 11.6 %ile | 14.1344 | 97.2 %ile | 0 | 12.2289 | 3.6302 | 4.3871 |
| uBiome | 15491 | 3.5828 | 2.5659 | .5188 |
Proteobacteria 0 – 4%
Consensus range appears to be 1-15%
| Lab | KM Low | KM Percentile Low | KM High | KM Percentile High | Lab Low | Lab High | Mean | Standard Deviation |
|---|---|---|---|---|---|---|---|---|
| All | 1.1678 | 19.2 %ile | 11.8997 | 93.6 %ile | 0 | 18.5949 | 4.9788 | 6.9470 |
| BiomeSight | 1.3090 | 11.5 %ile | 17.7560 | 97.4 %ile | 0 | 15.6688 | 5.1765 | 5.3532 |
| Ombre/Thryve | 0.3683 | 12.9 %ile | 9.1702 | 95.8 %ile | 0 | 17.2016 | 3.5651 | 6.9573 |
| uBiome | 0.9504 | 11.4 %ile | 15.9831 | 96.2 %ile | 0 | 14.3449 | 5.1377 | 4.6975 |
Bilophila wadsworthia 0 – 0.25%
Ombre had no distinguishable difference in being akin. The consensus range appears to be 0- 1%
| Lab | KM Low | KM Percentile Low | KM High | KM Percentile High | Lab Low | Lab High | Mean | Standard Deviation |
|---|---|---|---|---|---|---|---|---|
| All | 0.0080 | 10.3 %ile | 0.9600 | 93.9 %ile | 0 | 1.3219 | .3356 | .5032 |
| BiomeSight | 0.0040 | 7.5 %ile | 0.8750 | 93.2 %ile | 0 | 1.2979 | .3219 | .4979 |
| Ombre/Thryve | 0 | 0 %ile | 100 | 100 %ile | 0 | .9597 | .2778 | .3478.7 |
| uBiome | 0 | 0 %ile | 1.2214 | 94.6 %ile | 0 | 1.5297 | .4254 | .5634 |
Escherichia coli 0 – 0.01%
This is badly measured by 16s tests. Xenogene full sequencing averages almost 4%. The consensus range appears to be 0 – 0.4%
| Lab | KM Low | KM Percentile Low | KM High | KM Percentile High | Lab Low | Lab High | Mean | Standard Deviation |
|---|---|---|---|---|---|---|---|---|
| All | 0.0020 | 14.8 %ile | 0.3190 | 90.8 %ile | 0 | 0.16760 | 0.1377 | 0.7848 |
| BiomeSight | 0.0020 | 15.1 %ile | 0.4690 | 96 %ile | 0 | 0.5323 | 0.0703 | 0.2357 |
| Ombre/Thryve | 0 | 0 %ile | 100 | 100 %ile | 0 | 0.5519 | 0.0967 | 0.2322 |
| uBiome | 353 |
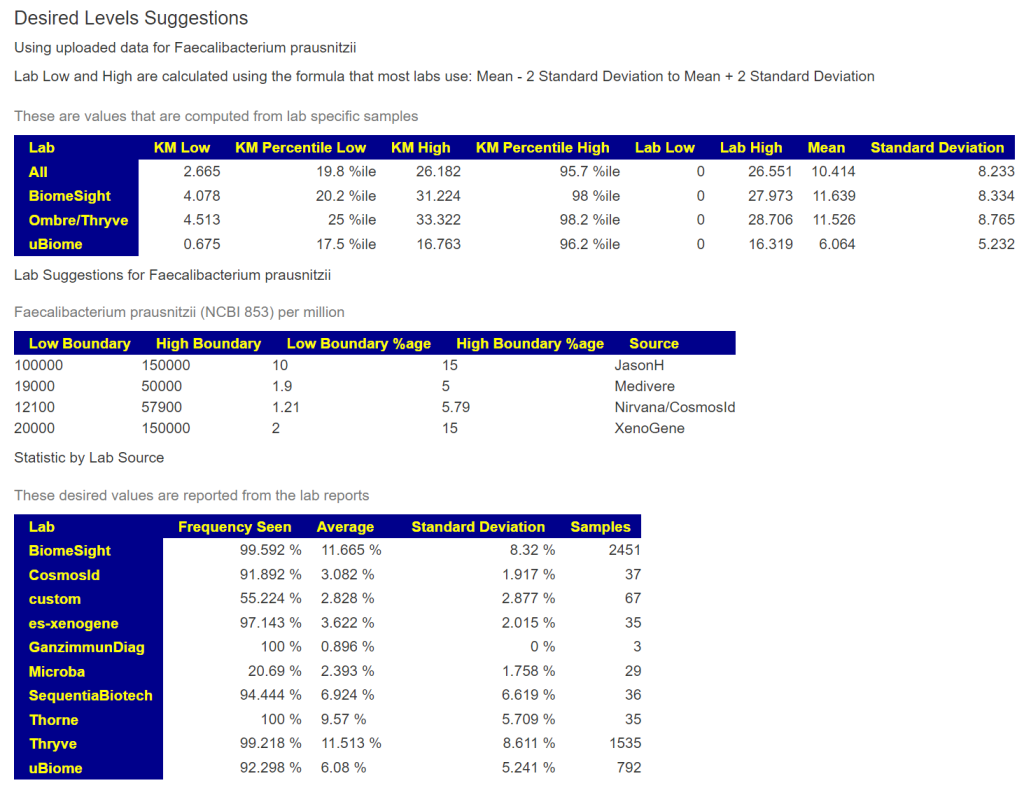
Faecalibacterium prausnitzii 10 – 15%
The consensus range appears to be 3 – 30%.
| Lab | KM Low | KM Percentile Low | KM High | KM Percentile High | Lab Low | Lab High | Mean | Standard Deviation |
|---|---|---|---|---|---|---|---|---|
| All | 2.6650 | 19.8 %ile | 26.1824 | 95.7 %ile | 0 | 26.5505 | 10.4139 | 8.2329 |
| BiomeSight | 4.0780 | 20.2 %ile | 31.2240 | 98 %ile | 0 | 27.9728 | 11.6385 | 8.3338 |
| Ombre/Thryve | 4.5133 | 25 %ile | 33.3225 | 98.2 %ile | 0 | 28.7057 | 11.5256 | 8.7653 |
| uBiome | 0.6753 | 17.5 %ile | 16.7634 | 96.2 %ile | 0 | 16.3190 | 6.0641 | 5.2320 |
Bottom Line
The purpose of this post is to demonstrate with actual sample numbers the issues raised in The taxonomy nightmare before Christmas….
To which we need to add:

You should ask for full disclosure from any source on how the ranges are calculated. Ignoring or dismissing the differences between different lab results suggests a low bandwidth understanding of the issues involved with the microbiome.
You can see the values when you look up bacteria as shown below
4 thoughts on “The taxonomy nightmare before Christmas… Episode III”
Comments are closed.