So doing a microbiome test is like collecting the DNA from a bunch of people at a major airport and then asking: Which country did this person originated from according to their DNA. You will find some people that are good matches to an ethnic origin and some people that are “Heinz 57” aka “Mutts”. These people are unclassified — just like some living components are unclassified.
Let us look at my own DNA to illustrate the issue better. The same DNA file was used for ALL of the following charts. Why do they not agree? Simple — thing are done by matching patterns. The reference library determines where matches are done. Every provider use difference reference libraries. There is no universal reference for Human DNA, nor for the microbiome.
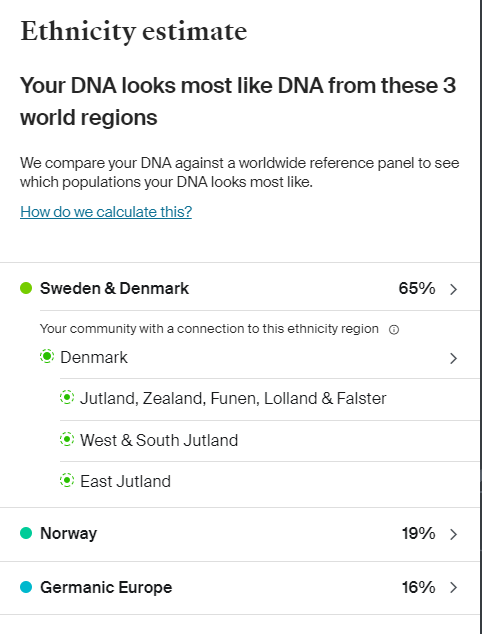
From 23 and Me
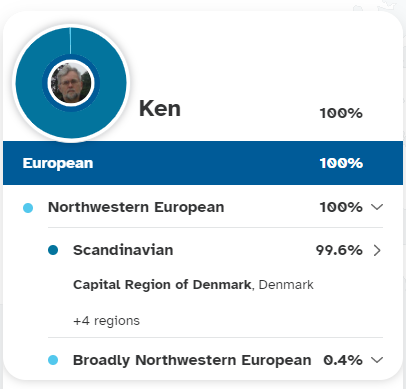
From Ancestry
and one more site, this one almost causes whip lapse!
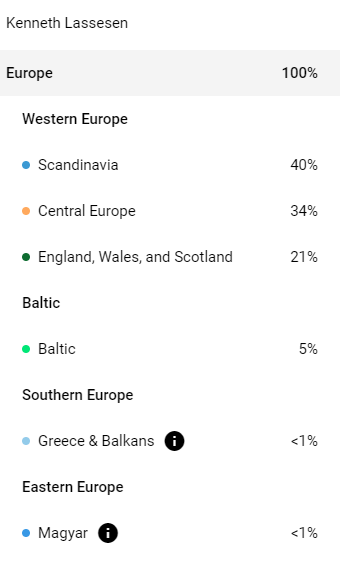
FamilyTreeDNA
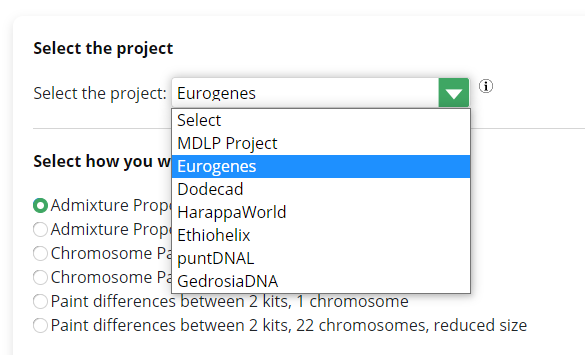
One site offers the choice of reference library to use and how to match
GEDMatch
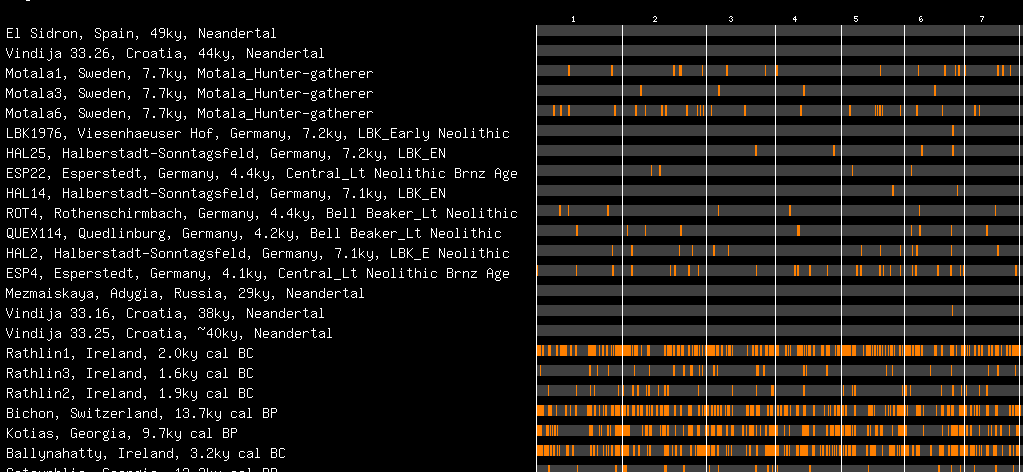
GEDMATCH show where your DNA matches historical samples
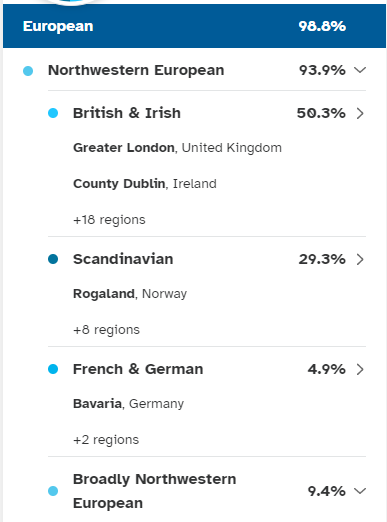
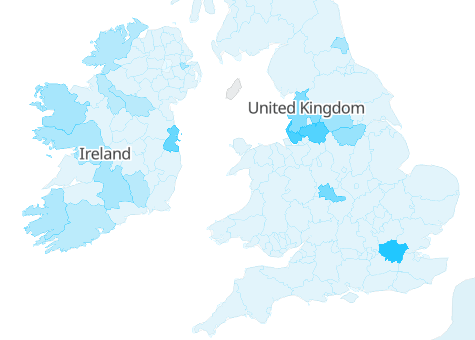
I look very Irish here
When we drill down to the next level, we see different “species names”
From 23 and meAncestry
Wait — we are talking about where
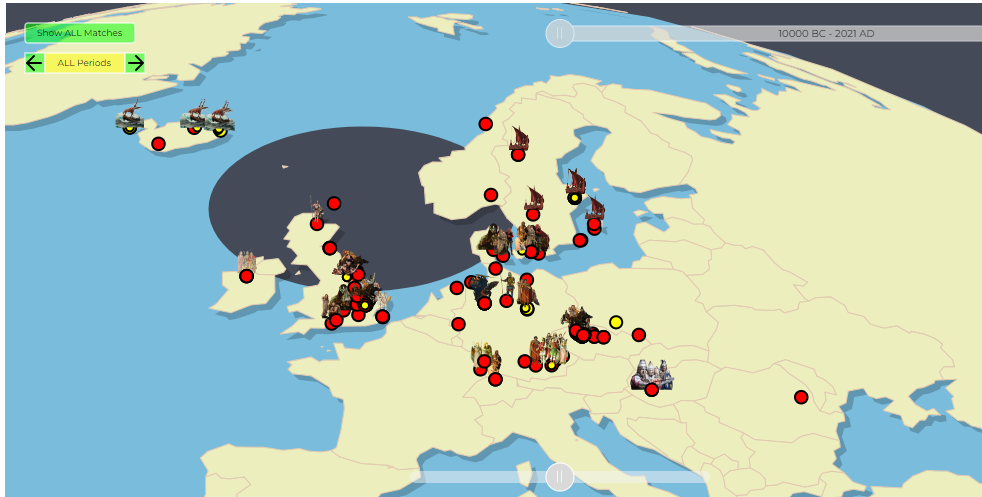
The above patterns are based on matching to current populations. We really would like older populations. There is a site that does that! My True Ancestry. The same DNA file suggests more UK or southern Germany. We could view this as an illustration between 16s and shotgun reports.
It is interesting to note that this seems closer to Family Tree DNA results shown above.
In some cases, it is not where the ancestors came from BUT where ancestor siblings settled, as in Iceland and the Shetland Island. The same can happen with bacteria identification. All that we know is that some components are shared.
Some people get concerned about finding unclassified stuff in their microbiome sample. This does not happen with some labs because they elected not to report what is not classified. Why? It leads to support calls asking for explanations (which means $$$$ spent for the company).
Labs could create synthetic proprietary names for the unclassified to make the issue disappear — that causes the issue to disappear but really does not help.
Bacteria is like the population of a country or the world. They interbred to some extent
Genetic exchanges among bacteria occur by several mechanisms. In transformation, the recipient bacterium takes up extracellular donor DNA. In transduction, donor DNA packaged in a bacteriophage infects the recipient bacterium. In conjugation, the donor bacterium transfers DNA to the recipient by mating.
So doing a microbiome test is like collecting the DNA from a bunch of people at a major airport and then asking: Which country did this person originated from according to their DNA. You will find some people that are good matches to an ethnic origin and some people that are “Heinz 57” aka “Mutts”. These people are unclassified — just like some living components are unclassified.
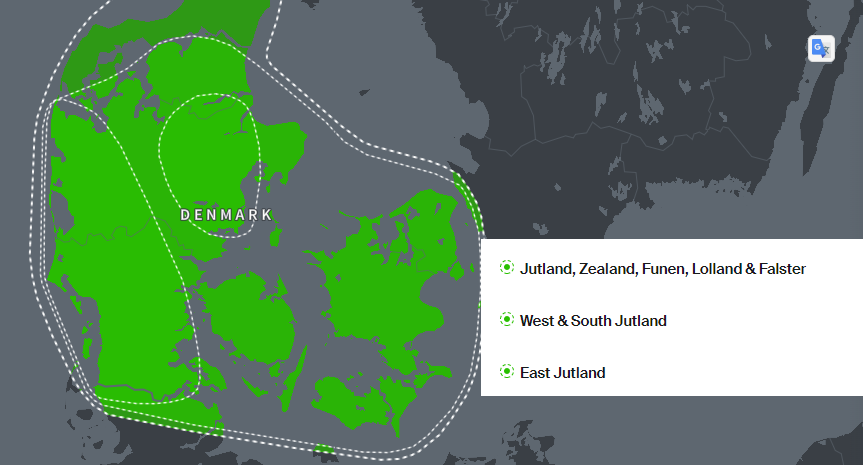
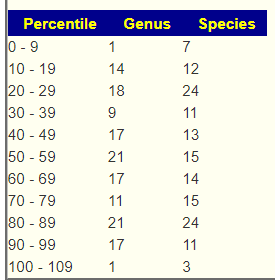
If I was picked, the answer is pretty clear for the “genus” that fits me
Which agrees with paper records back to 1500
If we want to get a more precise name, the “species”, then some fuzziness appears
There is a possible misidentification, my father’s ancestors (all lines) records go back to 1600 on an island that is low probability.
Lolland/Falster
The process of giving names to bacteria in the microbiome is extremely similar. For some bacteria (like me) we fit into a nice box. For the person below, the box is not so clear
Would this person be classified as Irish or English
Bottom Line
A wise man knows what he does not know, and what cannot be known.
COVID in February 2021. 37 y.o. Male at the time, athletic/fit. Crossfit x 3 a week, playing football weekly Only mild gastritis prior to Covid. No other health issues.
Moderate severity Covid, lots of symptoms.
And then Long COVID and CFS/ME type of symptoms mostly fatigue, PEM and GI problems (pain, food intolerance, bloating..etc) I’d say it’s a moderate/mild case of CFS/ME. But after 18 months still not back to previous levels, can’t walk too long otherwise i crash. I’d say i am around %75.
We have two samples available, one early in Long COVID and one more recent
2021-10-01
2022-08-17
With this type of information, let us start by comparing them. We are fortunate that both samples are similar read quality which reduces fuzziness. Unfortunately, it appears that the microbiome dysfunction has increased in many aspects. One aspect that it has improved in terms of bacteria with very low counts. We went from 74% of bacteria with low counts down to 51% with low count. Ideally we would love to see the low count to drop to a modelled 15%.
I should note that the increase in some Outside Ranges is likely because many of the ranges are 0 to some amount, hence the older sample had less because it was full of different trace amounts. The same apply to many other criteria, the low abundance of many bacteria skewed the criteria to appear better.
Criteria
Current Sample
Old Sample
Lab Read Quality
5.8
5.9
Bacteria Reported By Lab
393
399
Bacteria Over 99%ile
8
1
Bacteria Over 95%ile
26
21
Bacteria Over 90%ile
42
35
Bacteria Under 10%ile
135
160
Bacteria Under 5%ile
56
108
Bacteria Under 1%ile
9
29
Lab: BiomeSight
Rarely Seen 1%
1
0
Rarely Seen 5%
9
8
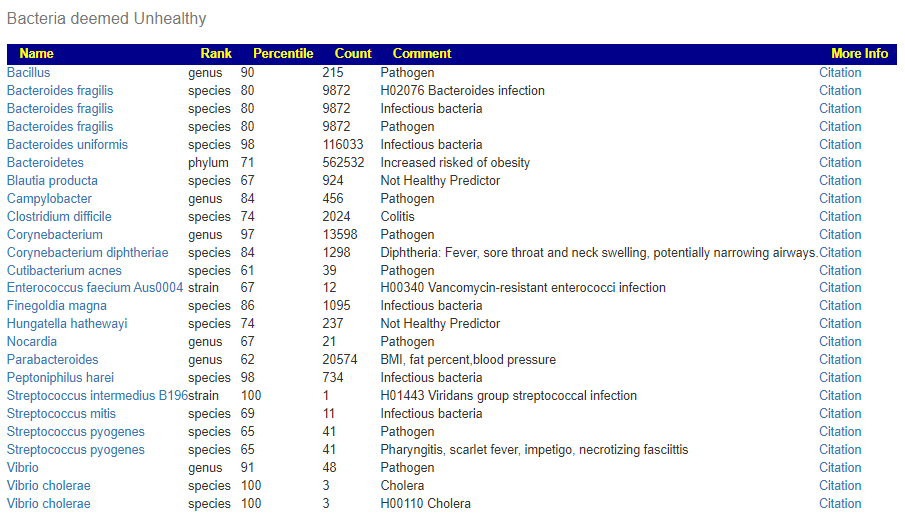
Pathogens
30
33
Outside Range from JasonH
10
10
Outside Range from Medivere
15
15
Outside Range from Metagenomics
10
10
Outside Range from MyBioma
8
8
Outside Range from Nirvana/CosmosId
22
22
Outside Range from XenoGene
34
34
Outside Lab Range (+/- 1.96SD)
16
8
Outside Box-Plot-Whiskers
49
43
Outside Kaltoft-Møldrup
147
108
Condition Est. Over 99%ile
18
0
Condition Est. Over 95%ile
38
0
Condition Est. Over 90%ile
50
0
Enzymes Over 99%ile
561
115
Enzymes Over 95%ile
793
282
Enzymes Over 90%ile
866
680
Enzymes Under 10%ile
289
294
Enzymes Under 5%ile
149
149
Enzymes Under 1%ile
29
23
Compounds Over 99%ile
480
50
Compounds Over 95%ile
600
214
Compounds Over 90%ile
677
298
Compounds Under 10%ile
581
315
Compounds Under 5%ile
563
242
Compounds Under 1%ile
548
91
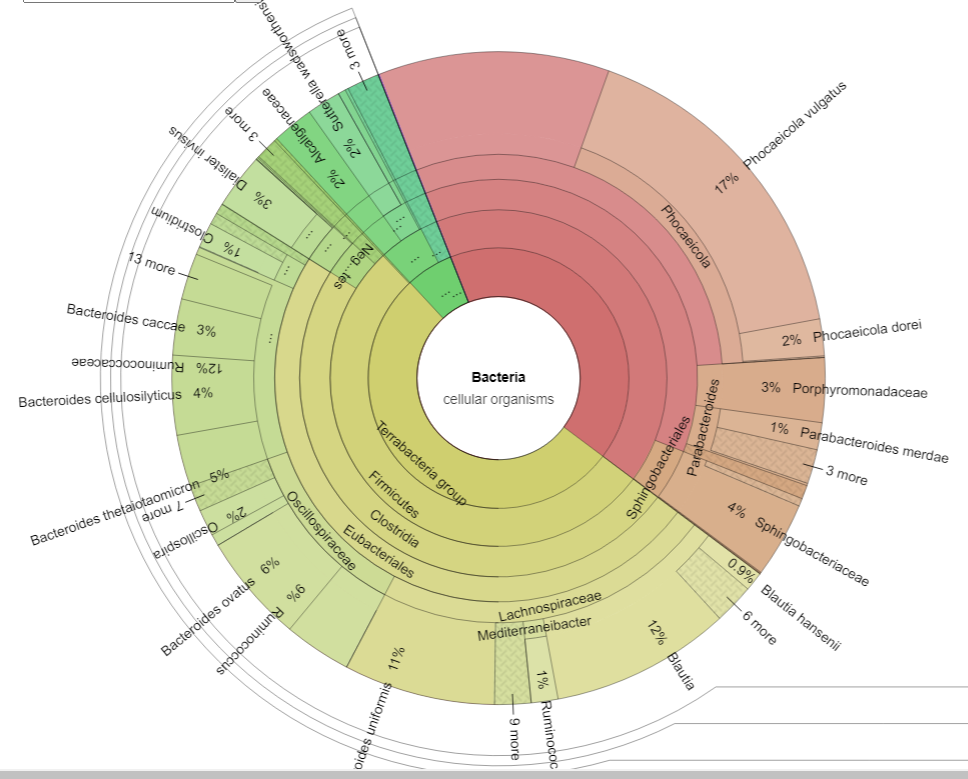
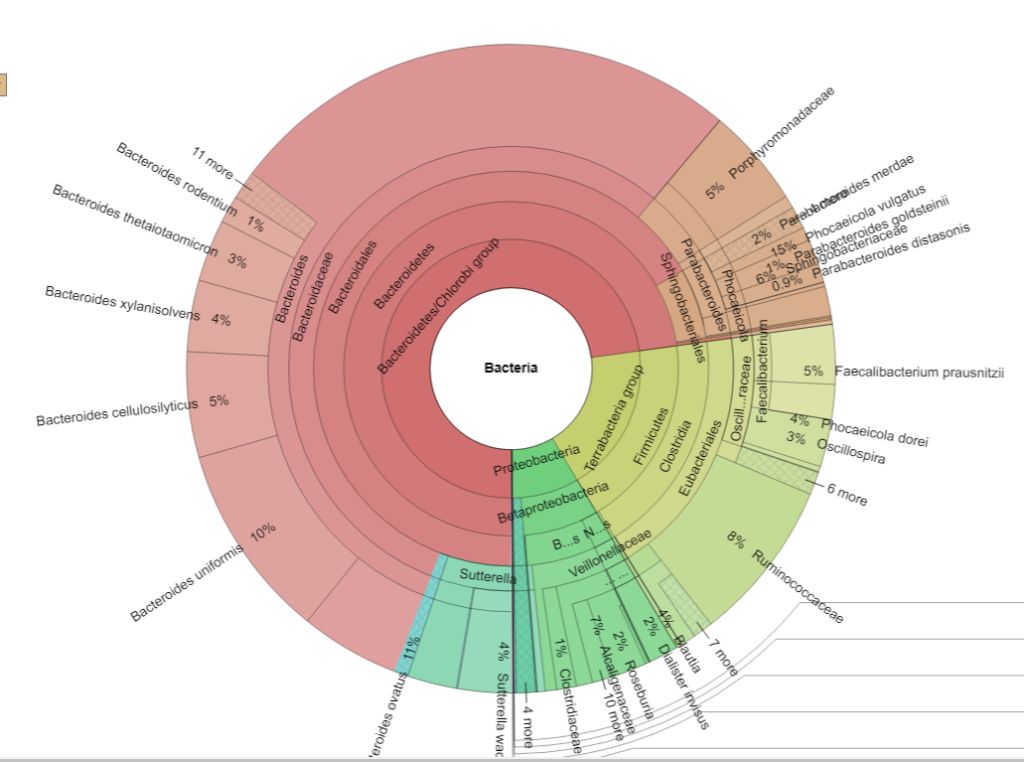
I next went to the Krona Charts to try to understand the shifts better. We see a massive increase of unclassified Bacteroides
2021-10-01 Sample2022-08-17 Sample
Going to sample comparison, we see that (genus) Bacteroides was at the 99%ile on both samples. Looking at members of this genus, we see several of the identified species at high levels
Then create a handpicked bacteria focused on Bacteroides and the high species under it. To express another way: Feed the weak and destitute, Bring down the mighty.
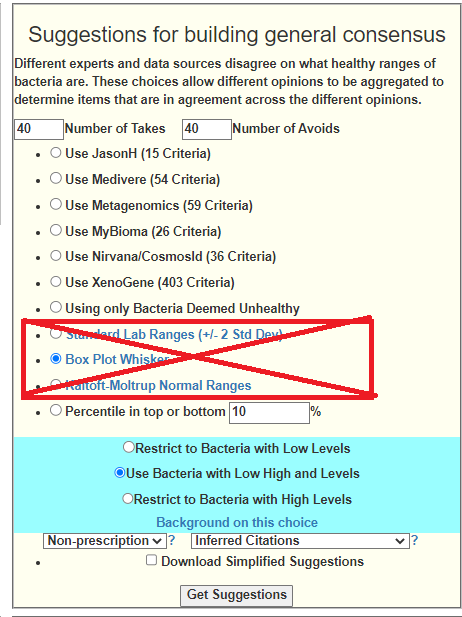
Doing the first step, we see at the top of the consensus:
The hand picked collection is below with percentiles
genus Bacteroides 99
species Bacteroides faecis 93
species Bacteroides graminisolvens 86
species Bacteroides ovatus 99
species Bacteroides rodentium 95
species Bacteroides stercorirosoris 91
species Bacteroides thetaiotaomicron 93
species Bacteroides uniformis 97
species Bacteroides xylanisolvens 100
The suggestions for just these are shown below. The pattern is similar to other peoples suggestions with ME/CFS – lots of specific B-Vitamins, dark chocolate etc:
whole-grain barley
sucralose
Caffeine
Hesperidin (polyphenol)
polymannuronic acid
momordia charantia(bitter melon, karela, balsam pear, or bitter gourd)
Bottom line for probiotics to try (add just one new one a week so you can see the response to each). See Simple Suggestions download below for suggested dosages or look them up on ??️ Dosages for Supplements. Using too small (almost homeopathic) dosages is a common error – the dosages on bottles are determined for profit margin (repeat business) and not from effective dosages from clinical studies.
I would suggest getting another sample 6 weeks after implementing the above to see what the progress is.
As always, review with your medical professional before implementing.
Bottom Line
This patient history and their microbiome are in agreement. The antibiotics suggestions (off label usage) matches the history.
Postscript – and Reminder
I am not a licensed medical professional and there are strict laws where I live about “appearing to practice medicine”. I am safe when it is “academic models” and I keep to the language of science, especially statistics. I am not safe when the explanations have possible overtones of advising a patient instead of presenting data to be evaluated by a medical professional before implementing.
I cannot tell people what they should take or not take. I can inform people items that have better odds of improving their microbiome as a results on numeric calculations. I am a trained experienced statistician with appropriate degrees and professional memberships. All suggestions should be reviewed by your medical professional before starting.
The answers above describe my logic and thinking and is not intended to give advice to this person or any one. Always review with your knowledgeable medical professional.
On Microbiome Prescription we have Look up a modifier of bacteria with many entries. It would be good for everyone if we increase the number of entries especially for atypical items.
YOU can help make it happen!
Find a herb, spice, food, drug of special interest to you
Look at the summary or the full study if available
The study should be on a human or an animal (there is not enough studies to be picky), skip fishes.
Look for bacteria names. We need to know the name and how they shift. i.e.
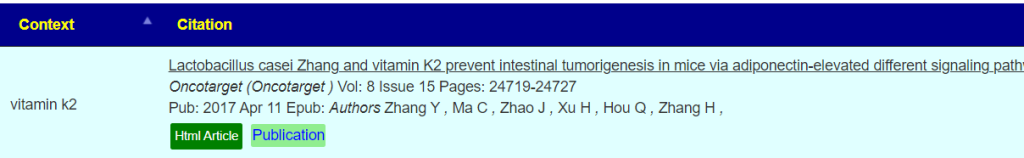
A Ruminococcus ASV, a Lachnospiraceae Anerostipes ASV, two Lachnospiraceae NK4A136 group ASVs, and a Muribaculaceae ASV were enriched in the vitamin K deficient group, whereas a Bacteroides ASV was enriched in the MK4 group, and a Lactobacillus ASV in the MK9 group.
Then comes the thinking part. Trying to describe the results.
Can you write a sentence such as “Vitamin K may increase Bacteroides and Lactobacillus and a reduce Ruminococcus, Anerostipes ,Muribaculaceae ”
If so, include that in the file sent. (I will verify and it will serve as a double check the reading)
If the study was done on a person (or mouse) with a specific condition, we still include it.
Sometimes you will find that a substance with a common name may have multiple breakdowns.
Ideally, find other names of the substance and search each one.
Sending the Information to Me
I would suggest putting the links (i.e. like https://pubmed.ncbi.nlm.nih.gov/36471554/ ) in a text file or excel and sending to me. Where practical, include a sentence on the impact.
The information sent (when added to database) is available to everyone! This is citizen science! As I remarked to someone earlier today “I do not have a business model, I have a pro bono model“.
I would suggest putting the links (i.e. like https://pubmed.ncbi.nlm.nih.gov/36471554/ ) in a text file or excel and sending to me.
The information sent (when added to database) is available to everyone! This is citizen science! As I remarked to someone earlier today “I do not have a business model, I have a pro bono model“.
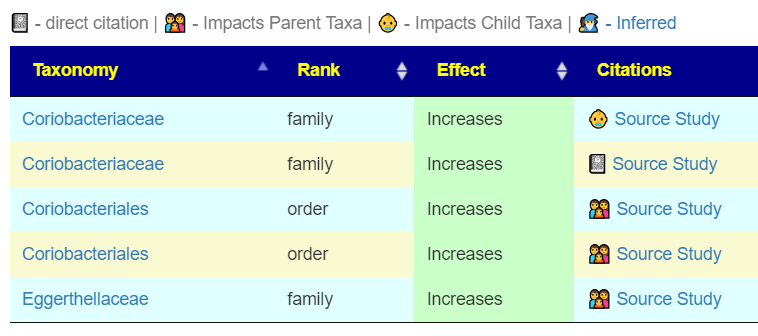
Clicking on the book stack will list the studies (and provide links!)
The encoded data can be used to evaluate yours and others microbiome against the patterns reported.
Click Taxon to get the list. Or Candidates to get an abstract list of recommendations without a sample
That is it!!! You spend the time so others do not have to and can act on their challenges with better information!
Email the lists to Research@microbiomeprescription.com
Have you ever heard from anyone who felt significantly worse on antibiotics? Since 2020 when I had ebv and iv antibiotics for an infection I can’t tolerate antibiotics like I used to. Low dose doxy 50mg makes me feel very unwell within a few hours, clarithromycin is better tolerated but if I take that I get severe abdominal pain after meals and reduced physical function which only pro and prebiotics fix. If I take a broad spectrum like metronidazol that completely fucks me up (pardon my french!) and I have to get into bed as I cannot stay awake.
There can be multiple causes, the most likely is a Jarisch–Herxheimer reaction a.k.a. “die-off”. (see this article). I have written about these for many years with a few prior posts.
There are other possible causes, for example, something is being feed and more chemicals are being dumped into your system. That is best determines with lab tests.
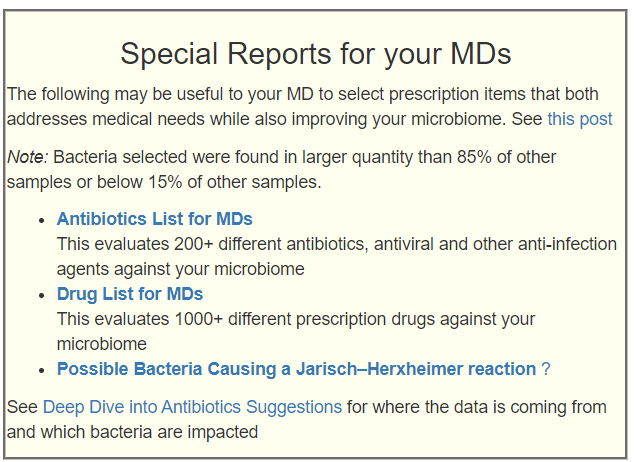
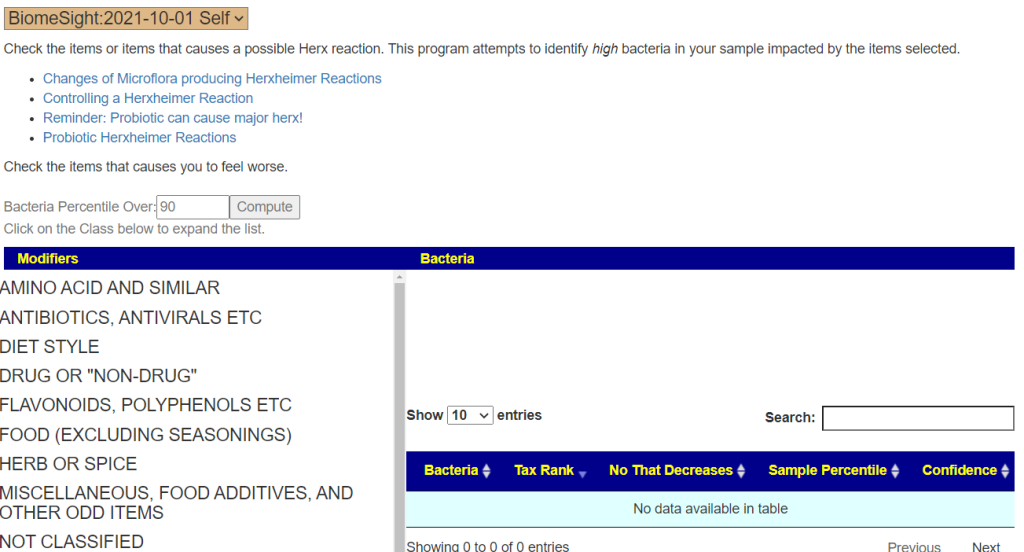
So to see explore possibilities (I deal with probabilities, not certainty), For your sample go to My Profile. You will see the new link there under Special Reports. Other common possible causes are probiotics that produce d-lactic acid (often causing brain-fog) or histamines.
Enter what causes you to feel worse on the left size, click compute and see which bacteria are likely being lowered.
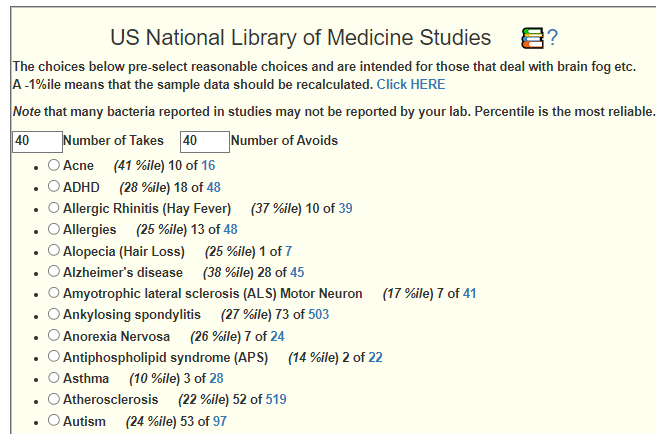
A friend got this diagnosis from a naturopath examining blood cells using a microscope. Visual inspection of blood lacks the degree of objectivity that I would prefer (AI imaging of the microscope slides is what I would like to see things evolve to). I went to Microbiome Prescription’s Medical Conditions with Microbiome Shifts from US National Library of Medicine and then look at the candidate suggestions for Nonalcoholic Fatty Liver Disease (nafld) Nonalcoholic .
Out of curiosity, I did a few cross validations for the highest to take and highest to avoid. Everything was in agreement. The few suggested items that I checked were shown to have the desired impact on NAFLD.
The purpose of cross validation is to see how well the Artificial Intelligence Logic (and assumptions) are performing.
I decided to do a deeper cross validation because I found that the treatment literature was relatively abundant. REMEMBER the AI only knows the bacteria shifts and nothing about the diagnosis or treatments.
Items to Take
In priority order, the top items with AI Weight of 20 or more
There is a strong bias to publish positive results, hence finding many n/a in the to avoid list is expected. A study show an adverse effect is unlikely to see publication. We see the following ratios:
To Take: 22 Right to 2 Wrong, i.e. 92% correct
To Avoid: 10 Right to 2 Wrong i.e. 83% correct
This suggests that the n/a ones above are likely to be correct.
A reader forwarded his results and ask if they could be uploaded. It was a CSV file which was a good sign. Inspecting the file I noticed two things:
No NCBI Taxonomy numbers were included 🙁
The report gave percentile numbers for every bacteria — a wonderful thing to see.
The reader approached Thorne support about getting the NCBI Taxonomy numbers added — with no success. After a few days of work I ended up with 99.9% success of matching their bacteria names to NCBI Taxonomy numbers. The import worked… but wait! The price is about the same as some 16s tests, but you get MORE DATA and more accurate data! See this study for the difference between 16s and Shotgun
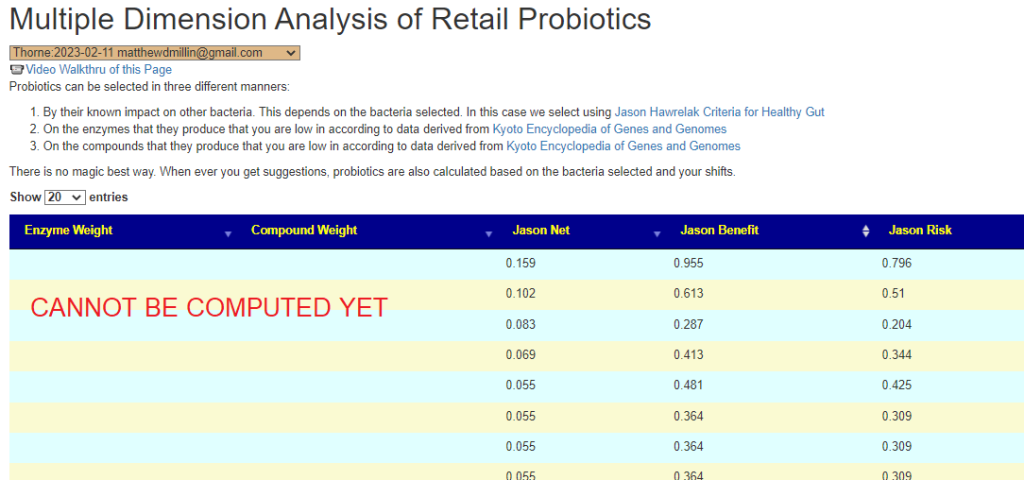
This is whole-genome shotgun metagenomics which is more accurate. It provides percentiles against a much larger sample than I could hope to get. My site is focused on percentiles — so most thing flows nicely – even when there is just one sample!!!
There are items that will not work until we hit 100+ samples from Thorne (i.e. KEGG Percentile Ranking, Pub Med Condition Percentile, etc).
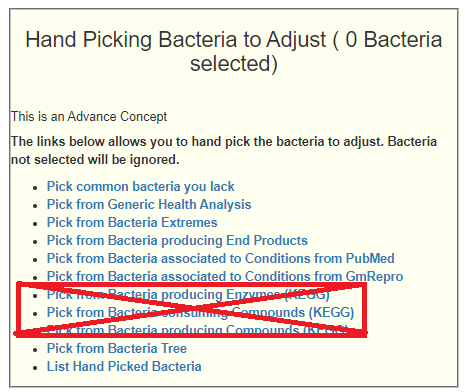
We use Thorne’s PercentilesInsufficient Data To Use these options
We substitute Percentage Match for Percentile in this section (since we are less than 100 samples)
KEGG is based on Percentiles
Bottom Line
I have ordered Thorne for my next test and expect to keep using them if the pricing stays the same. These test costs are driven by technology — which keep dropping cost over time. I recall spending $1000 to get 1 Meg of RAM many decades ago, today for the same amount, I can get 320 GB of memory — that’s 320,000 x more! The same thing is happening with microbiome and DNA testing technologies.
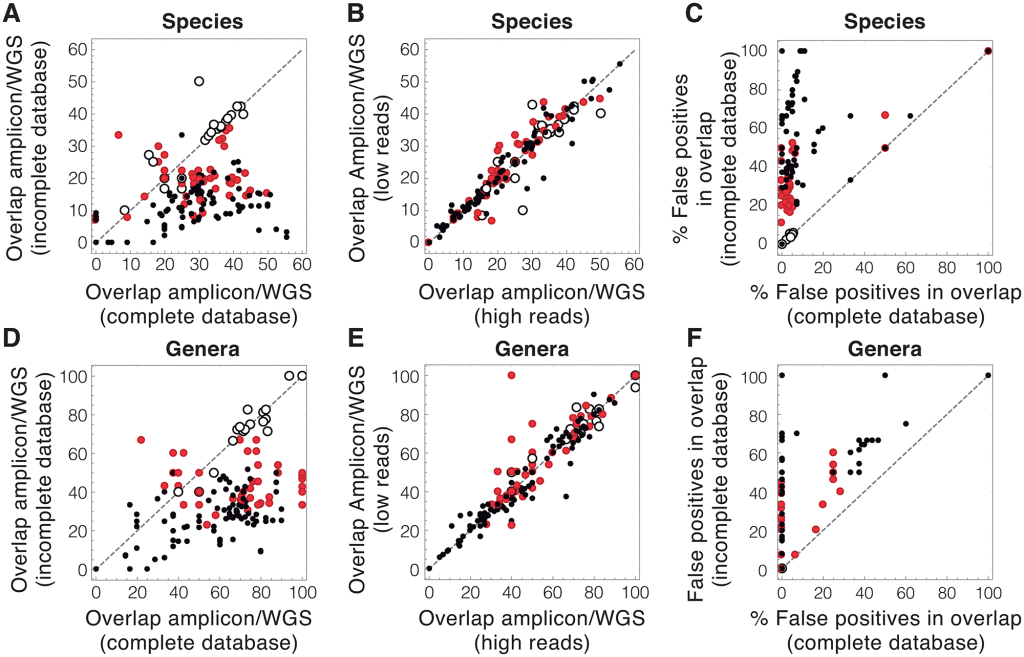
Common approaches to analyzing DNA from a community of microbes, called a microbiome, can yield erroneous results, in large part due to the incomplete databases used to identify microbial DNA sequences.
The process is equivalent to naming a person’s last name from a random DNA sample of a person.
To reduce the uncertainty of microbiome data, the effort in the field must be channeled towards significantly increasing the amount of available genomic information and optimizing the use of this information.
The analogy of “The process is equivalent to naming a person’s last name from a random DNA sample of a person” is a good description of the issue. If you get more people DNA is the database, the odds of correctly identifying the person’s birth last name increases…. naming the bacteria species or strain has the same issue.
For the purposes of Microbiome Prescription, it is not a significant factor because the Artificial Intelligence is based on odds and probability (just like finding the name). For a human, you may identify that it is likely a Norwegian or Dane and thus the last name likely ends with a “sen” with 4.6% odds of being a Jensen (see more here). It is significant if your ideology requires absolute answers.
This post is intended to educate people more on the technical aspects of the microbiome. I am not talking about taking 4 samples from one stool and sending it to 4 different testing company. I am talking about one sample sent to one testing company which then provided their analysis and a FASTQ file. The raw data.
What is a FASTQ file (besides being megabytes big)? It is the DNA (technically the RNA) of the bacteria in the stool. It looks like this (using the 4 letters that DNA has):
The file that I am using as text would be around 16 megabytes. This data comes from a lab machine. The company then processes it through their software to match up sequences to bacteria.
In this post, I am using the FASTQ from uBiome and getting reports on the bacteria from:
ubiome
thryve inside
biomesight
sequentia biotech.
Naively, one would expect almost identical results. What I got is shown in detail below. At a high level we had the following taxa counts reported
ubiome – 253
thryve inside – 632
biomesight – 558
sequentia biotech 366
I did a more technical post on my other blog. From some providers, a taxonomy may be 40% on another 2% or even none… ugly!
Number One Issue: You cannot, repeat cannot, compare a taxonomy report from one lab with another. EVER!
I have 8 uBiome reports and 2 Thryve reports. I can compare the uBiome to each other and the Thryve to each other. I can never mix their direct taxonomy reports !
Number Two Issue: If I wish to compare different lab reports, I MUST obtain the FastQ files from each lab and process them thru the same provider. The FastQ files are the raw data! For me, I prefer to push them through multiple providers which means that the 10 reports suddenly become 40 or 50 different reports in my site.
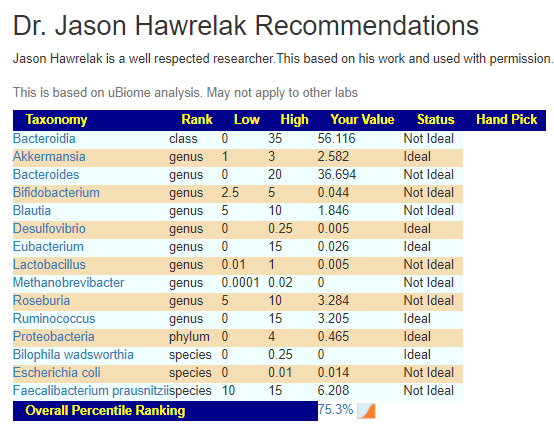
This means a lot more work for the typical user. It also means that guidance, like that from Jason Hawrelak Criteria for Healthy Gut, would need to be revised to be provider specific!
I have revised my site to show data by specific provider (while keeping the across all provider data still available). A lot of pages to revise and test.
My mom got the AstraZeneca Vaccine last year, after which she didn’t really have any major problems, so later she got her 2nd shot with BionTech/Pfizer. Shortly after she caught Covid. While the course of the disease was very mild, she experienced severe hair loss in the following days, which reverted 6 months later. Also, she started feeling tired fast and could not work anymore (nurse). That was about a year and a half ago.
She developed hypertension after she received the vaccination for COVID
As of now, she still has the same issue with CFS, though it’s gotten better on most days. Some days she gets a crash and doesn’t feel too good. What’s helping her is going outside twice to three times a day for extended walks, and she says when she goes into the pine forest nearby she feels refreshed afterwards.
Her CFS isn’t as severe as my brothers, though it still restricts her from working.\
The Lab used was BiomeSight which ships world wide. An equivalent alternative in the US is Ombre.
Analysis
I am going to do a pro-forma review, i.e. a process that other can follow easily.
My Profile/Health Analysis
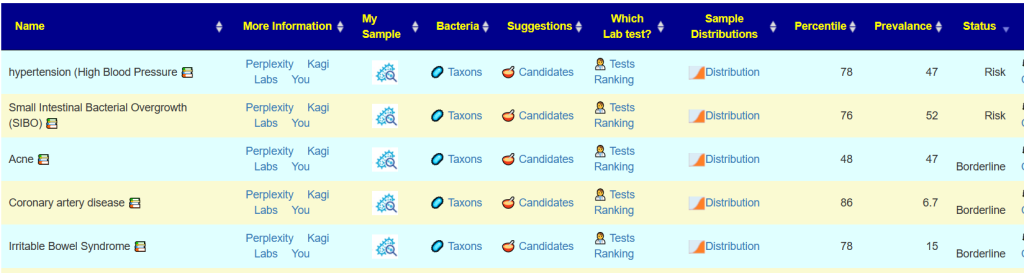
Potential Medical Conditions Detected
hypertension (High Blood Pressure 78%ile (12 of 35) prevalence 47%, so likely (and confirmed)
Acne 48%ile (4 of 20) , prevalence 47% — so very unlikely.
Since we have a condition, Long COVID or ME/CFS, we look at:
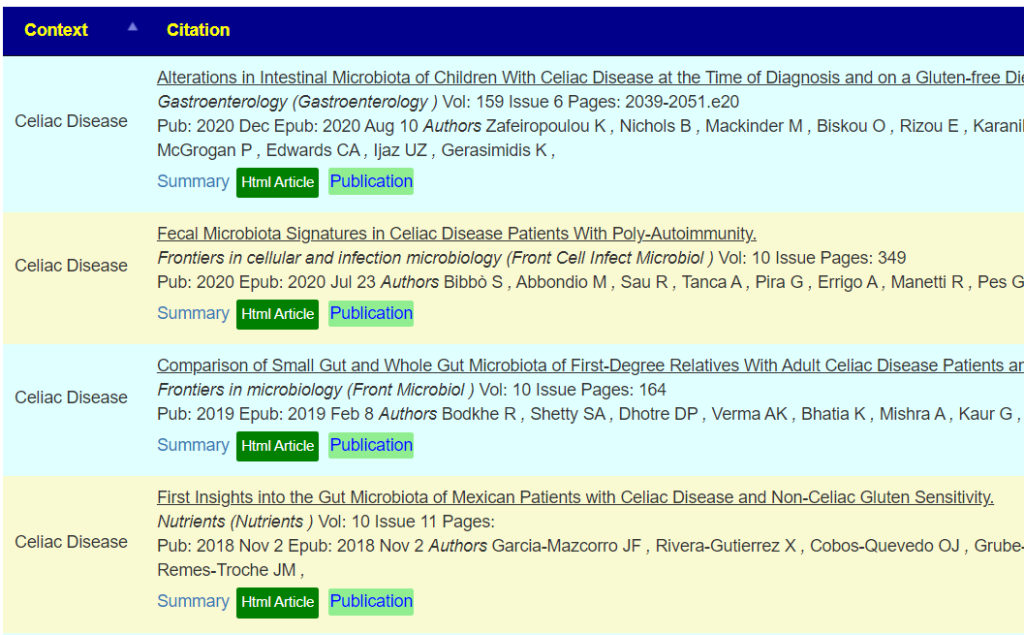
PubMed data first ( After logging in, Go to https://microbiomeprescription.com/Library/PubMed pick the sample OR see bottom of Changing Microbiome tab)
Going to Medical Conditions with Microbiome Shifts from US National Library of Medicine and sorting by status can be used to look at risks of slipping into additional issues. In this case IBS and SIBO are shown — both are commonly associated with ME/CFS. Coronary artery disease has been associated with COVID (“The risk of heart failure increased by 72%” [2022]). These could be included in building consensus suggestions.
Suggestions
Antibiotics List for MDs produced a list of many antibiotics often prescribed for ME/CFS by some specialist ✅, including:
I strongly favor Dr. Cecile Jadin approach which would be do each month a course (7-10 days) of one of the above and then move on to the next one in the following month. (See Manly Conference February 1999)
Escherichia coli is the top one, which agrees with the Alison Hunter Memorial Foundation presentations in 1998. E.Coli does not get reported in 16s reports and hence tends to be ignored in studies :-(.
Other ones included (in amount of contribution to deficient enzymes):
I explicitly checked against the new list of Bacteria Triggering Coagulation and Micro clots, and they were none at over 75%ile; so coagulation is unlikely to part of the situation. I view coagulation as a potential feedback loop to keep CFS/Long COVID going. The coagulation drops oxygen levels which encourages the growth of bacteria that produces coagulation – a nasty feed back loop.
Postscript – and Reminder
I am not a licensed medical professional and there are strict laws where I live about “appearing to practice medicine”. I am safe when it is “academic models” and I keep to the language of science, especially statistics. I am not safe when the explanations have possible overtones of advising a patient instead of presenting data to be evaluated by a medical professional before implementing.
I cannot tell people what they should take or not take. I can inform people items that have better odds of improving their microbiome as a results on numeric calculations. I am a trained experienced statistician with appropriate degrees and professional memberships. All suggestions should be reviewed by your medical professional before starting.
The answers above describe my logic and thinking and is not intended to give advice to this person or any one. Always review with your knowledgeable medical professional.


Recent Comments