Special Studies are a conceptual thought experiment. The logic is simple, identify the bacteria that are have major statistical significance from the reference. Then use these bacteria with the weight that each has being the z-score to generate suggestions.
The first reviews that I did using them had good results and agreement with my preferred trio to build consensus, namely:
This last week I have gotten several emails from people who got counter-indicated suggestions. I have verified that for their samples, it produces contrary suggestions.
Digging into the mathematics and fuzzy logic being used, I see several possible failure points that I want to slowly investigate. The top failure points are:
Using the z-score for the weight to give for each desired shifts. A different formula may resolve it. Two candidate formula are:
z-score * incidence of bacteria being seen
z-score * function(bacteria count) — with many possible functions
The z-score cut off is too low, I am using 5.0 at present, it may need to be raised to a higher value.
The criteria for picking a bacteria to include may not be specific enough, so a lot of bacteria that are fine are included. This can result in excessive noise in the suggestions
The data available for suggestions at the species levels that we are working are insufficient (and in some cases, may not exist). A lot of the species flagged are rarely seen in studies showing changes.
Bottom Line
Use the suggestions generated with great caution. If they compliment the suggestions from the three preferred consensus methods listed above — good. If they contradict, keep to the original consensus method — I have been getting consistent report that they work. The special studies suggestions are getting inconsistent results.
A special study with a z-score below 6.6 is very suspect and should be ignored.
A reader contacted me over a new post on Biomesight – How to reduce brain fog. He was concerned over the content (knowing that I have often researched and posted on brain fog), so I am doing this post to provide some clarity on brain fog. (Bad pun: Remove some fog from brain fog)
What is Brain Fog?
The term brain fog is a vague term that has been defined in the literature as a combination of the following more accurate (and measurable by tests) conditions. A better term is executive dysfunction [2015] or Cognitive Fatigue [2014]. The literature goes back to at least 1989. I know from personal experience, I have taken them from professional psychologist, and other in the family has too.
Some people will perform badly on all tests, other will perform poorly on certain tests only.
IMHO, if you do not have the majority of the above, the term may be misapplied.
For different diseases, what constitues brain fog can vary, for example:
The clinical picture typically affects visuo-spatial immediate memory (g = − 0.55, p = 0.007), reading speed (g = − 0.82, p = 0.0001) and graphics gesture (g = − 0.59, p = 0.0001). Analysis also revealed difficulties in several processes inherent in episodic verbal memory (storage, retrieval, recognition) and visual memory (recovery) and a low efficiency in attentional abilities.
Many of the above have distinct microbiome signatures and thus the hope of getting a universal microbiome signature for brain fog is an ideological belief. This appears to be confirmed in the analysis from Special Studies … Brain fog strongest z-score is just 5.2. This is lowest significance level of 26 items evaluated, the next lowest is General Fatigue. IMHO, there may be no true significance, the z-scores numbers were not adjusted for False discovery rate and incidence of reporting.
Most people will agree that there is no magic cause or microbiome signature for general fatigue — it could be an issue with iron levels, excessive lactic acid (impairment in clearing it), blood circulation issues, respiratory issues etc.
Brain fog could be described as mental fatigue and thus the same wide variety of issues can be involved. For ME/CFS, the dominant causes for brain fog, according to the literature are mentioned in some of my prior posts:
My first concern is simple, the belief of there being a common microbiome pattern is very questionable. There are likely patterns, for example, a microbiome pattern that results in higher d-lactic acid production; a pattern that results in lower d-lactic acid production; a pattern that inhibits one of the many steps in the coagulation cascade; a pattern that overloads one of the many steps in the coagulation cascade; a pattern that causes vascular constriction; a pattern that cause inflammation; a pattern that inhibits the absorption of iron…and on and on. There is not a single pattern that applies to all.
When a statement like this is made “Unsurprisingly, high ethanol producers in the gut based on research findings (separate from what we are seeing from the Biomesight dataset) is associated with brain fog.” I would expect links to these research papers to be included for the reader to follow up. Ethanol is drinking alcohol, booze – which has me very curious about the links and especially if they are seen with many of the conditions cited above.
How does special studies compared to Biomesight post
The table below shows no agreement between my special studies and their findings. We used different statistical process, but finding not a single agreement should be a red flag on relying on the data. While I have a smaller sample (approximately 1/3), the data processing to get the microbiome data was identical.
Bacteria
BiomeSight Post
Special Studies Z-Score
Escherichia coli (species)
5.3
Lactiplantibacillus pentosus (species)
5.1
Shuttleworthia (genus)
5.1
Escherichia (genus)
4.5
Veillonella (genus)
4.4
Veillonella dispar (species)
4.4
Staphylococcus pseudolugdunensis (species)
4.2
Clostridium cellulovorans (species)
4.1
Class Deltaproteobacteria
X
Species Bacteroides uniformis
X
Species Bacteroides cellulosilyticus
X
Species Phascolarctobacterium faecium
X
Genus Bacteroides
X
Species Anaerotruncus colihominis
X
Species Faecalibacterium prausnitzii
X
Genus Prevotella
X
Bottom Line
I do not believe that we can aggregate all microbiome samples reporting brain fog into a single set and find a universal pattern to address a priori. The numbers from Special Study: Neurocognitive: Brain Fog were the weakest of all special studies and, based on some other recent work in progressed, results may be adversely affected by sampling bias, sample quality, and false detection rate.
“Lots of high % potential health stuff. In real time, mother’s very hormone sensitive . Gets like a Premenstrual dysphoric disorder (PMDD) state , feels depressed. Struggles with anxiety and depression in general . Notice she’s been getting allergies. During the birth of 2nd child two years ago; mother had to get vancomycin because she was strep B positive. When the family get sick, the mother gets the sickest of the 4 of us unfortunately. Mother caught COVID in Sep 2022. Mother’s cycles in 2021 started to be heavy where before that never happened. As a kid, mother was on Accutane a lot. When mothers results through biomesight I also got a message that said unusually small file size or something along those lines.”
Foreword – and Reminder
I am not a licensed medical professional and there are strict laws where I live about “appearing to practice medicine”. I am safe when it is “academic models” and I keep to the language of science, especially statistics. I am not safe when the explanations have possible overtones of advising a patient instead of presenting data to be evaluated by a medical professional before implementing.
I cannot tell people what they should take or not take. I can inform people items that appears to have better odds of improving their microbiome as a results on numeric calculations. I am a trained experienced statistician with appropriate degrees and professional memberships. All suggestions should be reviewed by your medical professional before starting.
Mother Overview
Jason Hawrelak Recommendations – 99.7%ile (better than most), High Roseburia, Blautia. The others are low
Checking on the two studies that I could find Premenstrual dysphoric disorder
This suggests that we have a general match with the literature and should include in our consensus, a hand picked set of suggestions.
We have an impressive list of bacteria deemed unhealthy. Note that counts are often small (agreeing with the abundance of bacteria at low levels seen above).
Potential Medical Conditions Detected had at 99%ile, Schizophrenia, which suggests some overlap with PMDD.
Going Forward
I added a new choice to the site that gets canned suggestions for Bacteria Deemed Unhealthy above because of the large number of bacteria flagged in this sample.
The suggestions for this person with this new option.
Building the Consensus
I am building from:
Hand Picked (see above focused on PMDD) (4 picked)
Unhealthy Suppression – just added (33 picked)
Outside Range from Nirvana/CosmosId (5 picked)
Outside Lab Range (+/- 1.96SD) (6 picked)
Outside Box-Plot-Whiskers (60 picked)
Outside Kaltoft-Moldrup (95 picked)
The top items to suggested to take are shown below (meat and B-vitamins are concentric):
I attended this series of talks and for the readers of this blog I link to the videos in terms of my preferences below. The first ones are very technical, Day Three is much easier watching. Unfortunately, they did not post the videos, talk by talks..
Dr. Katherine Amato on Day 3 (hour 3) is likely the best starting one.
Dr. Poyet Day 3 (hour 1) on Industrialization Microbiome
Dr. Iraola Day 3 (hour 0) – on the Microbiomes of South America etc
Day 3 hour 2 — very interesting on the impact on the microbiome of anal intercourse…. there is significant impact.
This is a summary of items that may be the cause. This assumes that a lack of oxygen getting to tissue (or the brain) is the cause. Note that if the brain is tired(oxygen starved), that there may be false signals saying the body is exhausted because the brain does not have the energy to manage the body. The sources are typically from Chronic Fatigue Syndrome. Some of these may be related to the microbiome (lack of studies). It is suspected that many people are borderline (have no apparent issues) and then some event pushes them over the edge into fatigue.
This is intended as a checklist to review with your medical professional. Items should be objectively excluded by actual tests and not subjectively excluded (often a response if the professional does not know how to test). See Hypoxia[2022] and Hypoxia (medical)
Coagulation Issues
The typical scenario seems to be an inherited or acquired (epigenetic — sometimes from a virus infection) coagulation defect. Some step of the coagulation cascade gets “constipated” with the result being what is often called “sticky blood”. It only takes one step.
If the blood gets thick, it gets slow and hence less oxygen gets to the body and the brain.
Most “blood thinners” only impacts one of these steps (with heparin being the main exception). Taking excessive supplements that impacts the same step may result in long bleeding time or easy bruising.
Note: We are talking about sub-clinical (i.e. not having a stroke or blood clot) levels. The lab levels may not be abnormal, just low (or high).
Low Iron Or Impaired Heme
Hemoglobin is the iron-containing oxygen-transportmetalloprotein in the red blood cells of all vertebrates Hemoglobin in the blood carries oxygen from the respiratory organs (lungs or gills) to the rest of the body (i.e. the tissues). There it releases the oxygen to permit aerobic respiration to provide energy to power the functions of the organism in the process called metabolism. [wikipedia]. Hemogloblin can be inhibited by some chemicals (Carbon Monoxide [2022] and the pH of the blood (Bohr effect [2021]) are the most common. pH is influenced by the microbiome.
It should be noted that SPECT scans show the expected effects of shape- changed, poorly deformable red cells in reducing cerebral blood flow in regions which by chance have smaller than usual capillaries.
Hypoxia and inflammation are frequently co-incidental microenvironmental features of sites of concentrated physiological or pathological immune activity.
Hypoxia activates hypoxia-inducible factor, which is a major regulator of multiple aspects of immune cell function. Consequently, hypoxia plays a key role in the regulation of immunity and inflammation.
The impact of hypoxia on immunity and inflammation is site-specific and cell type-specific.
Pharmacological hydroxylase inhibition, which activates hypoxia-sensitive pathways, is profoundly protective in multiple models of inflammation.
David Bell, M.D. did a study in 1995 (twenty years ago) finding about low blood volume. Cort Johnson has an 2015 update by Dr. Bell that is worth reading. “In contrast, ME patients have a volume that can be as low as 50% of normal.”
Small Heart Size
“A considerable number of CFS patients have a small heart. Small heart syndrome may contribute to the development of CFS as a constitutional factor predisposing to fatigue, and may be included in the genesis of CFS.” [2008]
” Echocardiographic examination revealed that CFS patients with “small heart” had an actually small LV chamber and poor cardiac performance. Cardiac functional changes evaluated by repeated examinations appeared to be directly associated with the severity of their symptoms. Small heart syndrome with impaired cardiac function may contribute to the development of CFS through low cardiac output as a constitutional factor.” [2009]
Enzymes and thus Microbiome
“We’ve discovered that the muscles regulate oxygen consumption in a very precise way using the oxygen-sensitive enzyme FIH,”
” cytochrome P450 (CYP), monoamine oxygenase (MAO), and cyclooxygenase (COX). CYP enzymes are central players.. are important for therapeutic intervention and treatment of neurological and inflammatory diseases”
Note that blood platelets activation is part of the coagulation cascade above.
Snoring, collapse of upper airways and intermittent hypoxia are main causes of smoldering systemic inflammation in patients suffering from obstructive sleep apnea. The systematic inflammation is considered one of the key mechanisms leading to significant cardiovascular complications. Blood platelets, formerly not even recognized as cells, are currently gaining attention as crucial players in the immune continuum. Platelet surface is endowed with receptors characteristic for cells classically belonging to the immune system, which enables them to recognize pathogens, immune complexes, and interact in a homo- and heterotypic aggregates.
For the last few months I have been working with someone that runs a Long COVID support group. This has resulted in more modifiers being added. One of the outcomes has just been added to the site. She requested that a simplified set of suggestions be added to the site to make her life easier. This consists of items she picked from her experience dealing with the group.
These simplified suggestions has been added everywhere (tell me if I missed a page). If you use GI Map or similar reports, it is available after you have transferred and return to adjust suggestions. You should see these options on most suggestion pages now. To get this new condensed report, just click the checkbox.
GI Map and similar
The report is a CDV file (loads into Excel or other spreadsheet programs)
After loading, into Excel, you will need to adjust column widths
At the bottom of the page are some essential reminders.
Some of the clinical dosages above may be problematic with some medical conditions. Dosages should be reviewed by a medical professional before starting. The suggestions are based on a mathematical model. dosages are from clinical studies.
One of the purposes of these blog posts is to learn. My thinking and thoughts are there with the ability of people to correct, to comment and to learn. This post looks at GI-MAP and Biomesight report for the same person, taken at the same time. The key objectives are:
Comparing appropriate results between the two (same bacteria only)
I am not a licensed medical professional and there are strict laws where I live about “appearing to practice medicine”. I am safe when it is “academic models” and I keep to the language of science, especially statistics. I am not safe when the explanations have possible overtones of advising a patient instead of presenting data to be evaluated by a medical professional before implementing.
I cannot tell people what they should take or not take. I can inform people items that appears to have better odds of improving their microbiome as a results on numeric calculations. I am a trained experienced statistician with appropriate degrees and professional memberships. All suggestions should be reviewed by your medical professional before starting.
Simple Back Story
” I got COVID at the end of Sept 2020 and have been much worse ever since.”
We have 2 samples from Biomesight April,2022 and Sept 2022 and will see if the microbiome shifts reflect getting worse
GI-MAP vs BiomeSight
We are comparing different lab results, so reading: The taxonomy nightmare before Christmas… is strongly recommended. While results may disagree, they may be both technically accurate given the testing methodologies.
As is seen clearly, there are differences — some very striking (Firmicutes). I will leave it to the test providers to offer explanations on differences of techniques, etc. See Below One of the key issues is how labs handle not detected for determining ranges: some will exclude it from the calculation (thus range IF detected) and others will give it a zero value and include it.
I was curious about Bacillus distribution, which is shown below
Explanation of differences from GI-MAP
COMMENT FROM DIAGNOSTIC SOLUTIONS LAB
Thank you for contacting us and providing an opportunity for us to comment. Metagenomic sequencing has been popular for untargeted characterization of microbiome composition, whereas qPCR is used primarily for accurate quantitation of selected targets (microbes and genes of interest) especially those with particular clinical implications, such as common pathogens and opportunists. Metagenomic sequencing and qPCR are not considered competing methodologies for the same purpose, so it’s not an apples-to-apples comparison.
A major difference between the two methods is the type of quantitation that they provide. Metagenomic sequencing results are expressed as relative abundance (usually as a percentage), whereas qPCR results are expressed as absolute abundance (usually microbial cells per gram of stool). With relative abundance, it’s not possible to directly determine how much of a given taxon (species, genus, etc) is actually present, since its relative abundance is dependent upon the relative abundance of all of the other detected taxa. A couple of example references are included below.
The differences between relative and absolute abundance are likely key factors contributing to any differences in results between GI-MAP and metagenomic tests. From a clinical standpoint, there are demonstrated advantages of using methods, such as qPCR, that provide absolute quantitation, since absolute quantitation has been shown in research studies to be more effective in identifying true correlations with quantitative clinical markers. Examples of clinical markers that are included on GI-MAP include calprotectin, secretory IgA, pancreatic elastase and occult blood.
A quantitative sequencing framework for absolute abundance measurements of mucosal and lumenal microbial communities
“Thus, an inherent limitation of methods that use relative abundance is that they cannot determine whether an individual taxon is more abundant or less abundant (the direction of the change) or by how much (the magnitude of the change) between two experimental conditions or samples.”
Benchmarking microbiome transformations favors experimental quantitative approaches to address compositionality and sampling depth biases
“Our results demonstrated that quantitative approaches performed better than their relative and compositional counterparts when it comes to identifying taxon–metadata associations or studying taxon–taxon interactions. The observed performance gap among the methods profiled widened with increasing unevenness of taxa distributions, as exemplified by our analyses of the blooming scenario.”
Explanation from BiomeSight
As many of your readers know, it is not possible to compare Biomesight and GI MAP directly due to the differences in what and how it is measured. The strength of a 16s test is in the ability to see the overall ecosystem and this technology is widely used today in clinical and academic research, often alongside shotgun or other WGS techniques. It allows for coverage of a range of bacteria that’s not included in more focused PCR tests.
Additionally, Biomesight already has around 400 samples from the long covid community allowing for better profiling of the condition. We have shared around half of these samples’ results with MicrobiomePrescription enabling a strong comparison base.
Here’s some of our blog articles covering our findings from the study:
Without Filtering – using Kaltoft-Moldrup for bacteria selection
We have 70 bacteria selected
Using Special Studies
We have 93 bacteria selected.
Getting Worst with Long COVID
Taking ME/CFS as a typical pattern, there tend to be three main paths:
Slow or Spontaneous Remission
Steady state with waxing and waning
Slow progressive deterioration, sometimes ending in complete system failue
There are two others, suicide from hopelessness and Remission cause by specific treatment (which was my personal case).
The reader had a early-COVID sample which allows comparisons. It is especially nice that the Lab Read Quality are similar, which makes interpretation more robust.
Criteria
Current Sample
Old Sample
Lab Read Quality
10.3
10
Bacteria Reported By Lab
639
507
Bacteria Over 99%ile
6
3
Bacteria Over 95%ile
26
13
Bacteria Over 90%ile
40
26
Bacteria Under 10%ile
198
284
Bacteria Under 5%ile
173
229
Bacteria Under 1%ile
155
161
Lab: BiomeSight
Rarely Seen 1%
3
7
Rarely Seen 5%
16
25
Pathogens
34
36
Outside Range from JasonH
10
10
Outside Range from Medivere
19
19
Outside Range from Metagenomics
9
9
Outside Range from MyBioma
7
7
Outside Range from Nirvana/CosmosId
19
19
Outside Range from XenoGene
6
6
Outside Lab Range (+/- 1.96SD)
14
8
Outside Box-Plot-Whiskers
67
42
Outside Kaltoft-Moldrup
181
186
Condition Est. Over 99%ile
0
0
Condition Est. Over 95%ile
0
0
Condition Est. Over 90%ile
3
0
Enzymes Over 99%ile
8
0
Enzymes Over 95%ile
28
14
Enzymes Over 90%ile
52
30
Enzymes Under 10%ile
150
240
Enzymes Under 5%ile
120
161
Enzymes Under 1%ile
90
88
Compounds Over 99%ile
7
8
Compounds Over 95%ile
37
101
Compounds Over 90%ile
146
360
Compounds Under 10%ile
94
443
Compounds Under 5%ile
60
162
Compounds Under 1%ile
35
101
A summary of the above would be:
More bacteria are in play over time, post COVID
More bacteria at extreme high values
Less bacteria at extreme low values
No difference seen for canned selection of bacteria ( JasonH thru XenoGene)
More extreme values seen from Outside Lab Range (+/- 1.96SD), and Outside Box-Plot-Whiskers
Enzyme production became more extreme over time, after COVID
Compound production extreme values dropped a lot
This agrees with Special Studies on a large population (n > 150) of long COVID, especially for Compounds. There were no statistically significant compounds detected. There were statistically significant bacteria and enzymes detected.
Looking at the From Special Studies, we see that the degree of match for all of the top items have increased significantly (with the lab quality being similar), which is in agreement with “getting worse”
Older Sample
Latest Sample
Inflammatory bowel disease
52% match
63% match
Small intestinal bacterial overgrowth (SIBO)
45%
54%
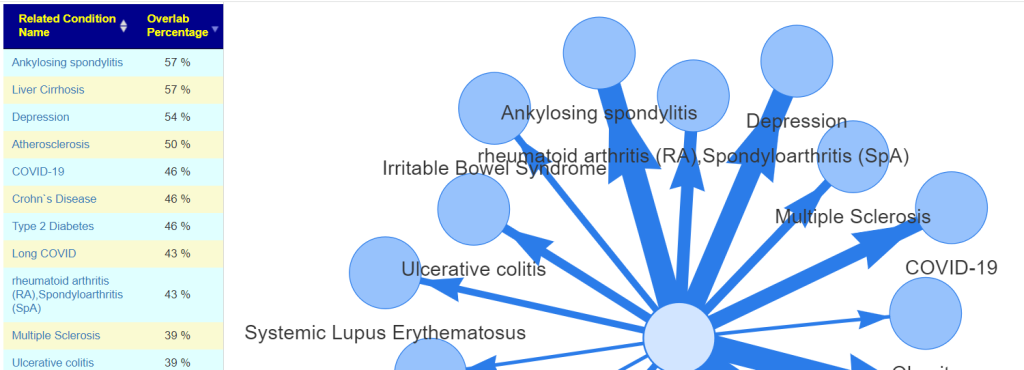
Depression
43%
50%
ME/CFS without IBS
42%
50%
COVID19 (Long Hauler)
41%
46%
Unrefreshed sleep
41%
51%
Which set of Suggestions is likely best?
Using BiomeSight data with Long COVID with Special Studies is by far the best. It detects 93 different bacteria at a detail level (low hierarchy – species, z-scores for each above 2.6) versus GI-MP with PubMed Long COVID studies which detects just 2 bacteria at the highest hierarchy level (phylum). While GI-MAP may be technically superior, there are two important factors:
The number of bacteria reported is significantly less in GI-MAP. Ideally, they will, in time, provide a deep report with NCBI numbers available for download or automatic transfer.
Volume of data and volume of different bacteria has an exponential impact on the ability to detect what has statistical significance.
We do not have a curated set of samples with Long COVID with GI-MAP. In other words, it does not point to the specific bacteria we should focus on.
Bottom Line
I am going to skip building a consensus here. The Special Studies filter for Long COVID feels right for a starting point. Doing the suggestions for 3 months and then doing a retest would be my way forward (after reviewing with your medical professional)
What we have not touched is probiotics.
From KEGG data, the top species were Azospirillum lipoferum, Streptomyces venezuelae, Azospirillum brasilense — all sitting in 110-120 range. These are from probiotics like Equilibrium and Prescript Assist (various versions) – Prescript-Assist®/SBO Probiotic sits at the top of mixed impact.
Reminder: One set of probiotic suggestions is obtained from the (very few) studies using the probiotics species and seeing what is affected. The other set of suggestions is obtained from the genomics of the bacteria that you have and the genomics of probiotic species. Two very different approaches which lead to the same probiotics.
Questions
This person is a new person to microbiome intrepretation (with a dose of brain fog)
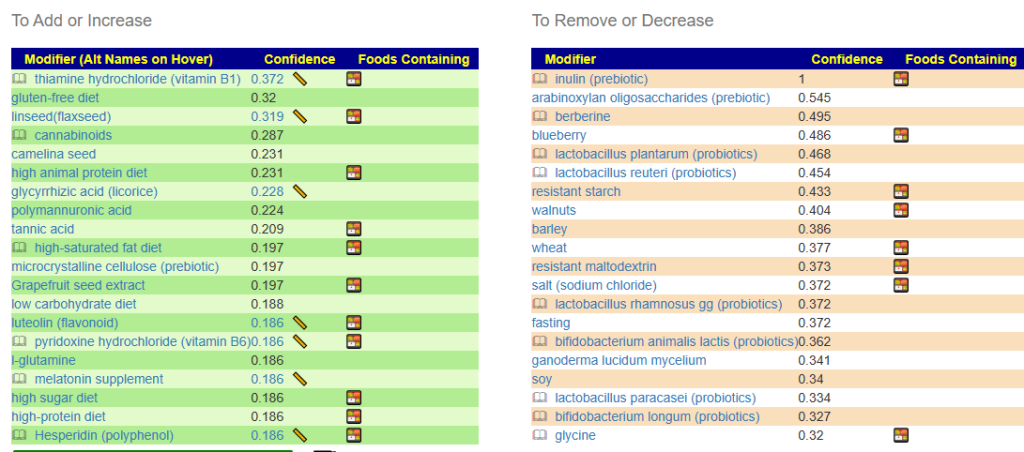
Q: Are the items on the green add or increase lists the things I should be adding to my diet to help lower the levels of the bad bacteria I have.?
A: Correct, Some items have a ruler beside it, 📏, This is a link to dosages used in clinical studies (i.e. likely both safe dosages, and likely sufficient dosage to cause change. They are slowly being added for more and more modifiers.
I have shown suggestions from BOTH of your samples below, you will note that they are very similar.
For example for walnuts we see that 40-80 gram/day (1.5 to 4 ounce) or 1/3 – 2/3 cups/day.
A: The Red ones are ones to reduce or eliminate from your diet when possible. These are substance that encourages the bad shifts. Often there can be surprises when the items to avoid are those often suggested. Best example is Vitamin B12 — I have a hypothesis (which some people agree with from their experience) that there are greedybacteria in the gut that thrives on B-12 (thus accounting for low B-12 levels in the blood). It is suggested that B-Vitamins be taken by injection or transdermal (via skin patches).
Q: What should be the priorities in terms of diet and supplements to help reduce the levels of bad bacteria?
A: After reducing as many red items slowly (don’t go cold turkey!) as practical, start adding the green items with the highest confidence items according to practically (cost, ease of preparation, other issues). Again, small steps, adding one every two days. For probiotics, do one for two weeks and then change to a different one (See this post for background)
Q: Also the top three probiotics that the AI program came up with are Symbiopharm/ symbioflo, Regactiv immune and vitality and LGasseri probiotic. Is that correct? I have started taking Visbiome?
A: Yes, Visbiome has mixed benefits, some of it’s component may shift items in the wrong way. It’s estimated confidence is 11 versus another mixed item Global Healing Center / FloraTrex with a value of 95. I would suggest taking it for two weeks (or until one of the other arrives, which ever occurs last).
Q: Also I see that Enterobacter, Bacteroides, Firmicites and Bacillus are too high. Which of these is the biggest problem and what particular bacteria in these bacteria families are over grown?
A: Unfortunately, there is no way to detects which is the biggest problem. People will often speculate. With specials studies, we get a measure of how strongly bacteria are associated (called a z-score), For you, the most statistically significant for Long Covid that you have are
Catonella
Catonella morbi
much lower: Clostridia
For Chronic Fatigue Syndrome the top ones for significance that you have are:
Sporolactobacillus
Sporolactobacillus putidus
Prevotella copri
Shuttleworthia
Q: I see from watching your other videos that I fit the pattern of a CFS patients pattern with a high number of rare bacteria. Have you seen people being able to reverse this to a more healthy normal microbiome and recover?
A: Yes, take a look at this recent review A History of Several 16s Tests and Suggestions where we see measurable objective improvement as well as the person reporting improvement of some symptoms. There are several people that are doing test-> suggestions –> retest repeat. They have been forwarding their new samples to do an update as they are done (usually 3 months between tests). The pattern has been improvement both subjectively and objectively — unfortunately, it is not an overnight recovery, rather a slow methodological journey.
Different combination of bacteria cause different symptoms so the progress is from waypoint to waypoint .
One of the common misconception is that there is a “normal” microbiome that can be used as a reference. Below is a chart from “Metagenomic sequencing of fecal DNA“. Diet makes a major impact on the distribution and volume of the bacteria.
“In a study of gut bacteria of children in Burkina Faso (in Africa), Prevotella made up 53% of the gut bacteria, but were absent in age-matched European children.”[2010]
The chart below is for healthy individuals in 12 different countries. In some cases neighboring very similar countries (Sweden [SE] and Denmark [DK]) have very different compositions.
This great variation means that testing the microbiome can only be done as group of individuals living in the same area with similar eating habits…. An individual result without reference from people with the same eating habits and possibly ethnic background is very fuzzy to interpret. Yes, highlights may be common — like low E.Coli, Lactobacillus and Bifidobacteria…. but they likely apply to no more than 80-90%, others may have different shifts based on things like being gluten free and other diets.
Then we also find that DNA also impacts the microbiome,
Host genetic variation drives phenotype variation, and this study solidifies the notion that our microbial phenotype is also influenced by our genetic state. We have shown that the host genetic effect varies across taxa and includes members of different phyla. The host alleles underlying the heritability of gut microbes, once identified, should allow us to understand the nature of our association with these health-associated bacteria, and eventually to exploit them to promote health.
People have asked me, “Did you get your microbiome done, what was it?” My honest answer was “No, such testing was not available when I last had CFS. I simply assumed that my pattern would be an appropriate match to that reported from the 1998 Australian studies”
Age changes the microbiome
” DNA of the Clostridium leptum group and pathogenic Enterobactericeae increase in the gut microbiome with age and can be detected in the same individual’s coronary plaques along with pathogenic Streptococcus spp., associating with more severe coronary atherosclerosis. ” [2019]
The presence of the Bifidobacterium, Faecalibacterium, Bacteroides group, and Clostridium cluster XIVa decreased with age up to 66-80 years of age, with differences reaching statistical significance for the latter group. Interestingly, the levels of some of these microorganisms recovered in the very old age group (>80 years), with these older individuals presenting significantly higher counts of Akkermansia and Lactobacillus group than adults and the younger elderly
Latitude means the distance from the equator. This may be due to sunlight-vitamin D levels.
If you exercised recently impacts the microbiome
Underlying these macro-level microbial alterations were demonstrable increases in select bacterial genera such as Veillonella (+14,229%) and Streptococcus (+438%) concomitant with reductions in Alloprevotella (-79%) and Subdolingranulum (-50%). To our knowledge, this case study shows the most rapid and pronounced shifts in human gut microbiome composition after acute exercise in the human literature.
“We analyzed the combined microbiome data from five previous studies with samples across five continents. We clearly demonstrate that there are no consistent bacterial taxa associated with either Bacteroides– or Prevotella-dominated communities across the studies. By increasing the number and diversity of samples, we found gradients of both Bacteroides and Prevotella and a lack of the distinct clusters in the principal coordinate plots originally proposed in the “enterotypes” hypothesis. The apparent segregation of the samples seen in many ordination plots is due to the differences in the samples’ Prevotella and Bacteroides abundances and does not represent consistent microbial communities within the “enterotypes” and is not associated with other taxa across studies.” [2016]
” All Egyptian gut microbial communities belonged to the Prevotella enterotype, whereas all but one of the U.S. samples were of the Bacteroides enterotype.
The intestinal environment of Egyptians was characterized by higher levels of short-chain fatty acids, a higher prevalence of microbial polysaccharide degradation-encoding genes, and a higher proportion of several polysaccharide-degrading genera.
Egyptian gut microbiota also appeared to be under heavier bacteriophage pressure.
In contrast, the gut environment of U.S. children was rich in amino acids and lipid metabolism-associated compounds; contained more microbial genes encoding protein degradation, vitamin biosynthesis, and iron acquisition pathways; and was enriched in several protein- and starch-degrading genera.
Levels of 1-methylhistamine, a biomarker of allergic response, were elevated in U.S. guts, as were the abundances of members of Faecalibacterium and Akkermansia, two genera with recognized anti-inflammatory effects.
The revealed corroborating differences in fecal microbiota structure and functions and metabolite profiles between Egyptian and U.S. teenagers are consistent with the nutrient variation between Mediterranean and Western diets.” [2017]
“This suggests that similarities between the Inuit diet and the Western diet (low fiber, high fat) may lead to a convergence of community structures and diversity. However, certain species and strains of microbes have significantly different levels of abundance and diversity in the Inuit, possibly driven by differences in diet.” [2017]
Bottom Line
IMHO: There is no clear definitive benefit from doing an individual microbiome testing — there is no reference that is reliable for it on an individual basis at a fine level of details. On the other hand, having results showing abnormalities help in several ways:
It encourages you to make changes in eating which will usually be for the better
It confirms that you have significant shifts and supports the concept that the gut is causing your symptoms.
” This work supports that sex is a critical factor in colonic bacterial composition of an aged, genetically-heterogenous population. Moreover, this study establishes that the effectiveness of dietary interventions for health maintenance and disease prevention via direct or indirect manipulation of the gut microbiota is likely dependent on an individual’s sex, age, and genetic background. ” [2019]
An awareness of differences in gut microbial strains between populations has already led to the notion that probiotics for treating malnutrition should be locally sourced (38).
From Bifidobacterium infantis treatment promotes weight gain in Bangladeshi infants with severe acute malnutrition. Sci. Transl. Med.14, eabk1107 (2022).
I have held to the hypothesis that a person DNA and their microbiome evolved thru their ancestors and their ancestors’ diet together. This study demonstrated that the strains diverge .
Suzuki et al. noted that the global distribution of some human gut microbial strains mirrors historical human migration patterns out of Africa … However, within a species, some strains can show remarkable population specificity. The question is whether such specificity arises from a shared evolutionary history (codiversification) between humans and their microbes.
Evolutionary history of someone from the Hebrides Islands produces a high incidence of red hair. Evolutionary history of someone from the South Africa will be black haired, and low and high curl individuals [2017]. Similarly, their microbiome will be different and reflect the DNA inherited by their host.
This was nicely illustrated in a series of diagrams in the above article. In the middle of each circle, you will see how the different strains branched from each other:
I noticed the following in the article:
For mother-child pairs, strain sharing is often interpreted as vertical transmission, but acquisition of strains from a shared environment cannot be excluded (8). Indeed, our data also support strain sharing between community members: Within sampling locations in Gabon and Vietnam, we observed instances of the same strains in the microbiomes of mothers and unrelated children
Mother passing bacteria on to the children — breast feeding is the likely mechanism
We hypothesized that species that codiversified with their hosts are better adapted to the host environment than those that did not….together with the observed functional attributes, such as smaller genomes and oxygen and temperature sensitivity, codiversified species likely evolved host dependency.
This means issues such as diet and environment (hot, cold, humid, dry) impacts the evolution of the bacteria in the microbiome
Bottom Line
Probiotics should be sourced locally/from same genetic heritage. This is very technically feasible — just isolate the bacteria from stools of a suitable population, sequence it to insure no undesirable genetics, culture it and produce a local version.
Personally, I chuckle because the probiotic that I have responded best to was one that was one obtained from Germans in 1917, which in a match for my ancestry (Duchy of Slesvig, and southern islands of Denmark).
If you are of East Indian Descent (perhaps living in the US), you may wish to obtain probiotics from India and not your local health store. IMHO, you should contact the distributor of any probiotic that you use to obtain the provenance of the strain being used. Demand it!
To rephrase for some:
If the probiotic kosher?
If the probiotic halal?
Unfortunately, many probiotics being sold out there are not even from human sources, little more appropriate (regional) human sources for the consumers.
Recent Comments