Prior Posts
- Update on ME/CFS Person [Sep 2023]
- Follow up Microbiome Analysis from a prior post [Apr 2022]
- Rosacea, Circulation and mild CFS [Dec 2021]
Analysis
A summary of his seven results are below. The Lab Read Quality bounces around, and with that, other values may echo these shifts (i.e. up to 20% shifts for some measures). A low read quality means less bacteria are reported, for example, when it was low, the Outside Kaltoft-Møldrup has low, when it was high, the value became high.
Another way to view it is this: If 10% are out of range and 400 are reported then we have 40. If we have 660 in another report then we would expect 66. This could be misread as a 66/40 or a 65% increase in out of range bacteria when the same percentage is out of range. Technically, it is more complicated but that should explain the problem.
Looking only at high read quality ( 1/22/2024, 2/22/2023, 8/31/2021) we see improvements where there are 🙂 below. This is an unfortunate aspect of 16s tests.
I have added at the bottom Forecast Symptoms compared to actual.
| Criteria | 1/22/2024 | 9/12/2023 | 2/22/2023 | 8/11/2022 | 3/25/2022 | 12/3/2021 | 8/31/2021 |
| Eubiosis | 56.4 | 100 | 37 | 100 | 100 | 68.1 | 67.4 |
| Lab Read Quality | 7.9 | 3.5 | 9.7 | 5.5 | 6.2 | 3.6 | 7.8 |
| Outside Range from GanzImmun Diagostics | 16 | 16 | 15 | 15 | 17 | 17 | 20 |
| Outside Range from JasonH | 7 | 7 | 7 | 7 | 4 | 4 | 6 |
| Outside Range from Lab Teletest | 20 🙂 | 20 | 24 | 24 | 22 | 22 | 25 |
| Outside Range from Medivere | 16 | 16 | 15 | 15 | 15 | 15 | 19 |
| Outside Range from Metagenomics | 7 | 7 | 9 | 9 | 7 | 7 | 8 |
| Outside Range from Microba Co-Biome | 2 | 2 | 7 | 7 | 1 | 1 | 1 |
| Outside Range from MyBioma | 5 🙂 | 5 | 7 | 7 | 7 | 7 | 8 |
| Outside Range from Nirvana/CosmosId | 20 | 20 | 23 | 23 | 18 | 18 | 21 |
| Outside Range from Thorne (20/80%ile) | 198 🙂 | 198 | 223 | 223 | 217 | 217 | 246 |
| Outside Range from XenoGene | 24 🙂 | 24 | 32 | 32 | 36 | 36 | 39 |
| Outside Lab Range (+/- 1.96SD) | 5 🙂 | 15 | 10 | 11 | 9 | 9 | 14 |
| Outside Box-Plot-Whiskers | 54 | 56 | 42 | 36 | 42 | 59 | 42 |
| Outside Kaltoft-Møldrup | 123 🙂 | 70 | 139 | 56 | 78 | 59 | 140 |
| Bacteria Reported By Lab | 511 | 399 | 666 | 478 | 613 | 456 | 572 |
| Bacteria Over 90%ile | 20 🙂 | 54 | 26 | 24 | 26 | 57 | 46 |
| Bacteria Under 10%ile | 108 | 41 | 82 | 48 | 44 | 29 | 99 |
| Shannon Diversity Index | 1.368 | 1.18 | 1.038 | 1.287 | 1.561 | 0.895 | 0.903 |
| Simpson Diversity Index | 0.115 | 0.063 | 0.05 | 0.042 | 0.058 | 0.022 | 0.02 |
| Chao1 Index | 7603 | 5057 | 12534 | 8053 | 13234 | 5563 | 9209 |
| Pathogens | 26 🙂 | 25 | 30 | 23 | 39 | 24 | 30 |
| Condition Est. Over 90%ile | 0 | 0 | 0 | 0 | 0 | 0 | 0 |
| Actual Symptoms in top 10 Forecasted | 5 | 8 | 10 | 8 | 8 | 10 | 9 |
| Max Forecast Symptom Factor | 38.5 | 22.3 | 25.3 | 16.9 | 15.8 | 26.4 | 33.1 |
Explaining the new Symptom Forecast Algorithm
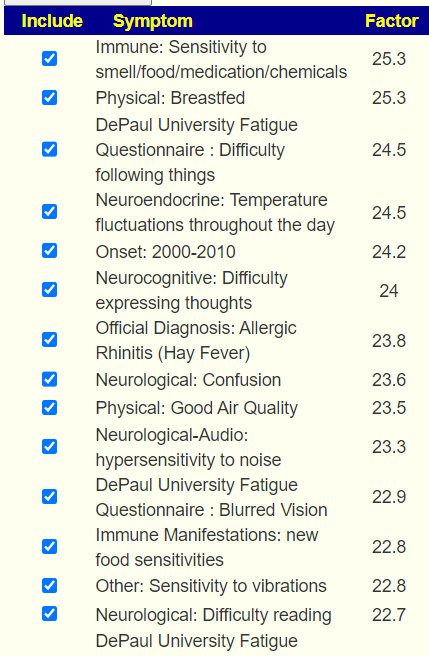
This algorithm is similar to the Eubiosis algorithm. We compute the expected number of matches to bacteria shifts associated with the symptoms. The expected theoretical threshold by randomness is 16%. A higher number indicate increased odds, a lower number decreased odds. This is based on the existing annotated samples uploaded. It is not definitive and often there can be multiple subsets of bacteria associated with a symptom. The match is on too much or too few of a collection of bacteria
The checkmarks are the entered symptoms, the list are the predictions from most likely to lesser.
This data actually clarifies that the ideal 16+ for a factor is dependent on the Lab Read Quality and that 16 may apply to shotgun results but for 16s results, some flexibility with the 16 is warranted.
As a general FYI, hitting 80-100% correct prediction of symptoms implies that the algorithm performs well and the change of algorithm was appropriate.
It also implies that we are successfully identifying the bacteria associated with the symptoms..
The drop of matches with this sample is difficult to clearly interpret. It was not intended to be an indicator but a tool to correctly identify the bacteria of concern. Getting suggestions solely from the symptoms have been added. See the video below.
Going Forward
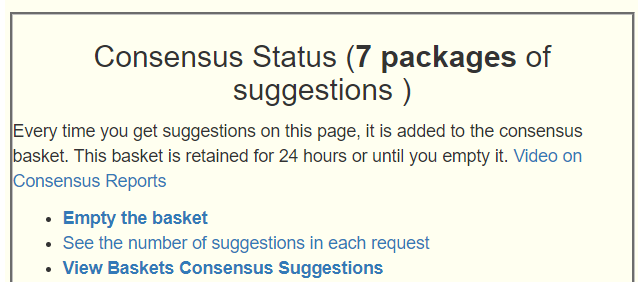
Again, using Just give me suggestions include Symptoms is how we are going to proceed. And then add in the two Special Studies. This results in 7 packages of suggestions.
Thresholds: High is 524 thus 260 or higher, Low is -346 this -170 or lower
For our first pass, we are going to look items that all 7 agrees upon, the list is very short
- TAKE: fruit/legume fibre
- AVOID:
The two take list is very short. Prescription items dominates the list with metronidazole (antibiotic)s[CFS] at 524(the TOP), followed by amoxicillin (antibiotic)s[CFS], ciprofloxacin (antibiotic)s[CFS]. The top NOT-PRESCRIPTION is 232, so we will drop the threshold to 116
- Foods:
- Herbs
- Probiotics (no prebiotics made it)
- Sugars
- sucralose (artificial sugar) a.k.a. Splenda,
- raffinose(sugar beet)
- aspartame (sweetener)
The avoid list is much bigger
- Diet: Avoid the extremes: low-fat diets, fibre-rich macrobiotic ma-pi 2 diet, high sugar diet, hypocaloric hyperproteic diet,methionine-choline-deficient (MCD) diet, high red meat, fasting
- quercetin,resveratrol, xylan (prebiotic), Human milk oligosaccharides (prebiotic, Holigos, Stachyose), resistant starch, resistant maltodextrin, arabinogalactan (prebiotic)
- cranberry bean flour, Pulses, blackcurrant
- Slippery Elm, berberine, grape seed extract
- bacillus licheniformis,(probiotics), lactobacillus plantarum (probiotics),
- stevia, saccharin, xylitol, non-starch polysaccharides
For myself, I would try to obtain and rotate the antibiotics listed above and use Splenda where practical.
Bottom Line
This analysis has been both challenging and informative. We see that 16s Lab Read Quality can confuse analysis because it will alter many measures significantly. Care must be taken when comparing two or more samples with different Read Quality. Additionally, having the top suggestions full of prescription items means that we needed to adjust the threshold based on the top non-prescription item.
On the positive side, we see that the revised symptom forecasts appear to perform well, actually better than I was expecting.
Postscript – and Reminder
I am not a licensed medical professional and there are strict laws where I live about “appearing to practice medicine”. I am safe when it is “academic models” and I keep to the language of science, especially statistics. I am not safe when the explanations have possible overtones of advising a patient instead of presenting data to be evaluated by a medical professional before implementing.
I cannot tell people what they should take or not take. I can inform people items that have better odds of improving their microbiome as a result on numeric calculations. I am a trained experienced statistician with appropriate degrees and professional memberships. All suggestions should be reviewed by your medical professional before starting.
The answers above describe my logic and thinking and is not intended to give advice to this person or anyone. Always review with your knowledgeable medical professional.
Recent Comments