I have an extensive collection of bacteria shifts reported from Studies on the US National Library of Medicine Studies for some 91 different conditions.
My past practice has been to deem over 75%ile to be a match if the study reported high and below 25%ile if the study reported a low. I then compute the number of hits for all samples and determine each person’s percentile. I then look at the reported incidence of the condition and see if there is a likely match.
For example, the condition is seen in 5% of the population: one person is at 45%ile – thus unlikely; another person is at 95%ile – thus borderline; a last person is at 99%ile – thus likely.
These 25%ile and 75%ile were arbitrary numbers point out of the air. I dislike arbitrary numbers. This attempts to find better numbers supported by evidence.
The root problem is that the study typically reports that the average of people with a condition is statistically different from the control group. This means that the only clear fact is whether the sample of people with this condition is higher or lower than the control group. This cannot be applied to an individual because the average is the average of a population with a wide range of values reported.
I looked at current available data and picked Depression to use for some test runs. We have 298 samples that are annotated with depression, and 226 different bacteria-shifts from studies). We divide our population into those that annotated with depression and those that annotated their sample but did not include depression.
- Ombre reports 166 of the 226 bacteria from studies
- BiomeSight reports 147 of the 226 bacteria from studies
- uBiome reported 154 of the 226 bacteria from studies
This implies that Ombre may produce the best results, uBiome with intermediate, and Biomesight the worst.
The method is easy, finding the number of matches per sample for with depression and without depression. Then get the ratio between them. If the percentage is below 100, then we have false positives. We want the numbers to be over 100%. After going through the numbers, I came up with 109% as being a good threshold.
My first run was aggregating all lab data. We see good discrimination using 6%ile/94%ile. This drops almost in half at 10%ile/90%ile and disappears at 40%ile/60%ile. Aggregating all samples together has usually resulted in reduced statistical significance.
| Percentile | With | Without | Ratio |
| 1 | 1.28 | 1.14 | 112% |
| 2 | 2.55 | 2.31 | 111% |
| 3 | 3.70 | 3.39 | 109% |
| 4 | 4.89 | 4.44 | 110% |
| 5 | 6.05 | 5.54 | 109% |
| 6 | 7.13 | 6.57 | 109% |
| 7 | 8.12 | 7.63 | 106% |
| 8 | 9.25 | 8.75 | 106% |
| 9 | 10.32 | 9.80 | 105% |
| 10 | 11.41 | 10.80 | 106% |
| 15 | 17.11 | 16.48 | 104% |
| 19 | 21.29 | 20.75 | 103% |
| 29 | 32.16 | 31.58 | 102% |
| 30 | 33.11 | 32.70 | 101% |
The next runs are being lab specific:
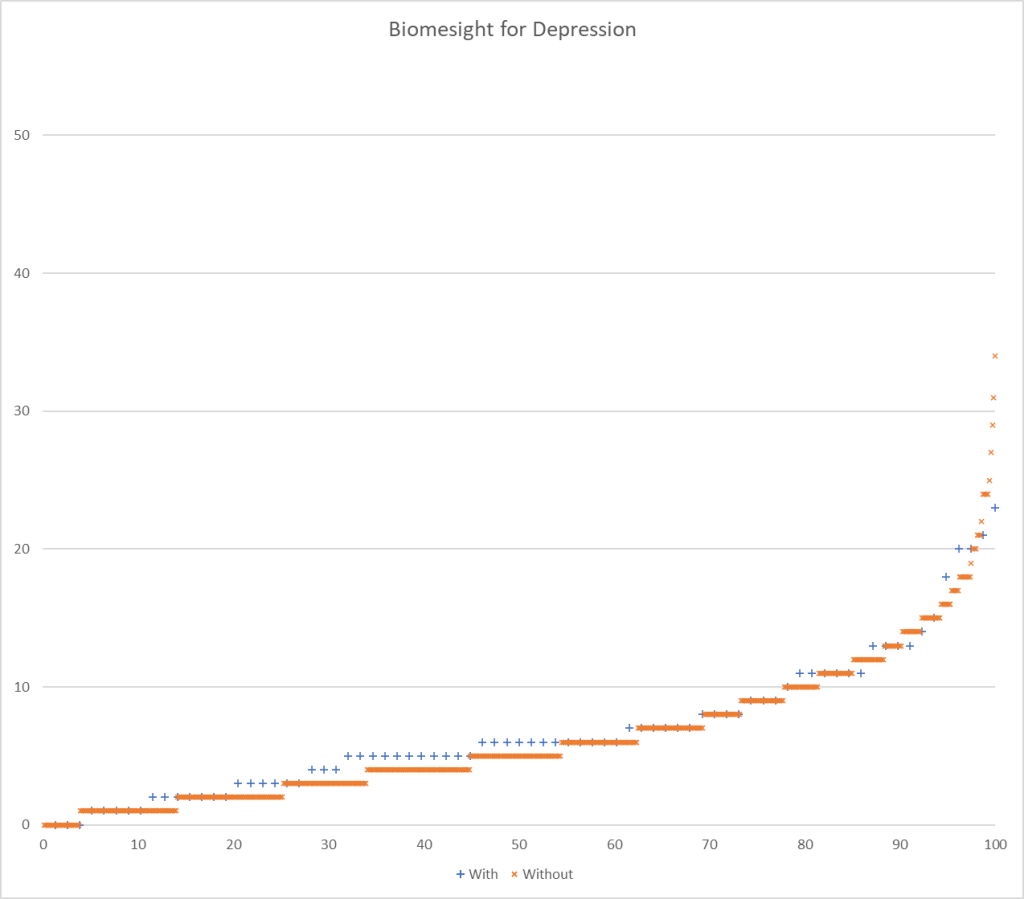
- Biomesight:
- 78 with depression,
- 637 without depression.
- We use a criteria of a ratio of 109% or better, so 6%ile/94%ile
| Percentile | With | Without | Ratio |
| 1 | 1.26 | 1.10 | 115% |
| 2 | 2.86 | 2.48 | 115% |
| 3 | 3.99 | 3.57 | 112% |
| 4 | 5.22 | 4.68 | 111% |
| 5 | 6.47 | 5.82 | 111% |
| 6 | 7.68 | 6.87 | 112% |
| 7 | 8.51 | 7.96 | 107% |
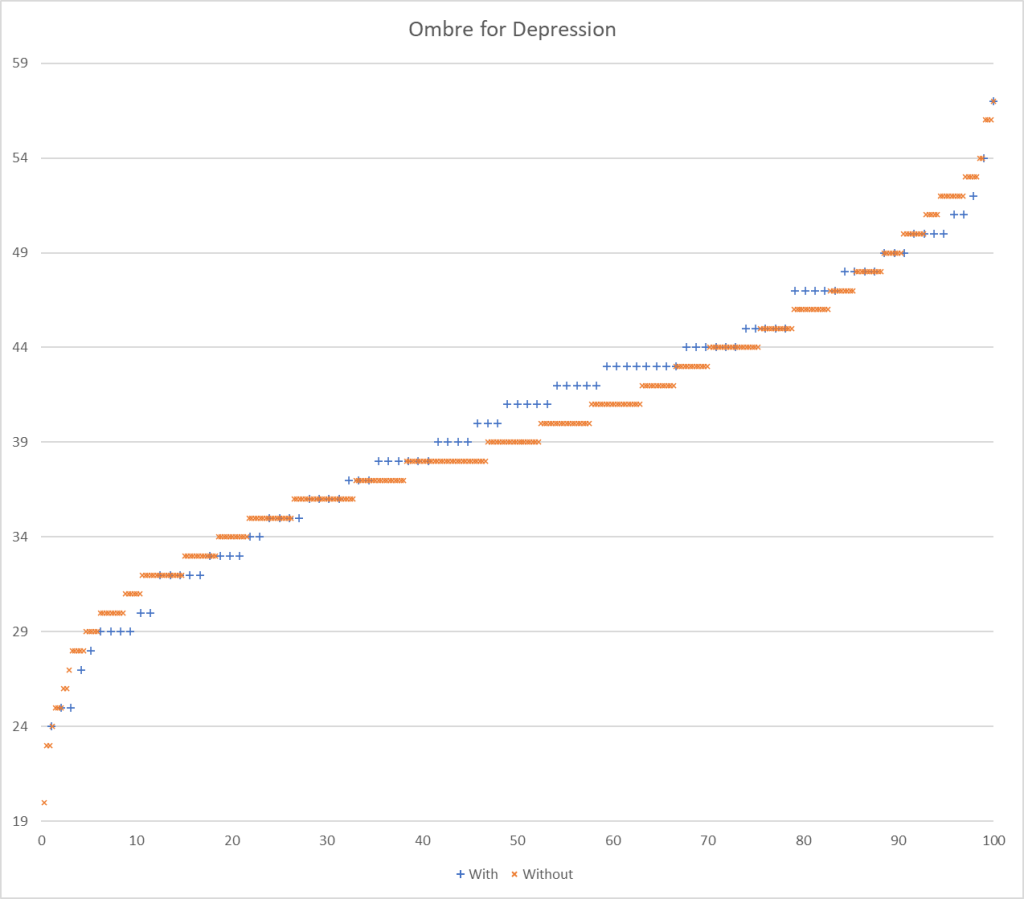
- Ombre Labs:
- 78 sampleswith depression,
- 340 samples without depression
The results blew me away! I give a possible explanation below.
| Percentile | With | Without | Ratio |
| 1 | 0.75 | 0.87 | 86% |
| 2 | 2.09 | 1.05 | 199% |
| 3 | 3.42 | 1.70 | 202% |
| 4 | 5.05 | 2.32 | 217% |
| 5 | 6.60 | 3.00 | 220% |
| 6 | 8.19 | 3.61 | 227% |
| 7 | 9.59 | 4.27 | 225% |
| 8 | 10.97 | 4.93 | 222% |
| 9 | 12.44 | 5.57 | 223% |
| 10 | 14.05 | 6.20 | 226% |
| 11 | 15.54 | 6.85 | 227% |
| 12 | 17.04 | 7.57 | 225% |
| 13 | 18.88 | 8.23 | 229% |
| 48 | 74.23 | 31.98 | 232% |
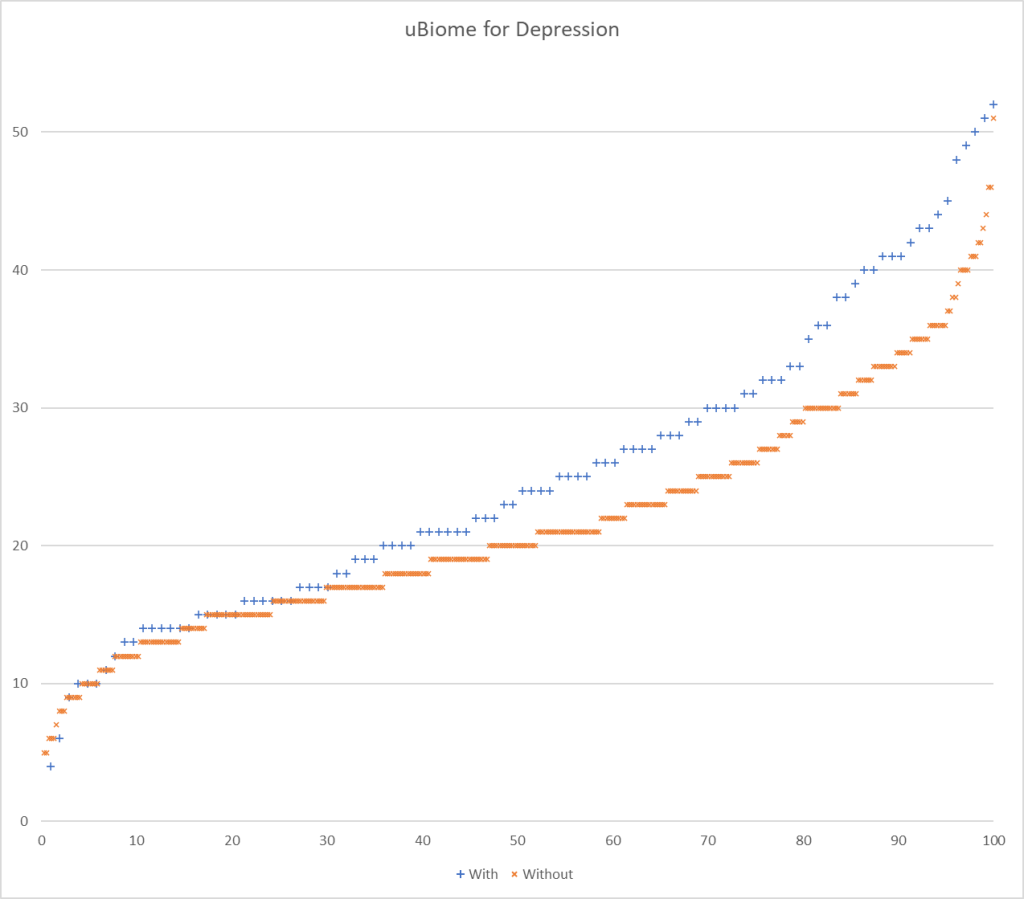
And going to the defunct uBiome:
- With: 103 Samples
- Without: 376 Samples
It looks like using 22%ile and 78%ile yields a 109% ration or better.
| Percentile | With | Without | Ratio |
| 1 | 1.75 | 1.32 | 132% |
| 2 | 3.09 | 2.06 | 150% |
| 3 | 4.30 | 2.89 | 149% |
| 4 | 5.30 | 3.73 | 142% |
| 5 | 6.32 | 4.64 | 136% |
| 6 | 7.17 | 5.59 | 128% |
| 7 | 8.20 | 6.48 | 127% |
| 8 | 9.32 | 7.37 | 126% |
| 9 | 10.35 | 8.30 | 125% |
| 10 | 11.19 | 9.20 | 122% |
| 11 | 12.17 | 10.18 | 119% |
| 12 | 13.12 | 11.11 | 118% |
| 13 | 14.13 | 12.01 | 118% |
| 14 | 15.14 | 12.91 | 117% |
| 15 | 16.13 | 13.83 | 117% |
| 16 | 16.97 | 14.76 | 115% |
| 17 | 17.82 | 15.74 | 113% |
| 18 | 18.76 | 16.63 | 113% |
| 19 | 19.64 | 17.52 | 112% |
| 20 | 20.43 | 18.45 | 111% |
| 21 | 21.36 | 19.44 | 110% |
| 22 | 22.16 | 20.35 | 109% |
| 23 | 23.00 | 21.28 | 108% |
| 24 | 24.00 | 22.31 | 108% |
| 25 | 24.93 | 23.24 | 107% |
| 26 | 25.92 | 24.18 | 107% |
Why does Ombre Labs blow away other Labs?
First, you need to understand the back story read The taxonomy nightmare before Christmas…[2019]. There is NO STANDARDIZATION. Different labs use different reference libraries. I would speculate that the reference libraries typically used for studies on the US National Library of Medicine is much closer to the reference libraries used by Ombre than those used by Biomesight.
It could be roughly compared to the studies using metric Bolts. Ombre nuts are metric (cm) and thus fit well. Biomesight nuts are imperial (inches), they do not fit as well, and on occasion may need to be forced. That is the likely nuts and bolts of it.
What does this mean for Predictions using PubMed Studies?
At the simplest level it means that my criteria for matching is different for each lab.
- High is over 60%ile and Low is under 40%ile for Ombre
- High is over 94%ile and Low is under 6%ile for Biomesight
- High is over 78%ile and Low is under 22%ile for uBiome
- Other labs: High is over 94%ile and Low is under 6%ile for Biomesight
We ended up with the same best to worst order for labs as predicted at the start — except the differences is a lot larger than I expected. It will likely take a week for me to modify the build processes and have numbers on Microbiome Prescription updated.
What about to Shotgun analysis (Thorne, Xenogene)? Answer is simple, we need a lot more samples from both of them.
Testing Discrimination Performance
I charted the with versus without depression for various labs below to see how strong the discrimination was. The charts are below with uBiome showing the best discrimination. At higher percentiles, ubiome is 3-4x more likely to detect depression over a not depression.
More work to do…
1 thought on “Predicting Conditions from PubMed Studies”
Comments are closed.