Back Story
Started feeling slightly tired in 2014, but I didn’t pay much attention to it. Around 2016 I am told the fatigue I am suffering from is likely caused by depression and so I take various SSRIS for 4 years. They made me anhedonic[inability to feel pleasure] and actually caused fatigue to somewhat worsen.
In 2022 after recovering from covid, I take aj immune boosting supplement to try and finally break free from the fatigue I was suffering. It actually worked and brought me back to life, which is when I decided ro come off my SSRI.
This was a mistake. It made me even more anhedonic and caused me to crash. I have not recovered since.
Lately, I have been dealing with actinic acid build up which is very weird for me as I was a professional athlete.
Analysis
This has been sitting in my backlog (waiting for feedback from reader). I just discovered that he has since done a second sample, so this is a revision and update.
Comparisons
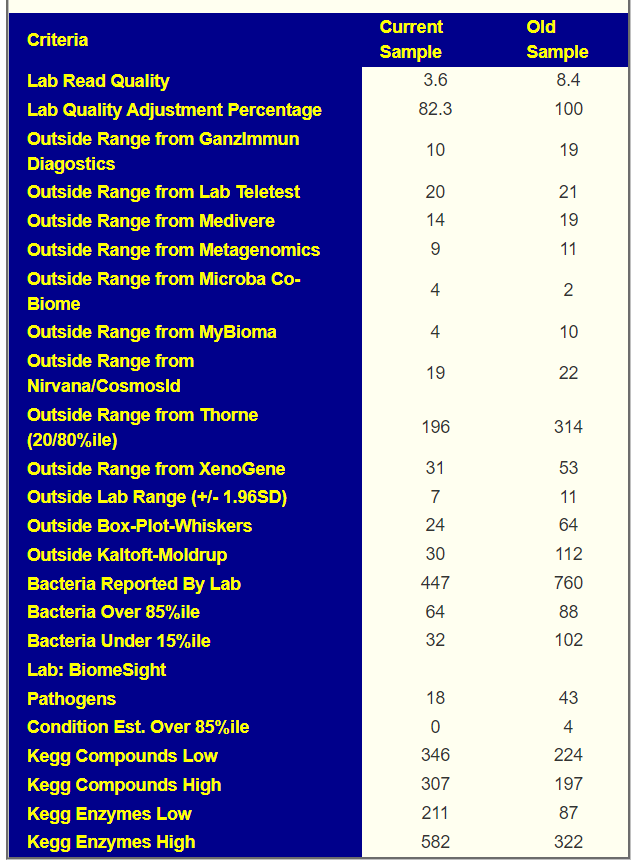
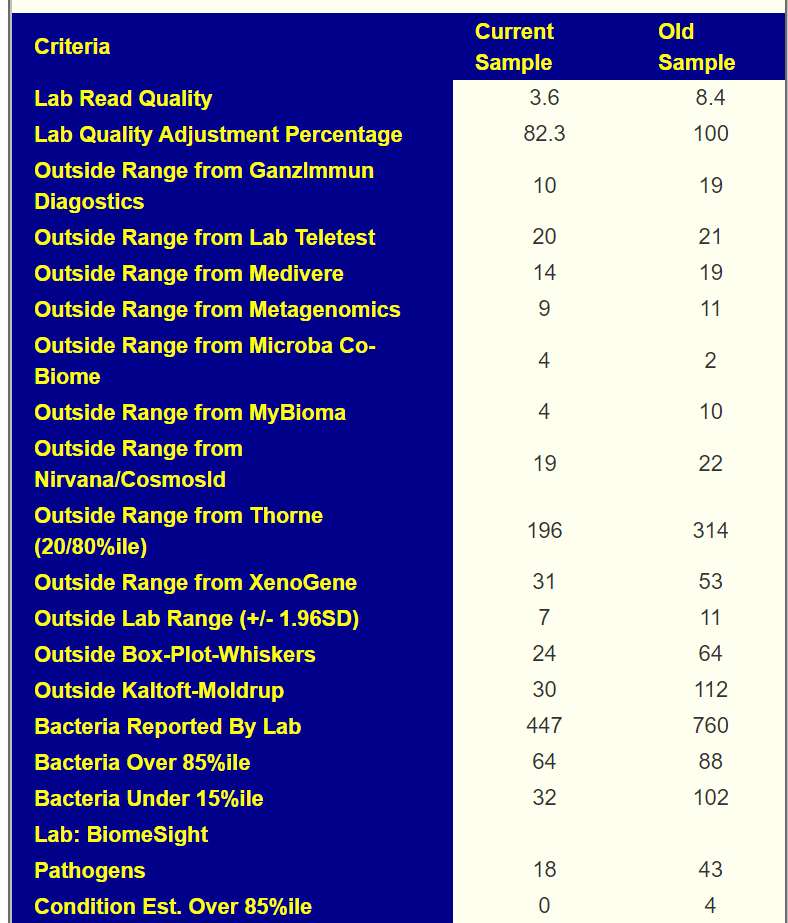
I do not know how many of the suggestions made in the earlier draft was done. Note that we went from 760 bacteria down to 447 (just 58%). So for most of the numbers below, we need to see at least a 50% drop in bacteria for something to be an improvement. Most of these measures failed to make this criteria.
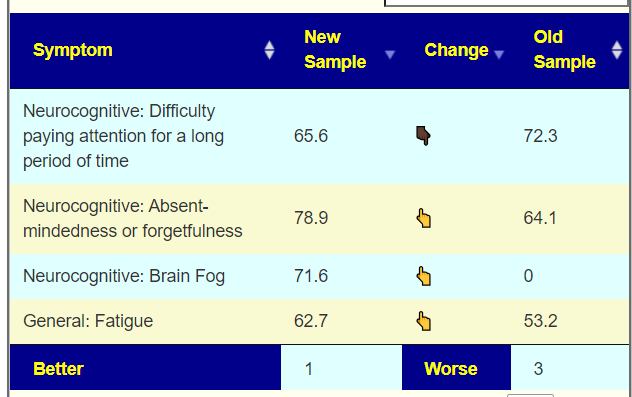
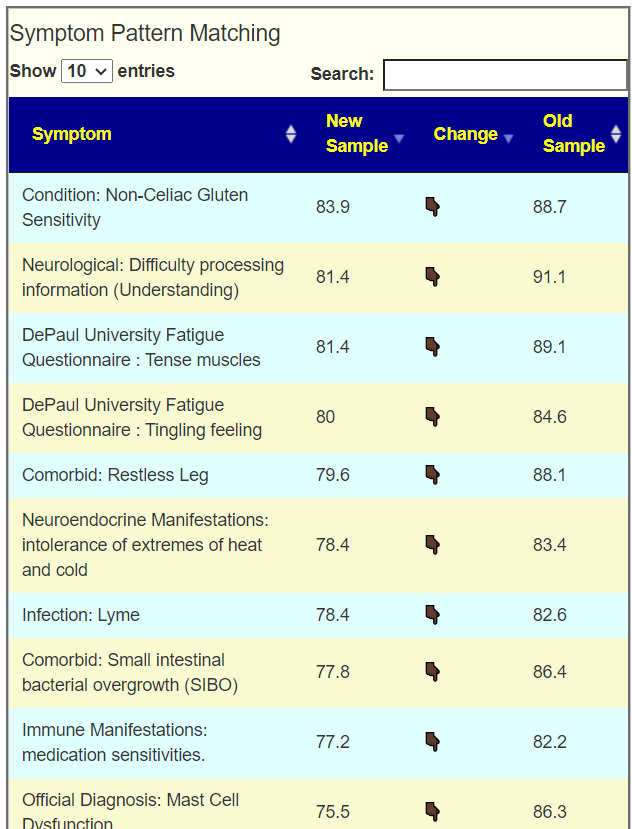
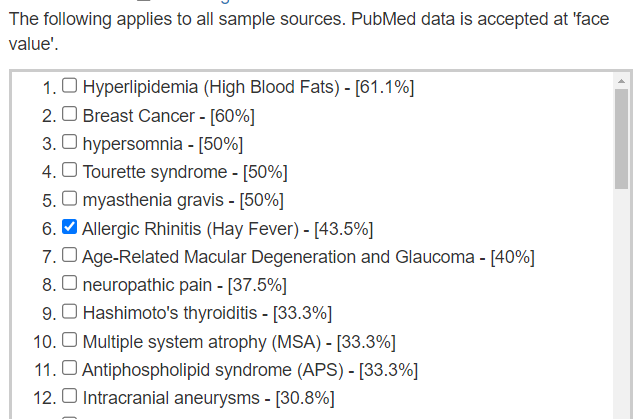
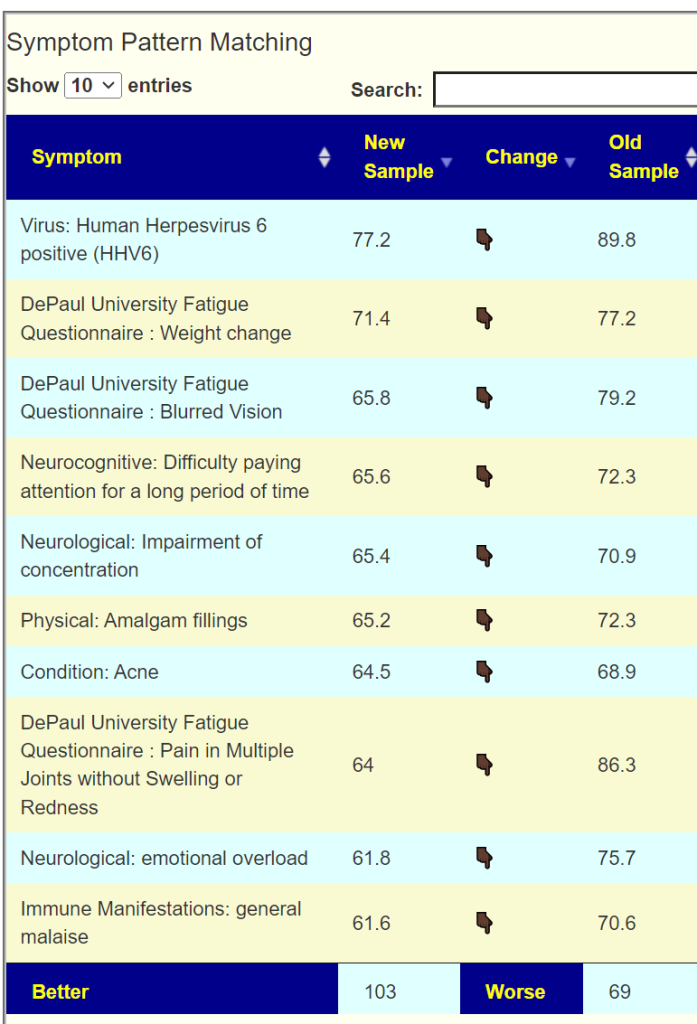
We have added a new comparison table of changes of fit to reported symptoms. This also show a general loss of ground.
With the new UI appearance, I am also trying to keep the analysis simple by not obfuscating with too many measures.
Going Forward
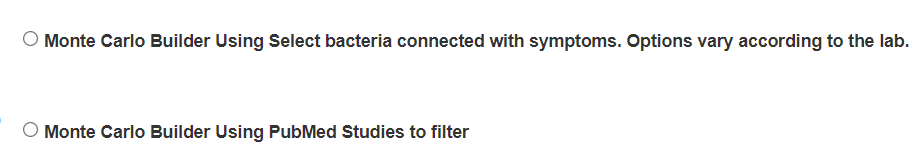
I am going to do [Beginner-Symptoms: Select bacteria connected with symptoms] and then [Probiotic computed from Kyoto Encyclopedia of Genes and Genomes compounds].
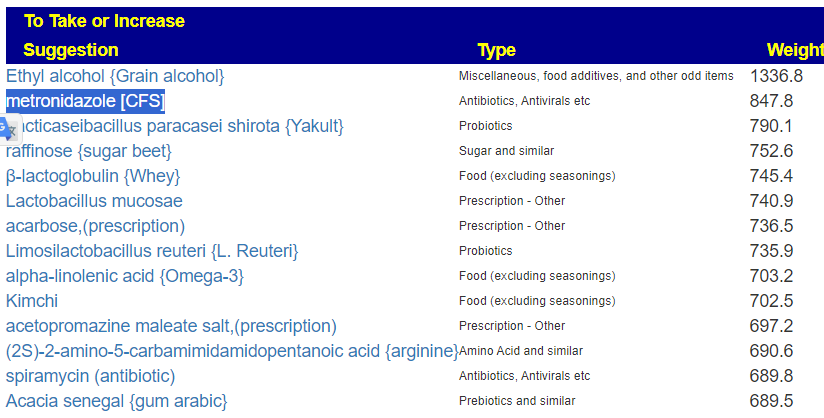
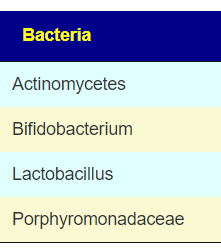
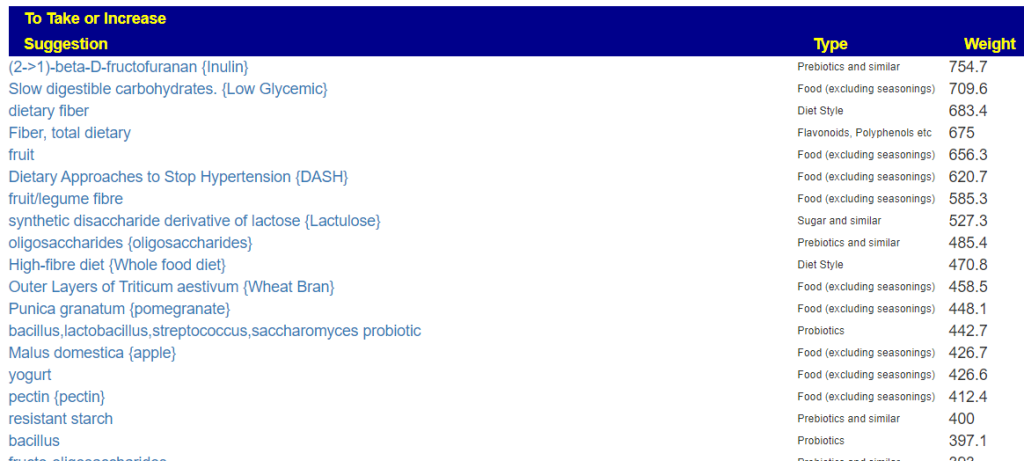
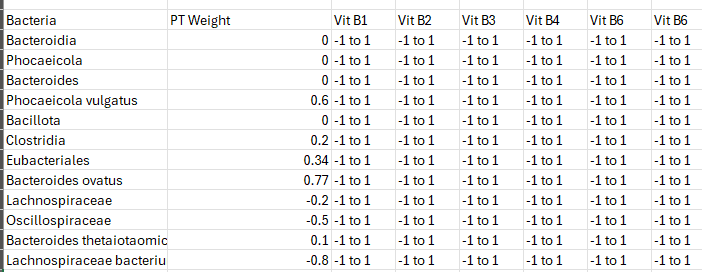
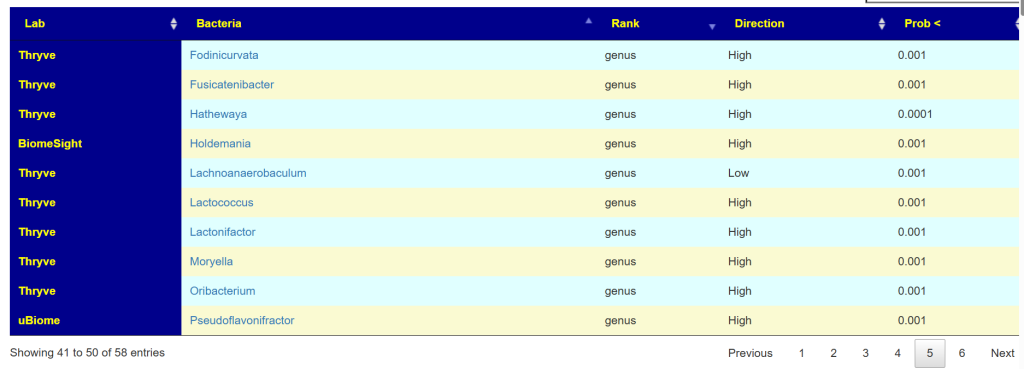
We ended up with 8 bacteria being selected. The top suggestions are shown below
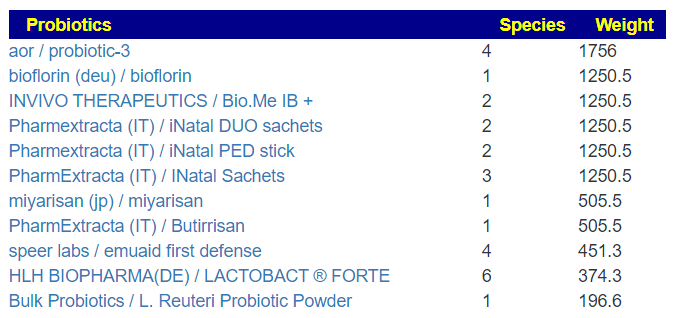
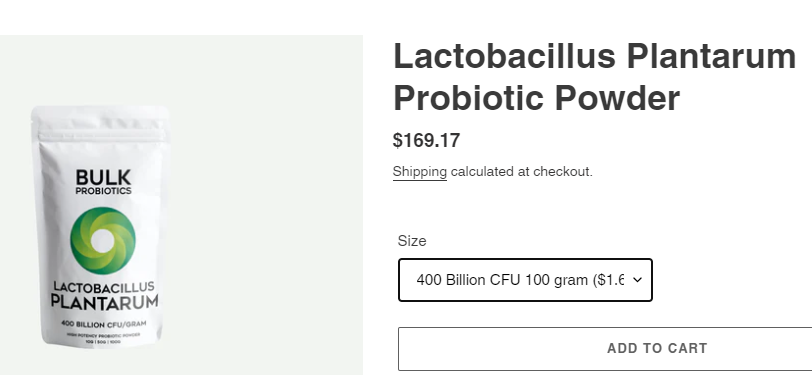
With best probiotics being: CustomProbiotics.com / L. Salivarius Probiotic Powder and Bulk Probiotics / L. Helveticus Probiotic Powder.
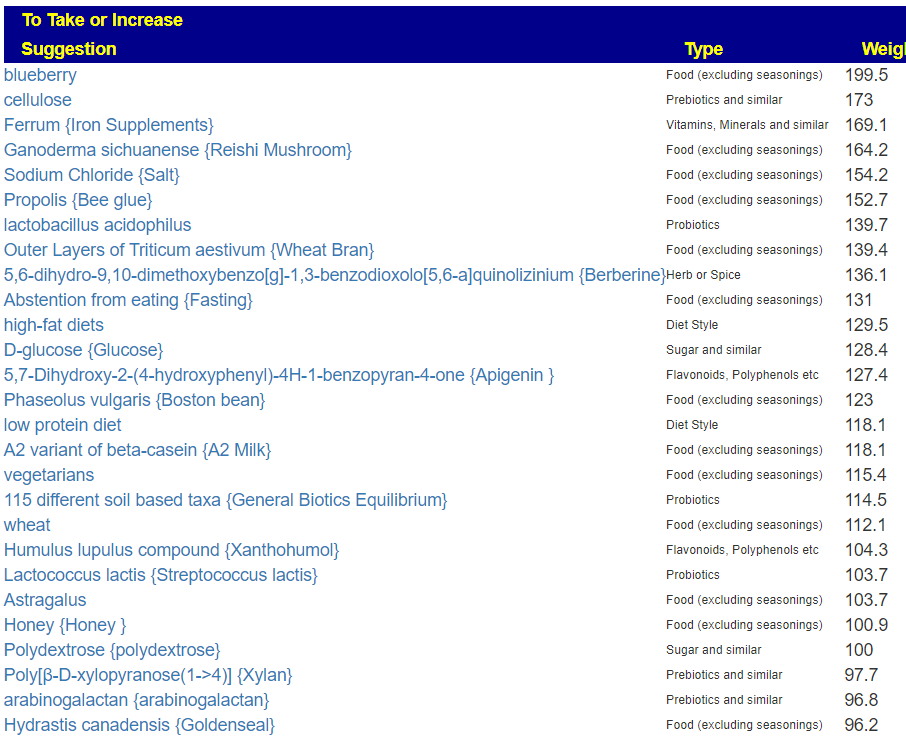
I decided to also try [Novice: Just tell me what to take or avoid] which increased the selected bacteria to 23. There are some similarities and differences (to be expected from the targeted bacteria increasing from 8 to 23)
The probiotics suggested were the same.
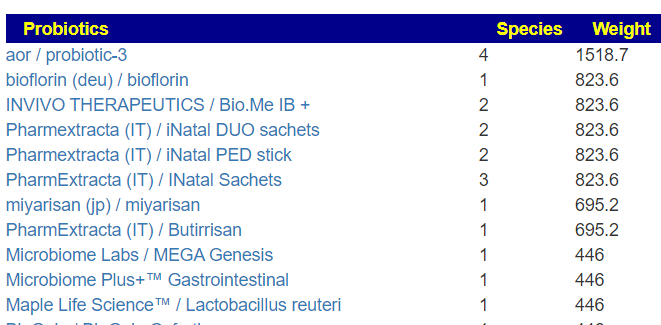
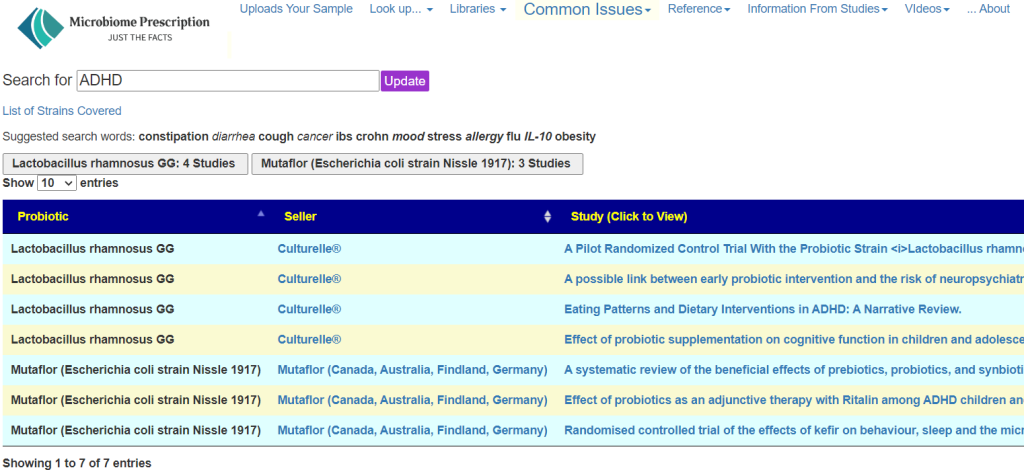
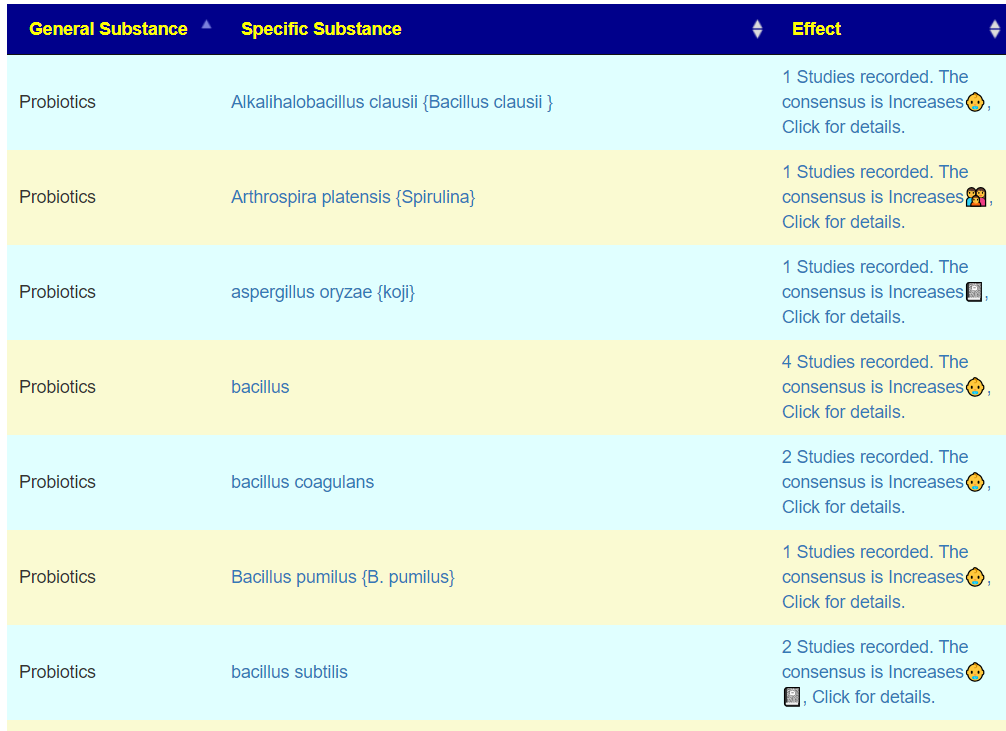
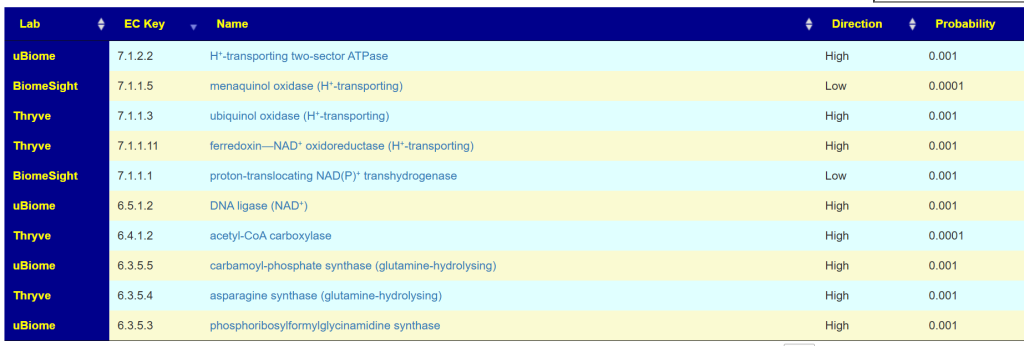
Going to KEGG Probiotics
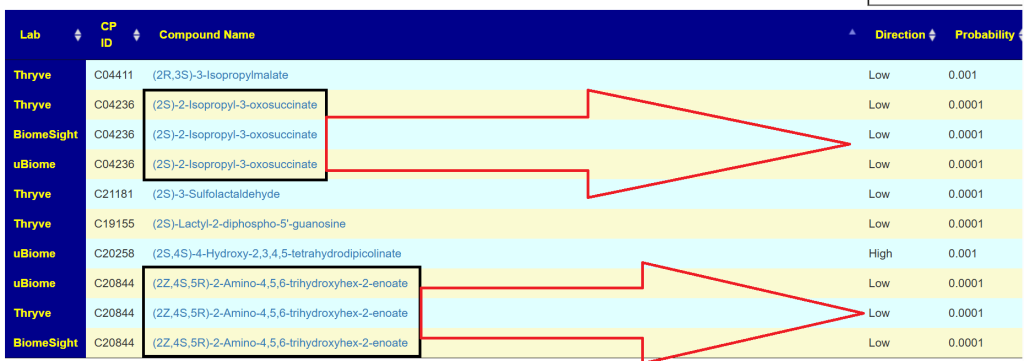
We have a very different list. One jumps out: E.Coli probiotics. The number is the number of low compounds that it increases.
Checking with the earlier suggestions we see
- CustomProbiotics.com / L. Salivarius Probiotic Powder is a 11
- Bulk Probiotics / L. Helveticus Probiotic Powder. is a 11
My Probiotics Bottom Line
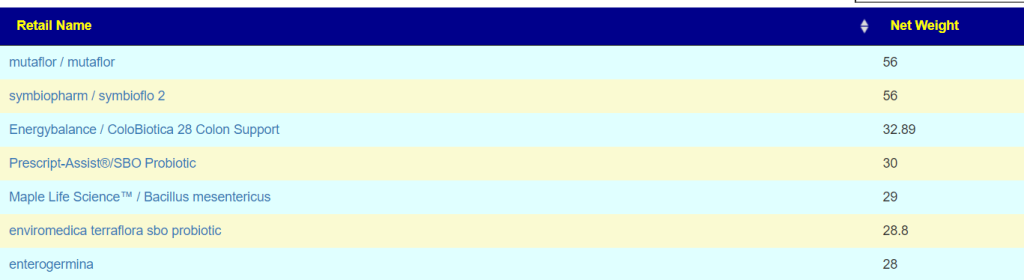
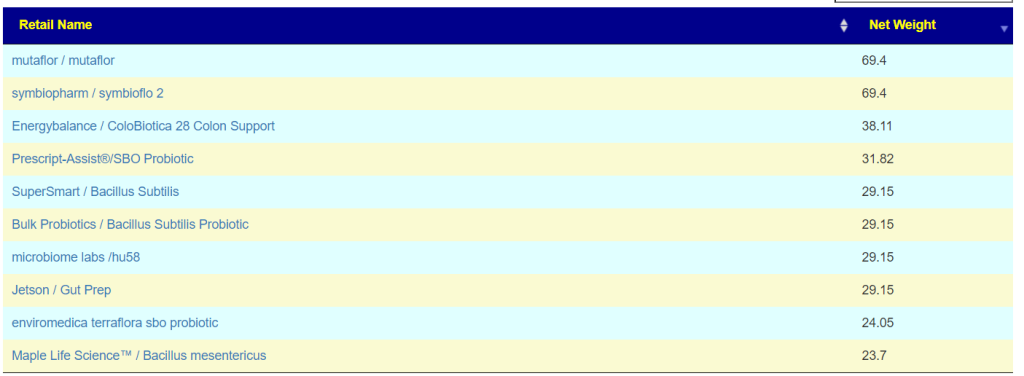
I would run with these 4 probiotics (taking each for one week and then rotating to the next)
- Mutaflor
- Prescript-Assist®/SBO Probiotic or Maple Life Science™ / Bacillus clausii
- L. Salivarius
- L. Helveticus
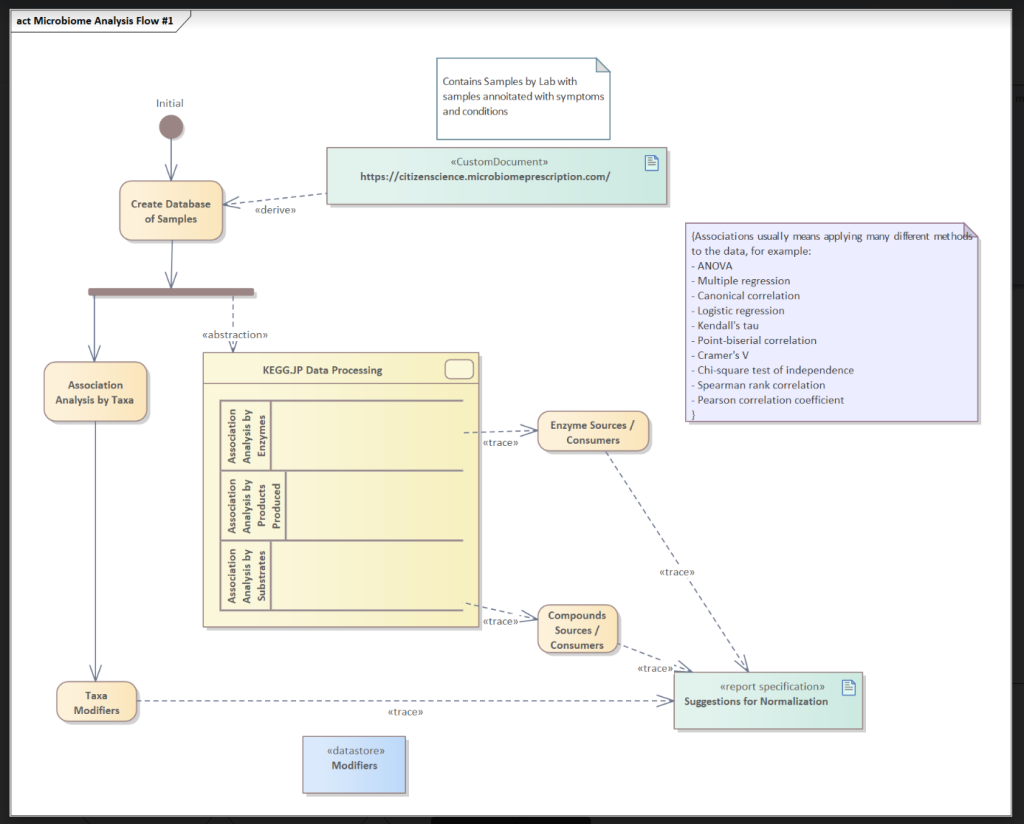
Why did I go with two from KEGG? The reason is simple — this is computed across the entire microbiome and does not depend on someone doing studies. The two other ones are based on published studies.
All of the above are typically deficient in samples (or assumed by some medical practitioners to be the cause of issues). This is not the case, and suggestions reflect this.
Items to Take
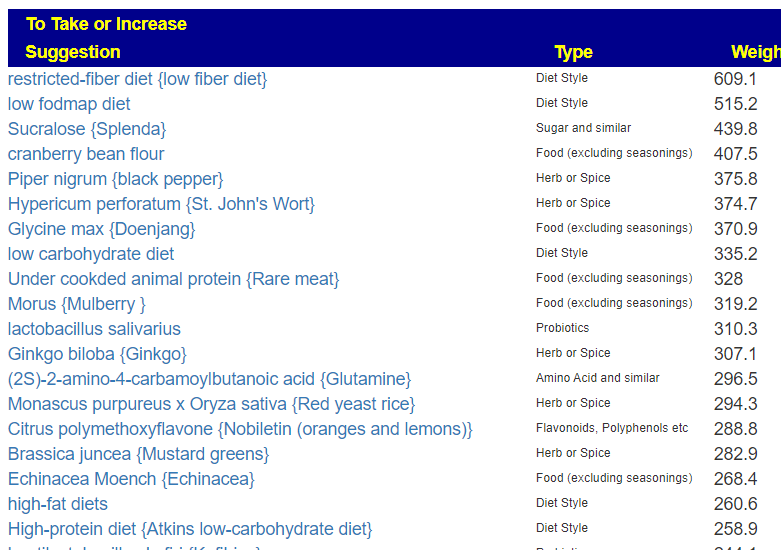
I would work off the two lists above – there is a reasonable amount of agreement. I note that fiber and high fiber foods are common on both of to-avoid list as is wheat, gluten (and bifidobacterium probiotics).
General Guidance
For items to take, remember that goal is to disrupt the dysbiosis. This means subjecting it to constantly changing “shocks” so it is unable to adapt. This has been shown to be effective when dealing with antibiotics (i.e. rotating between different antibiotics with breaks is more effective than taking the same antibiotic continuously). It likely applies to probiotics and herbs.
Postscript – and Reminder
I am not a licensed medical professional and there are strict laws where I live about “appearing to practice medicine”. I am safe when it is “academic models” and I keep to the language of science, especially statistics. I am not safe when the explanations have possible overtones of advising a patient instead of presenting data to be evaluated by a medical professional before implementing.
I cannot tell people what they should take or not take. I can inform people items that have better odds of improving their microbiome as a results on numeric calculations. I am a trained experienced statistician with appropriate degrees and professional memberships. All suggestions should be reviewed by your medical professional before starting.
The answers above describe my logic and thinking and is not intended to give advice to this person or any one. Always review with your knowledgeable medical professional.

Recent Comments