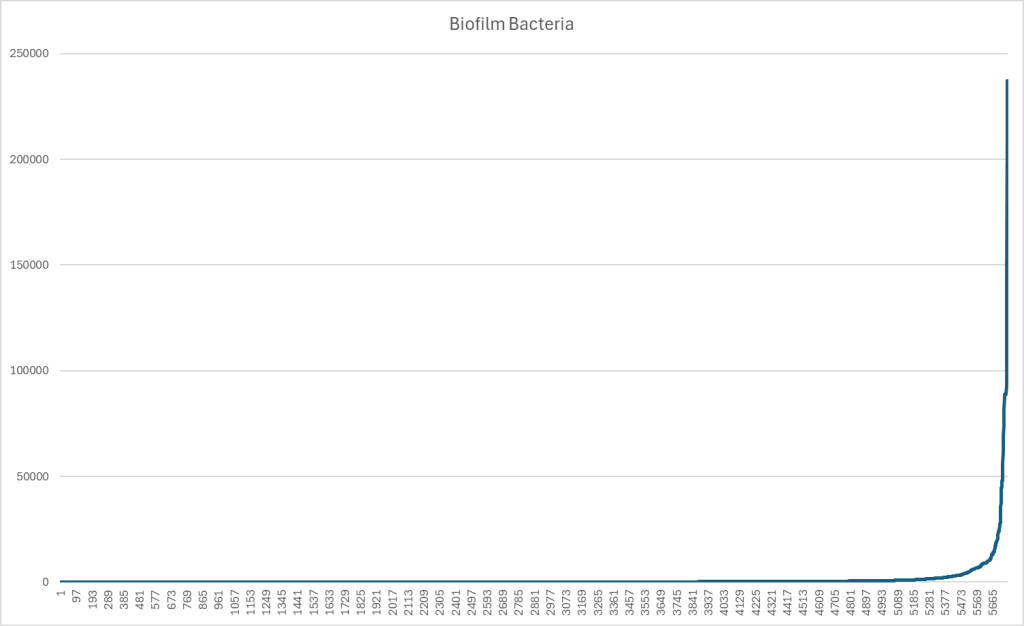
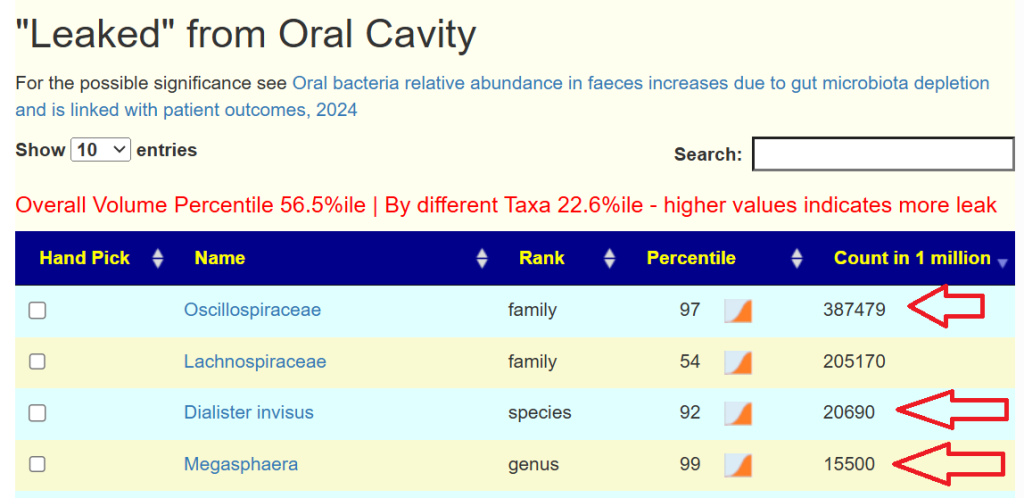
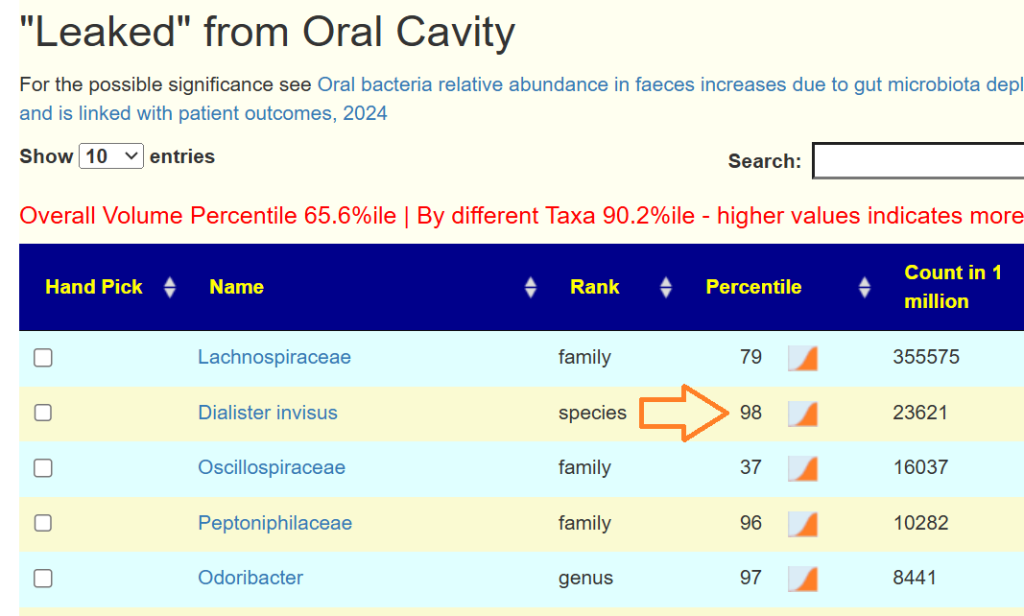
Today I was asked if the numbers shown on various sights like the one below, ” if this result is correlated with the severity of the patient?”. The answer is No. The usual reason that such numbers appear on sites is to satisfy customers asking for such numbers. Simple, easy to understand number.
Businesses want to make customers happy — so they literally cook-up a number to show on their reports. There is no research supporting any of the magical numbers that I have seen. Some one put together some numeric formula to generate the numbers.
For Biomesight, the logic is shown on the page with the right display
If you sum up the values for each dial, you get the total. When you view the percentage, it is not so obvious: 100%, 69%, 88%, 85% looks like a complex formula is being used.
Analogy: Give me a Health Measure for a Person
The microbiome is very much like a person. How would you create a single value for a person?
Probiotics –> Income
Commensals –> Savings
Pathobionts –> Debts
Diversity –> Health?
Married and marriage status
Chronic Conditions
Health Status
Height
Weight
Gender
etc
Would a person with no debt, good savings, a low income and married with 5 kids be a higher or lower measure than someone with moderate debt, high income, small savings and no relationships?
Are there any studies?
What about the ratios used in the literature?
Bacteroides/Bifidobacterium Ratio
Bacteroides/Clostridium Ratio
Blautia/Bacteroides Ratio
Firmicutes/Bacteroidetes Ratio
Prevotella/Bacteroides Ratio
Well, the sample that I am looking at have 43%ile, 98%ile, 7.2%ile, 58%ile and 19%ile. The numbers are all over the place!
Their latest study states: ” accuracy of 80% in distinguishing healthy (no disease) from non-healthy (diseased)” So 1 in five times, they will misclassify a healthy person as having a disease.
An example of the algorithm being used is below.
This is just trying to determine if the person is healthy or not — nothing about severity.
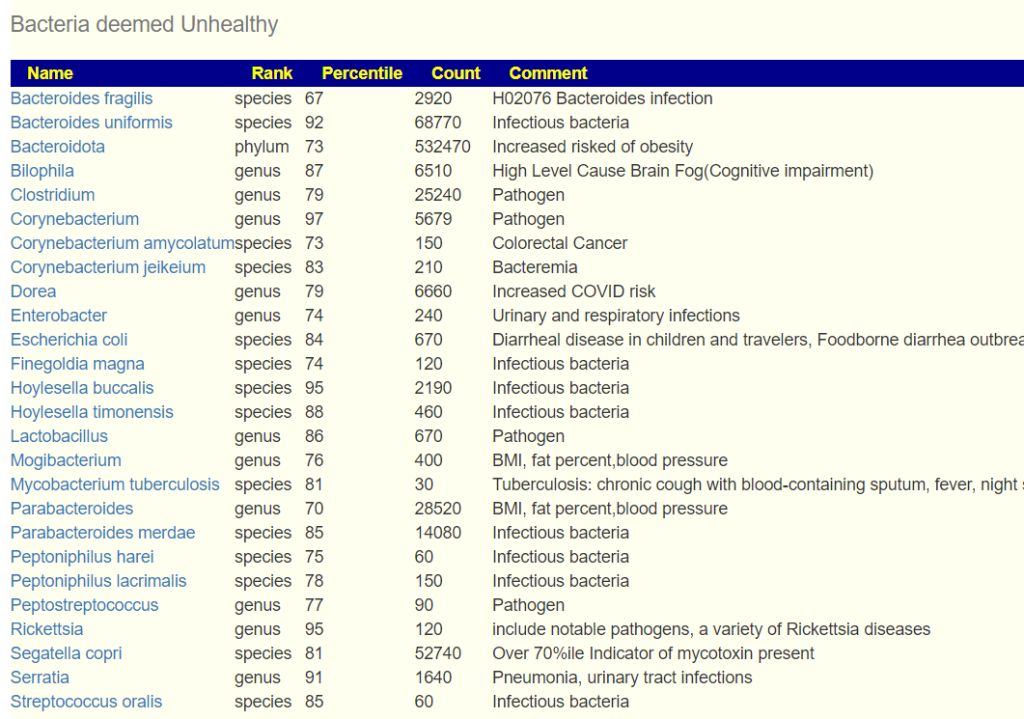
My approach is simple, I simply flagged the bacteria deemed to be unhealthy. Just list them.
Latest microbiome results are in. Seems like my microbiome is stubborn and stuck these last few tests. Wondering if I should just use this test suggestions exclusively or combine with my prior Thorne test
We have two sample – one via BiomeSight and one via Thorne. This post is going to do two things:
Look at Suggestions – by combining both sets of suggestions using the Uber Consensus
Look at the differences between the reports.
We also review “which is better”. My focus is clinical application to individuals — not research papers; answer at bottom.
Uber Consensus
The process has become very simple — “Just give me Suggestions!” on both samples and then going to uber consensus as illustrated by the video below.
The result was excellent agreement on suggestion between each set of results. The CSV files are attached below.
Items less than 100 should be ignored (accuracy of measurement limits). There are a few dramatic differences.
Bacteria Name
Thorne Count
BiomeSight Count
Firmicutes
396799
529540
Actinobacteria
60610
2100
Bacteroidetes
461289
448230
Proteobacteria
6095
18150
Chlorobi
36
429
Acidobacteria
35
100
Cyanobacteria
83
20
Spirochaetes
85
30
Verrucomicrobia
59
10
Chloroflexi
77
50
Tenericutes
54
30
Deinococcus-Thermus
48
30
Fibrobacteres
4
10
Synergistetes
17
20
By Count
Looking at Percentiles next
Bacteria Name
Thorne %ile
BiomeSight %ile
Chlorobi
25
84
Actinobacteria
85
33
Acidobacteria
34
81
Spirochaetes
81
36
Cyanobacteria
31
1
Deinococcus-Thermus
55
29
Firmicutes
14
37
Chloroflexi
67
50
Verrucomicrobia
14
1
Tenericutes
13
2
Proteobacteria
10
18
Synergistetes
6
4
Bacteroidetes
55
56
Fibrobacteres
1
0
By Percentile ranking
We have Bacteroidetes in agreement with both — but for the rest…
At the genus level
Bacteria Name
Thorne Count
BiomeSight Count
Bacteroides
180054
397640
Blautia
16470
107220
Roseburia
16793
73640
Faecalibacterium
109196
152890
Corynebacterium
43413
820
Ruminococcus
9177
44170
Phocaeicola
223209
199669
Parabacteroides
11855
31940
Phascolarctobacterium
6101
23980
Dorea
36
13000
Sutterella
16
11339
Oscillospira
0
8250
Coprococcus
6120
12589
Eggerthella
6491
760
Pseudobutyrivibrio
149
5790
Lachnospira
11593
6230
Prevotella
954
4260
Anaerostipes
9303
6310
Clostridium
2039
4960
Pedobacter
46
2410
Odoribacter
4077
2060
Bifidobacterium
2783
1019
Escherichia
75
1610
Porphyromonas
1372
150
Mediterraneibacter
14831
13629
Bilophila
6
1110
Veillonella
75
1160
Desulfovibrio
1900
1250
Streptococcus
1477
840
Acetivibrio
33
470
Chlorobaculum
6
429
Finegoldia
1339
920
Gemella
17
400
Enterococcus
585
220
Paenibacillus
376
20
Mogibacterium
39
370
Acetobacterium
15
340
Serratia
47
350
Eubacterium
517
240
Megasphaera
35
290
Selenomonas
52
290
Bacillus
248
10
Caldicellulosiruptor
11
240
Campylobacter
235
10
Slackia
16
240
Sphingobacterium
48
270
Caloramator
10
190
Staphylococcus
181
10
Hathewaya
8
170
Peptoniphilus
656
800
Peptostreptococcus
6
150
Microbacterium
125
10
Adlercreutzia
525
620
Rhodothermus
6
90
Erysipelothrix
12
90
Acidaminococcus
12
90
Hymenobacter
80
10
Negativicoccus
115
50
Collinsella
74
10
Rhodococcus
67
10
Dialister
25
80
Anaerococcus
336
390
Pseudoclostridium
8
60
Moorella
9
60
Vibrio
60
10
Caldilinea
1
50
Brochothrix
2
50
Mycobacterium
67
20
Neisseria
57
10
Pectinatus
7
50
Thermoclostridium
16
50
Alkaliphilus
9
40
Shewanella
31
60
Lactobacillus
57
30
Leptospira
4
30
Deinococcus
35
10
Tetragenococcus
5
30
Ethanoligenens
34
10
Weissella
10
30
Gulosibacter
1
20
Pseudoclavibacter
2
20
Kocuria
28
10
Meiothermus
2
20
Stenotrophomonas
28
10
Symbiobacterium
3
20
Devosia
4
20
Dysgonomonas
34
20
Azoarcus
21
10
Leuconostoc
9
20
Glaciecola
1
10
Turicibacter
21
30
Pelotomaculum
1
10
Parascardovia
2
10
Lentibacillus
2
10
Actinopolyspora
2
10
Kitasatospora
2
10
MLOs
3
10
Ochrobactrum
3
10
Rickettsia
3
10
Luteibacter
3
10
Fibrobacter
4
10
Pediococcus
14
20
Halanaerobium
6
10
Dyadobacter
14
10
Mycoplasma
17
20
Thauera
9
10
Lysobacter
11
10
By Counts
Looking at the percentile rankings — the absolute numbers may vary greatly, but what about relative percentiles?
Bacteria Name
Thorne %ile
Biomesight %ile
Ochrobactrum
2
2
Actinopolyspora
1
1
Halanaerobium
1
1
MLOs
1
1
Glaciecola
1
1
Lentibacillus
1
1
Pelotomaculum
1
1
Parascardovia
1
1
Luteibacter
1
1
Phocaeicola
89
89
Rickettsia
1
0
Pediococcus
10
9
Fibrobacter
2
0
Mycoplasma
5
3
Alkaliphilus
1
3
Finegoldia
85
88
Kitasatospora
3
0
Thauera
5
1
Streptococcus
55
50
Turicibacter
12
17
Peptoniphilus
64
58
Hathewaya
1
8
Clostridium
18
11
Desulfovibrio
61
69
Eubacterium
38
46
Symbiobacterium
1
9
Enterococcus
88
79
Sphingobacterium
13
23
Pseudoclavibacter
1
11
Anaerococcus
72
83
Eggerthella
98
86
Gulosibacter
0
12
Lactobacillus
23
11
Bifidobacterium
55
43
Leuconostoc
2
14
Shewanella
35
47
Prevotella
50
63
Corynebacterium
99
86
Collinsella
13
0
Oscillospira
0
16
Faecalibacterium
49
65
Meiothermus
1
17
Caloramator
1
19
Coprococcus
39
57
Lysobacter
18
0
Odoribacter
81
63
Adlercreutzia
63
81
Pedobacter
13
31
Dyadobacter
20
1
Dysgonomonas
24
4
Mediterraneibacter
69
90
Devosia
1
22
Acetivibrio
5
27
Thermoclostridium
9
32
Ethanoligenens
25
1
Dialister
11
35
Veillonella
16
41
Pectinatus
1
27
Porphyromonas
88
62
Moorella
1
28
Negativicoccus
66
39
Lachnospira
51
21
Rhodothermus
1
32
Tetragenococcus
1
32
Acetobacterium
3
34
Anaerostipes
65
96
Bilophila
1
33
Ruminococcus
14
47
Weissella
2
35
Parabacteroides
42
75
Acidaminococcus
4
39
Pseudoclostridium
1
37
Leptospira
1
42
Serratia
34
75
Slackia
4
45
Phascolarctobacterium
56
97
Erysipelothrix
4
46
Sutterella
1
46
Bacteroides
39
87
Roseburia
43
91
Escherichia
28
77
Selenomonas
21
73
Deinococcus
54
1
Megasphaera
18
72
Brochothrix
1
56
Kocuria
58
2
Mogibacterium
17
74
Stenotrophomonas
63
3
Azoarcus
61
0
Caldilinea
0
61
Caldicellulosiruptor
2
64
Mycobacterium
87
24
Hymenobacter
68
1
Blautia
5
73
Paenibacillus
87
19
Neisseria
69
0
Pseudobutyrivibrio
25
95
Campylobacter
75
1
Gemella
4
82
Peptostreptococcus
1
81
Chlorobaculum
1
84
Staphylococcus
85
0
Vibrio
91
2
Bacillus
92
1
Rhodococcus
91
0
Dorea
1
93
Microbacterium
94
1
By Percentile
Bottom Line
I have never had much belief in the absolute accuracy of the bacteria named or the count. Why? Simple, I understand the statistical process being used and its weakness. I will leave arguments over “which is better” and “which is accurate” to others.
My focus and concern is to improve the microbiome. With sparse data and the great complexity involved, I am actually very pleased that the suggestions are in agreement. The suggestions are computed using fuzzy logic expert systems. The noise in the data and the statistical processes involved seem to be smoothed out by this Artificial Intelligence engine approach.
Score: Labs: -2, Microbiome Prescription 2
Which is better?. My focus is clinical application to individuals, both give similar suggestions using the Fuzzy Logic Expert System. There is no difference in that sense.
I have been doing periodic review of this person’s sample. He just got his latest results and it was a shocker (of the wrong type!). This is worth a review.
Comparing Samples Overtime
At the typical analysis level there has been no change in these broad criteria since the last sample:
Outside Range from JasonH
Outside Range from Medivere
Outside Range from Metagenomics
Outside Range from MyBioma
Outside Range from Nirvana/CosmosId
Outside Range from XenoGene
Why compare over 90%ile to under 10%ile? The reason is probability – we are converting the data to a uniform distribution for all of the bacteria. This allows for reliable statistical significance to be determined for all of the bacteria. If things are “normal” then the ratio should be 1.0 The further from 1, the more abnormal. This is independent of any assumptions on bacteria distributions.
Looking at over 90% and under 10%, our expected count are 64 for both (10% of 639)
We have 20 over 90%ile, so we have under representation of dominant
We have 273 under 10%ile, the typical over representation of low levels of many bacteria seenwith most ME/CFS people
The ratios is higher at 13.7 compare to prior ratios (8.2, 11,3,3,6.5)
Where we see differences
Outside Kaltoft-Moldrup count returned to the size of the very first sample.
Compounds over 90%ile to under 10%ile (which should be 1.0 theoretically) had been close to 1.0 on the prior 3 samples, jumped up to 8.8:1. This was not as bad as the first sample with a 12.9:1 ration.
Enzymes over 90%ile to under 10%ile, continue to be bias towards low with a 2.7:1 ratio (prior 3.5, 1.7, 2.9, 3.2)
Conditions: jumped from none over 90%ile to 13!
My general impression is that ground has been lost. This is the first time that subsequent results appear to be worse. WHAT HAPPENED!???!!???!!!
Criteria
2/22/2022
8/11/2022
3/25/2022
12/3/2021
8/31/2021
Lab Read Quality
9.7
5.5
6.2
3.6
7.8
Bacteria Reported By Lab
639
461
593
445
551
Bacteria Over 99%ile
4
3
3
5
15
Bacteria Over 95%ile
11
13
11
24
23
Bacteria Over 90%ile
20
23
21
40
35
Bacteria Under 10%ile
273
189
237
123
227
Bacteria Under 5%ile
219
107
143
66
192
Bacteria Under 1%ile
175
23
44
9
167
Lab: BiomeSight
Rarely Seen 1%
6
7
14
2
3
Rarely Seen 5%
22
14
33
7
9
Pathogens
37
32
46
31
38
Outside Range from JasonH
7
7
4
4
6
Outside Range from Medivere
15
15
15
15
19
Outside Range from Metagenomics
8
8
6
6
7
Outside Range from MyBioma
7
7
7
7
8
Outside Range from Nirvana/CosmosId
23
23
18
18
21
Outside Range from XenoGene
32
32
36
36
39
Outside Lab Range (+/- 1.96SD)
7
8
6
9
14
Outside Box-Plot-Whiskers
38
33
38
58
41
Outside Kaltoft-Moldrup
210
111
123
100
211
Condition Est. Over 99%ile
5
0
0
0
7
Condition Est. Over 95%ile
9
0
0
0
15
Condition Est. Over 90%ile
13
0
0
0
29
Enzymes Over 99%ile
35
10
30
19
72
Enzymes Over 95%ile
100
68
219
82
162
Enzymes Over 90%ile
191
183
296
126
192
Enzymes Under 10%ile
520
645
514
369
616
Enzymes Under 5%ile
375
423
264
186
450
Enzymes Under 1%ile
219
86
49
37
272
Compounds Over 99%ile
23
47
62
28
44
Compounds Over 95%ile
72
254
231
127
86
Compounds Over 90%ile
126
338
298
307
98
Compounds Under 10%ile
1104
308
297
227
1265
Compounds Under 5%ile
1068
173
224
111
1241
Compounds Under 1%ile
1045
65
67
47
1206
What Happened?
This person sent the following notes
I’ve got COVID in October, I feel as I have fully recovered.
I have a little bit more energy than before.
My body feels extremely stressed, I have started to get a pressure over the neck / thyroid when I get totally stressed out.
My sleep is much better. I have been following Andrew Hubermans protocol for sleep, which had a great impact on me.
Would be great if I could get some recommendations for food, supplements, antibiotics etc.
Ah, the person feels like he has recovered but his microbiome is still recovering. We have a clean explanation for the regression! Our goal is now to try to stop Long COVID from setting in.
The Conditions matches include: hypercholesterolemia (High Cholesterol), Hyperlipidemia (High Blood Fats), Hypertension (High Blood Pressure, Nonalcoholic Fatty Liver Disease (nafld) Nonalcoholic and Atherosclerosis. None of those are concerning –they were not matches last time and thus should be viewed as transient red herrings. Looking at PUBMED Long COVID explicitly, we see good news: Long COVID (29 %ile) 37 of 212. However when we go over to Special Studies, the very top one is
41 % matchCOVID19 (Long Hauler), the next match was 21% –this really sticks out!
All Prior samples also had Long Hauler at the top too.
Going Forward
To build our consensus, we will do the usual and toss in our top Special Studies one.
Given the general hostility between lactobacillus and E.Coli, plus the risk or lactic acid issue with lactobacillus, I would suggest avoiding lactobacillus casei initially, perhaps try it in a later cycle. A similar contradiction happened with different forms of cranberry as shown below. We want absolutely clean positive choices.
I reran the suggestions with everything — in case any prescription items may be of special interest.
The top antibiotics included:
rifaximin (antibiotic)s “Xifaxin has been used with success to rebalance gut flora and relieve gut symptoms in chronic fatigue syndrome, IBS, inflammatory bowel disorder and others.” [Src]
ofloxacin (antibiotic)s – a quinolone antibiotics, this class. NOT RECOMMENDED — while used with some success [ME Association], this class of antibiotics is known to cause some persistent/permanent side effects
As always, I prefer the Cecile Jadin approach of taking a single course, take a break and then take a different antibiotics.
I personally have always love Liver pâté! There was something that always felt so good after eating. Liverwurst is essentially the same food.
So for a Scandinavian, this is almost going to a church social!! Liver pâté on Dark 100% Rye bread with Jarlsberg cheese also on Dark 100% Rye bread!
Postscript – and Reminder
I am not a licensed medical professional and there are strict laws where I live about “appearing to practice medicine”. I am safe when it is “academic models” and I keep to the language of science, especially statistics. I am not safe when the explanations have possible overtones of advising a patient instead of presenting data to be evaluated by a medical professional before implementing.
I can compute items to take, those computations do not provide information on rotations etc.
I cannot tell people what they should take or not take. I can inform people items that have better odds of improving their microbiome as a results on numeric calculations. I am a trained experienced statistician with appropriate degrees and professional memberships. All suggestions should be reviewed by your medical professional before starting.
The answers above describe my logic and thinking and is not intended to give advice to this person or any one. Always review with your knowledgeable medical professional.
This post started out with a title of “Post-Acute COVID-19 Syndrome vs Myalgic Encephalomyelitis – Similarities and Differences“. It scope was pretty obvious — compare microbiome shifts from these two sibling conditions. Expectations was a bland informational review.
The result was calling into question the typical assumption that we could isolate symptoms and conditions to specific bacteria. I follow the statistics and discovered that you can get a magnitude better statistical significance by moving beyond bacteria. In coming weeks, I hope to code up suggestions AI based on this enlightenment.
My starting point
In my last post, Long COVID – an update, I did a comparison between the citizen science data and the literature published on the US Library of Medicine. In terms of symptoms, these two appear the same — but at the microbiome (and enzyme levels) how similar are they?
Post-Acute COVID-19 Syndrome (PCAS), also known as Long COVID
Myalgic Encephalomyelitis (ME), also known as Chronic Fatigue Syndrome (CFS)
One frustrating aspect of many studies on the US Library of Medicine for many conditions is simple: results are not replicated in subsequent studies for the same condition. Historically I have viewed this as a result of different equipment and different reference libraries. In many cases the bacteria deemed significant are often different and when they did report the same bacteria, they report opposite shifts!
This post explores some of these issues, and came to an interesting conclusion.
Study Caveats
The studies on the US Library of Medicine compare people with the condition to healthy controls. With the citizen science data that is almost impossible to do. If a person has gotten a microbiome test, they likely have some condition(s) and thus are not healthy controls!!
This is not all bad. It means that when we find things that are statistically significant they are differentiators against other people with microbiome issues. That is, how are people with ME different than people with FM and IBS. Conceptually, we are more likely to identify the key features for these conditions and not key features for auto-immune conditions or a gut disturbance in general. It is a nuisance difference, but may be a very important nuisance.
Comparison that we will review are from:
US Pubmed — bacteria reported by both with direction
KEGG Enzymes shifts from Citizen Science (using only Biomesight data)
Bacteria shifts from Citizen Science (using only Biomesight data)
For citizen science we may have many uploaded samples annotated both with PCAS and ME. To resolve this conflict, ME will contain only samples with ME and without PCAS. Both ME and PCAS have many, many comorbid symptoms which may also come into play. Many of the pure ME samples are before COVID swept the world, hence relatively clean. PCAS are more recent samples.
For PACS citizen science data, we have only significance difference identified from Biomesight data, hence we will compare those only.
Scope
ME
PACS
Same
US National Library of Medicine
68
233
25
Enzymes – Citizen Science with p < 0.001
228
199
31
Bacteria – Citizen Science
109
36
0
Entities reported as significant or found significant
I must admit that finding no bacteria in common with the same lab and the same reference library was a little bit of a surprise. One explanation is that microbiome dysfunctions evolve over time. People with PACS have had it less then 3 years, likely an average of just 1 year. People with ME has had it often for 30+ years. Comparing the two may be similar to comparing a one bottle of grape juice to a bottle of vintage wine.
Details for Common Bacteria from US National Library of Medicine
In the table below: H indicates High, L indicates Low.
Note that Bacteroides are reported high and low in different studies, suggesting there are subsets of each condition
tax_rank
tax_Name
Direction
class
Bacteroidia
H
family
Bacteroidaceae
H
family
Clostridiaceae
H
family
Lachnospiraceae
L
genus
Anaerostipes
L
genus
Bacteroides
H
genus
Bacteroides
L
genus
Bifidobacterium
L
genus
Coprobacillus
H
genus
Coprococcus
L
genus
Dorea
L
genus
Eggerthella
H
genus
Enterococcus
H
genus
Faecalibacterium
L
genus
Lactobacillus
L
genus
Streptococcus
H
genus
Turicibacter
H
order
Eubacteriales
L
phylum
Bacteroidetes
H
phylum
Firmicutes
L
phylum
Fusobacteria
H
species
Anaerobutyricum hallii
L
species
Enterocloster bolteae
H
species
Faecalibacterium prausnitzii
L
species
Ruminococcus gnavus
H
From https://microbiomeprescription.com/Library/PubMed
Details for Shared Enzymes with p < 0.001
In recent posts for conditions comorbid with ME, PACS, I found that enzyme analysis had greater statistical significance than bacteria. All of these posts reported higher enzyme levels were significant with these conditions.
The result for items shared that had p < 0.001 was almost overwhelming!
One of them caught my eye, heparin-sulfate lyase, because micro-clots and “thick blood” are associated with these conditions with good results reported from the use of heparin for some patients.
HSGAGs are widely distributed on the cell surface and extracellular cell matrix of virtually every mammalian cell type and play critical role in regulating numerous functions of blood vessel wall, blood coagulation, inflammation response and cell differentiation.
This blew me away — we have over 150 people with PCAS and over 250 with ME giving us superior sample sizes. We have 145 bacteria deemed significant for one or the other. We had NONE that was in common. This gut punch gives two main options: denial and look for an excuse to disregard. or roll with the punch and roll with enzymes.
Bottom Line
The enzyme aspect is the strongest association between PACS and ME. The count is higher, but more important, we are dealing with p < 0.001 data making false positives unlikely. This leads to a model that there is no ‘magical list of bacteria involved’ but a diverse array of bacteria that may be different for each person — but united in the over production of enzymes. This shifts the microscope of research into a different light spectrum. This is very interesting and may require some new brain cells to be used.
Using this information to improve..
If Enzymes estimate trumps bacteria levels (in a statistical sense), then we need to look at the enzyme levels and deduce for each one of concern, which collection of bacteria needs reduction — even when they are in the normal range. It is the aggregation of bacteria where the issue arises, not individual bacteria or specific subsets of bacteria.
A few examples may illustrate things a little
Example: (S)-3-hydroxy-3-methylglutaryl-CoA acetoacetate-lyase (acetyl-CoA-forming) a.k.a. EC 4.1.3.4, which was the most significant for PACS in the post: Long COVID – an update. There are some 2000+ taxon associated with it. We look at the averages for these below.
Rank
Tax_Name
With PACS
Without PACS
TScore
DF
species
Faecalibacterium prausnitzii
138151
109604
3.796775
667
species
Pseudomonas viridiflava
53
25
2.628108
32
species
Comamonas kerstersii
125
40
2.600388
54
species
Pseudomonas aeruginosa
62
31
1.824644
43
species
Emticicia oligotrophica
2303
967
1.727619
455
species
Denitratisoma oestradiolicum
42
24
1.650657
22
species
Granulicella tundricola
29
21
1.61225
48
species
Bacillus subtilis
40
19
1.374431
17
species
Niabella soli
31
24
0.963943
16
species
Ralstonia insidiosa
53
38
0.914874
36
species
Oligella ureolytica
51
32
0.89768
19
species
Glaciecola nitratireducens
27
24
0.67899
66
species
Bacillus halotolerans
32
28
0.371219
58
species
Acidaminococcus intestini
749
624
0.357674
146
species
Acinetobacter guillouiae
67
63
0.098956
18
Key Contributors to EC 4.1.3.4,
For another one, we see the pattern stronger. Below we see the difference of Faecalibacterium prausnitzii is around 30,000 units. Looking at the other contributors, we see an additional 40,000 units. These extra units doubles the shift (and thus significance) of the enzyme above that of a single bacteria. Some of these are deemed healthy usually, for example: Akkermansia muciniphila which was at the 78%ile for Without PACS and 83%ile with PCAS. Neither would be deem to be outliers.
Rank
Taxon Name
With PACS
Without PACS
t-score
DF
species
Faecalibacterium prausnitzii
138151
109604
3.796775
667
species
Sutterella wadsworthensis
9626
6772
2.380718
452
species
Aliarcobacter skirrowii
3756
21
2.223602
17
species
Akkermansia muciniphila
19096
12290
1.896922
547
species
Desulfovibrio desulfuricans
1423
469
1.769772
32
species
Emticicia oligotrophica
2303
967
1.727619
455
species
Enterococcus casseliflavus
1965
81
1.635666
38
species
Porphyromonas asaccharolytica
1350
254
1.59988
186
species
Bacteroides fragilis
8080
5595
1.523991
489
species
Bifidobacterium dentium
1454
461
1.433823
239
species
Phocaeicola dorei
35482
29075
1.396731
649
species
Corynebacterium aurimucosum
1105
407
1.275234
96
species
Bacteroides eggerthii
14379
10345
1.108857
263
species
Corynebacterium jeikeium
1897
723
0.858282
70
species
Phocaeicola coprophilus
6496
3642
0.856783
152
species
Desulfovibrio piger
2032
1534
0.848976
141
species
Megamonas funiformis
1677
1130
0.620283
90
species
Hathewaya histolytica
2890
2729
0.467066
660
species
Haemophilus parainfluenzae
1343
1250
0.282656
500
species
Mesoplasma entomophilum
1182
1069
0.230055
294
species
Phocaeicola vulgatus
51403
51213
0.034398
665
Key Contributors for EC6.1.1.6
Going Forward
The logical approach is simple to describe. For a person with the symptom, determine the enzymes which are abnormal. Determine the bacteria that are too high (even if only a little). Then use the suggestions AI Engine to determine the substances that will affect the greatest number of these bacteria to shift in the desired direction without encouraging other bacteria that could contribute to these enzymes to increase.
Now, the mathematics and complexities of this computation is a different matter but well within the power of today’s computer.
I don’t know, if you remember me, we did two reports together, and your suggestions really helped to get my microbiome back on track (which shows in the samples).
And then I got COVID in November 2021-December 2021. But I felt better with it, but unfortunately I couldn’t give up my sample while having COVID.
Anyway I wanted to ask you whether you may be interested in my case, because I had a huge, irreversible it seems, crash from 20-30 on Bell CFIDS disability scale to now under 10 and my microbiome crashed along with me . (The crash also resulted in a high number of Lorazepam intake from which I’m slowly withdrawing now. But I didn’t get a clear idea of the effect of Lorazepam on the microbiome, other then they make the slowed gut motility worse of course.)
I have a very severe and have a progressive form of ME/CFS in the way that whenever I really crash I always go down to a lower baseline and do not recover. And with most crashes I loose about 50 % of my functionality, so it just took me one year to go from very mild to very severe.
From my lowest point onwards I’ve always had to take about 4 Lorazepam to guarantee a minimum of a bearable quality of life in bed. I succeeded for 4 years not to have a major crash and did did not build up a tolerance towards Lorazepam in that time.
A lot of things seem to have reversed, what I should take before are often things that I now should avoid. What Biomesight says seems to contradict slightly from what I can gather from your site. (Yes, I know you explained why there can be contradictory results).
And I have difficulties getting the suggestions for the handpicked criteria to show. Of course I would be super glad, if you could help, but I understand if you have more interesting projects to work on. (I would of course donate for your effort, as this is the only or easiest way to say thank you),
I believe one of the differences between Microbiome Prescription(MP) and Biomesight is simply the number of studies used to make suggestions. At present, we have over 11,000 studies coded into MP, I do not know the number that Biomesight uses, but I expect less than 1%. Also, MP suggestions was written by a person that has worked professionally in Artificial Intelligence. I suspect Biomesight lacks that skill set for development. Regardless, put items not in disagreement as first priority.
Analysis — The Numbers
There is no magic number that answers questions about the microbiome. Usually, I look for abnormalities. Since the earlier post, she had 6 more microbiome samples done periodically and shown below. She is wise to regularly monitor and ideally take moderate steps (diet and supplements) to counter any concerning trends.
Criteria
Sep21
Mar22
May22
Sep22
Jan23
May23
Shannon Diversity Index
78.2
94.3
67.1
53.9
98.9
84.70
Simpson Diversity Index
30.7
40.7
44.4
17.5
42.9
48.90
Chao1 Index
53.6
66.8
81.5
36.7
65.1
61.90
Lab Read Quality
4.8
7.3
7.7
5.2
5
6.5
Bacteria Reported By Lab
612
653
717
536
636
642
Bacteria Over 99%ile
2
15
9
6
8
4
Bacteria Over 95%ile
4
20
50
33
32
12
Bacteria Over 90%ile
29
44
69
50
68
38
Bacteria Under 10%ile
44
181
181
40
53
43
Bacteria Under 5%ile
12
164
165
9
20
14
Bacteria Under 1%ile
1
140
148
1
3
0
Rarely Seen 1%
5
3
7
0
2
2
Rarely Seen 5%
16
11
21
10
19
15
Pathogens
28
29
38
31
32
34
Outside Range from JasonH
5
5
6
6
8
8
Outside Range from Medivere
12
12
19
19
19
19
Outside Range from Metagenomics
9
9
10
10
6
6
Outside Range from MyBioma
6
6
6
6
9
9
Outside Range from Nirvana/CosmosId
20
20
14
14
21
21
Outside Range from XenoGene
36
36
36
36
39
39
Outside Lab Range (+/- 1.96SD)
2
12
24
16
18
9
Outside Box-Plot-Whiskers
67
83
106
94
106
58
Outside Kaltoft-Moldrup
64
183
218
87
106
75
Condition Est. Over 99%ile
0
0
0
0
0
0
Condition Est. Over 95%ile
0
2
0
0
0
0
Condition Est. Over 90%ile
0
3
5
0
0
0
Enzymes Over 99%ile
0
0
21
0
0
0
Enzymes Over 95%ile
19
0
66
15
17
36
Enzymes Over 90%ile
68
13
119
34
27
118
Enzymes Under 10%ile
30
285
203
94
200
80
Enzymes Under 5%ile
13
225
130
41
81
27
Enzymes Under 1%ile
1
164
80
2
2
11
Compounds Over 99%ile
1
0
17
0
0
0
Compounds Over 95%ile
18
0
35
3
10
18
Compounds Over 90%ile
49
5
73
13
17
64
Compounds Under 10%ile
789
876
965
1124
1135
998
Compounds Under 5%ile
779
848
927
1092
1057
959
Compounds Under 1%ile
773
832
904
1069
1018
930
Sep21
Sep21
Mar22
Mar22
May22
May22
Sep22
Sep22
Jan23
Jan23
May23
May23
Percentile
Genus
%
Genus
%
Genus
%
Genus
%
Genus
%
Genus
%
0 – 9
7
4%
46
26%
43
23%
7
5%
11
6%
9
6%
10-19
19
11%
13
7%
9
5%
17
12%
27
15%
21
13%
20 – 29
26
15%
14
8%
15
8%
16
11%
14
8%
23
14%
30 – 39
13
8%
13
7%
16
8%
12
8%
15
9%
18
11%
40 – 49
14
8%
13
7%
14
7%
17
12%
18
10%
15
9%
50 – 59
14
8%
16
9%
14
7%
10
7%
15
9%
16
10%
60 – 69
22
13%
20
11%
18
9%
10
7%
17
10%
18
11%
70 – 79
23
13%
15
8%
22
12%
19
13%
16
9%
13
8%
80 – 89
23
13%
19
11%
18
9%
18
12%
21
12%
15
9%
90 – 99
11
6%
11
6%
22
12%
19
13%
21
12%
13
8%
Total
172
180
191
145
175
161
Sep21
Sep21
Mar22
Mar22
May22
May22
Sep22
Sep22
Jan23
Jan23
May23
May23
Percentile
%
Species
%
Species
%
Species
%
Species
%
Species
%
Species
0 – 9
5%
10
28%
60
27%
70
7%
14
10%
22
8%
16
10-19
13%
26
5%
11
5%
13
12%
23
15%
33
16%
34
20 – 29
13%
27
8%
18
6%
16
9%
18
10%
23
12%
25
30 – 39
7%
15
4%
8
6%
15
12%
23
10%
22
11%
23
40 – 49
9%
19
8%
16
9%
24
8%
15
8%
18
10%
21
50 – 59
12%
25
9%
20
12%
30
9%
18
10%
22
12%
25
60 – 69
8%
17
12%
25
8%
21
7%
14
8%
17
6%
12
70 – 79
10%
20
9%
19
7%
19
11%
22
9%
20
10%
21
80 – 89
13%
27
9%
19
7%
19
16%
30
9%
21
9%
19
90 – 99
7%
15
8%
17
12%
30
8%
15
12%
28
7%
15
201
213
257
192
226
211
We lack any data on Lorazepam and other Benzodiazepines impacts on the microbiome which complicates interpretations. I did a search on the US National Library of Medicine and found nothing useful.
More History of Patient
I discovered Pregabalin in March 22 which brought me from Bell CFIDS disability scale below 10 up to nearly bell 20-30. The ditch in the curve around May 22nd is probably me taking too much Lorazepam and Pregabalin, as I for the first time I could take care of things that needed to betaken care of.
At that time I took about 500mg metformin (which did give me energy) most of the day and stayed with my Thorne Fibre mend, Inulin (in the beginning Inulin from the Argave helped dramatically with nausea and headaches)and Acacia Fibre, sometime an Amino Acid complex, but they make me jittery. Usually completely constipated I suddenly developed a strong diarrhea along with an unbearable itching of my whole skin in August / September for which Famotidine(Pepcid) and Cromoglicic acid (Cromolyn – prescription in US) worked best. That was a time where I ate lots of cake and carbohydrates and would take Metformin (I am always hovering around the entrance point to prediabetic) afterwards. That seemed to be too much sugar, my body couldn’t deal with. After I stopped the cake , eat more vegetables again, it went away.
I have got restless legs, which are kind of turned on or off with every mayor crash. Now unfortunately they are turned on, and the only thing apart from medication that helps is when I eat complex carbohydrates lie brown rice, whole food, pasta, oat flakes etc, when I don’t I use Pramipexole.
Pregabalin been used with Fibromyalgia, a sibling condition for some, and suggested by the American Family Physician journal in 2023. Pregabalin with Lorazepam has known interactions: ” increase side effects such as dizziness, drowsiness, confusion, and difficulty concentrating.”[Src] so she is right about her loss of effectiveness.
Of the many items cited, we know what a few of them likely shifts. Others we lack data.
This missing data illustrates the challenge of trying to manipulate the microbiome — an absence of data. For antibiotics we have a reasonable amount of information, thus we can negotiate with MDs between their desired goal for the antibiotic and our goal of improving the microbiome to find a mutually acceptable compromise.
Going Forward
As part of my learning process, I evaluated each against the “Just Give Me Suggestions” consensus to see it that provide any insight. I also looked at the top items in three other classes.
This helps us evaluate possible (we do not know for certain) impact on various microbiome.
I am not a medical professional and have no clinical experience, so picking items tend to be arbitrary in most cases. I am familiar with the literature for ME/CFS and if the person has ME/CFS, I will tend to pick items that studies reporting helping.
My preference is simple.
My suggestion (given all of the fuzziness and items being taken) is to persist with the prescription items — they help both her symptoms and her microbiome! I would suggest adding the following items (see Dosages for Supplements for literature on dosage):
lactobacillus casei – at least 48 BCFU/day — this is the suggested serving size from Custom Probiotics product. Or a Yakult bottle with each meal (each bottle is 20 BCFU). Depending on availability and cost.
melatonin – 10 mg/d – in three dosages, i.e. one with each meal.
Vitamin B1, B12, C7 and C. (see above for dosages)
One additional item that I would suggest, being prediabetic is to take the Pendulum Akkermansia muciniphila probiotic. This may be a challenge to obtain in Germany (if someone is visiting the US, that may be a backdoor to get it).
Postscript – and Reminder
I am not a licensed medical professional and there are strict laws where I live about “appearing to practice medicine”. I am safe when it is “academic models” and I keep to the language of science, especially statistics. I am not safe when the explanations have possible overtones of advising a patient instead of presenting data to be evaluated by a medical professional before implementing.
I can compute items to take, those computations do not provide information on rotations etc.
I cannot tell people what they should take or not take. I can inform people items that have better odds of improving their microbiome as a results on numeric calculations. I am a trained experienced statistician with appropriate degrees and professional memberships. All suggestions should be reviewed by your medical professional before starting.
The answers above describe my logic and thinking and is not intended to give advice to this person or any one. Always review with your knowledgeable medical professional.
As a result of doing an analysis for a 19 month old toddler, I added a new option that can also be used with Transcribed tests. This post applied to the following tests:
When you logged in, you will see your saved tests, CLICK ON Review.
And then we have the details you entered below with an important column, taxon number.
Below this are conditions where your pattern matches at least 5 shifts reported in Published Studies.
There may be many items listed. This is by pattern matching and is not predictive.
If you have any of these conditions, or suspect you may have. Just click the appropriate button.
An example is below. These are tuned safest-suggestions for the matches. What do I mean by safest? It means the items are not reported in any study in the database to adversely impact any of bacteria listed. Many substances have contradictory reports on shifts — this substances are excluded.
Not Listed Condition?
This person believes they may have Autoimmune, so going to https://microbiomeprescription.com/Library/PubMed we find that it is listed.
If it is not listed, search for bacteria shifts reported and use those (please send me the studies so I may add them).
The bacteria are shown in a tree. You have to manually match between the two.
In this we have:
Escherichia ⬇️ but our sample is high,
Roseburia intestinalis ⬆️ - we are high on Roseburia, we will include it
We have only one match — this tests with limited reporting is not a good fit for this condition. Doing a test like Biomesight, Xenogene, Thorne or Ombre is likely the best choice.
We just copy the taxon number into the form at the bottom of the page, and then click suggestions.
In this case, we get a short list. Remember, doing a single bacteria means you are ignoring a lot of interactions and factors. The suggestions could feed other bacteria that are too high.
A sample result dated 29/10/2023 it’s for 19month old son born via C section and having lots of ongoing tummy pain since birth.
Fully breastfed for well over 12 months but the microbiome doesn’t appear that way.
Analysis
This is a very much “flying by the seats of my pants” analysis. Why? From birth for the next 10-20 years the microbiome has dramatic natural changes. The Fuzzy Logic Expert System on Microbiome Prescription is tuned for adults and not these age ranges. If you are dealing with a child, the approach below is suggested.
I am going to use ChatGPT selectively to make analysis easier, checking that it’s answers agree with my memories from reading studies..
“There is certainly a transient difference in the gut microbiota of infants born by Cesarean delivery compared to their VD counterparts. While this difference appears to be corrected after weaning, it may have lifelong impacts on the development of the immune system. ” [2018]
“When comparing the gut microbiota composition of CSD babies with vaginally delivered (VD) babies, the former show a microbiome that closely resembles that found in the environment and the mother’s skin, while VD babies show a microbiome more similar to the vaginal microbiome. Although these alterations of normal gut microbiota establishment tend to disappear during the first months of life, they still affect host health in the mid–long term since CSD has been correlated with a higher risk of early life infections and non-transmissible diseases, such as inflammatory diseases, allergies, and metabolic diseases.” [2021]
Too late, but important for any future babies “Lab analysis showed that the microbiota of the C-section babies swabbed with their mother’s vaginal fluids was close to that of vaginally born babies” [2021]
Bifidobacteria and Firmicutes Dominance: In healthy infants and toddlers, the gut microbiome often shows dominance of beneficial bacteria like Bifidobacteria and Firmicutes. These bacteria play crucial roles in digestion, immune system development, and protection against pathogens.
Generally, Bifidobacterium can comprise anywhere from 10% to 40% or more of the total gut microbial population in toddlers.
In healthy toddlers, Firmicutes can typically constitute a substantial portion of the gut microbiota, often ranging from around 30% to 60% or more of the total bacterial population
From ChatGpt
Looking at Bifidobacterium, the numbers are lower (57%ile) than expected for a child of this age but with a rich diversity of species. Bifidobacterium is 2.4%, well below the expected 10-40%. Bacillota (formerly known as Firmicutes at 83%ile) is 79.4%, well above expected 30-60%.
Switch to consequence, ChatGpt reports: “Some of the health implications of low Bifidobacterium levels in toddlers may include:
Digestive Issues: Bifidobacterium species contribute to the breakdown of complex carbohydrates, aiding in the digestion of certain fibers and sugars. Low levels of these bacteria may result in digestive problems such as constipation, diarrhea, or irregular bowel movements.
Weakened Immune Function: Bifidobacterium species are involved in regulating and supporting the immune system. Insufficient levels of these beneficial bacteria may compromise the immune response, making toddlers more susceptible to infections and illnesses.
Increased Risk of Allergies and Asthma: Some research suggests that alterations in the gut microbiota, including low levels of Bifidobacterium, might be associated with a higher risk of developing allergies and asthma in children.
Potential Weight and Metabolic Effects: The gut microbiome, including Bifidobacterium, can influence metabolism and energy regulation. Low levels of these beneficial bacteria in toddlers’ gut microbiota might potentially be linked to metabolic issues or an increased risk of obesity later in life, although this connection is still an area of ongoing research.
Impact on Neurodevelopment: Emerging studies suggest a possible link between the gut microbiota and brain development. Some evidence indicates that alterations in gut bacteria, including Bifidobacterium, might influence cognitive development and behavior in children.
Susceptibility to Infections and Antibiotics: A decrease in beneficial bacteria like Bifidobacterium can leave the gut more vulnerable to colonization by harmful bacteria. Moreover, toddlers with low levels of these beneficial bacteria may face a higher risk of complications after antibiotic treatments, as antibiotics can further disrupt the delicate balance of the gut microbiota.
Digestive Imbalances: In some cases, an overabundance of certain Firmicutes strains might affect the balance of gut microbiota and contribute to digestive problems, including irregular bowel movements, bloating, or discomfort.”
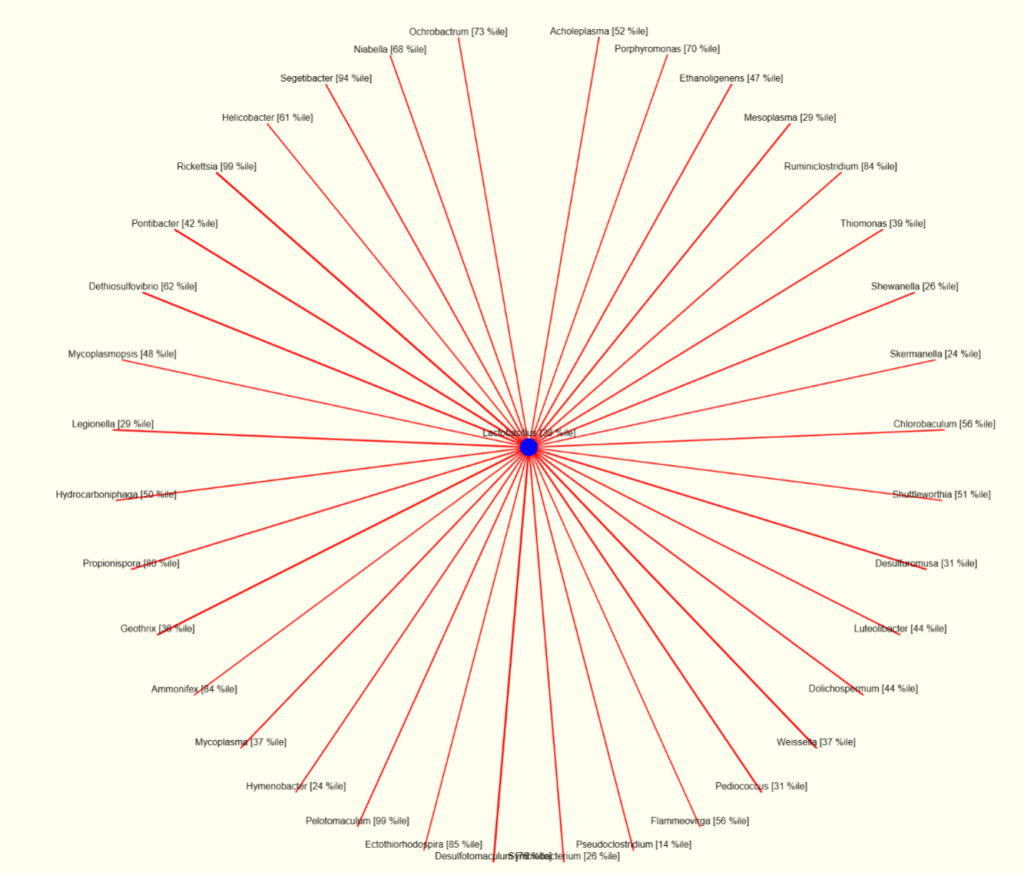
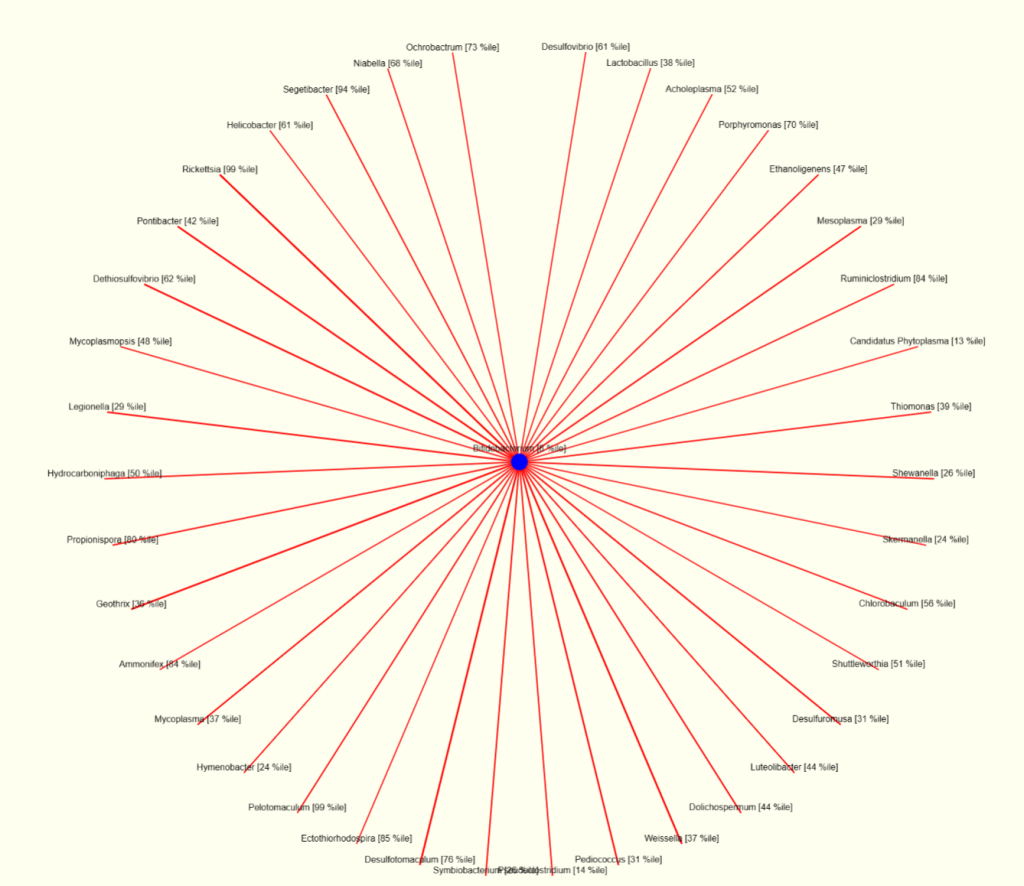
At this point, using the Fuzzy-Logic Expert System on Microbiome Prescription is not a good choice to get suggestions. It is tuned for adults and not toddlers. All of the values are in the normal range for an adult, but definitely out of range for a toddler.
What we want is to increase one bacteria and decrease another bacteria without looking at the percentile. I just added a subsection on the Research Features tab to make that available. It requires the the taxon numbers be entered. In this case: Decrease: 1239, Increase 1678 (Bifidobacterium).
See this video for a walk thru of the process.
This results in this page
You can click on each modifier to verify that it only impacts the bacteria named by taxon in the desired way.
In toddlers, several Bifidobacterium species are commonly found in their gastrointestinal tract. Among these species, Bifidobacterium longum, Bifidobacterium breve, and Bifidobacterium infantis are frequently observed in the gut microbiota of toddlers. These species play essential roles in maintaining gut health, aiding in digestion, and supporting the immune system during early childhood.
ChatGPT
We can take this one step further, picking specific children :
Increase: 1678,1680,1682,1685 (the usual toddler species)
I usually send drafts to the person for comments, concerns etc. This was the response:
I wondered whether prevotella/segatella buccae was a concern as it was the highest species in the sample and bacteroides was extremely low. The practitioner we saw prescribed HMO and lactulose after reviewing Biomesight raw data.
Mother of child
The HMO suggestion is reasonable if you do not check all of the literature. We have contradictory results from studies for HMO. Remember Bacillota is the modern name for Firmicutes.
Similarly, we have some contradiction in results with Bifidobacterium — so it was not deemed ultra safe.
This suggests adding segatella buccae (NCBI 28126) be added.
The results are similar, with less items on the to avoid.
Trying a different combinations, for example
We get different ordering and a few changes.
Bottom Line
We have various sets of suggestions, doing a consensus is likely the best path forward.
Postscript – and Reminder
I am not a licensed medical professional and there are strict laws where I live about “appearing to practice medicine”. I am safe when it is “academic models” and I keep to the language of science, especially statistics. I am not safe when the explanations have possible overtones of advising a patient instead of presenting data to be evaluated by a medical professional before implementing.
I can compute items to take, those computations do not provide information on rotations etc.
I cannot tell people what they should take or not take. I can inform people items that have better odds of improving their microbiome as a results on numeric calculations. I am a trained experienced statistician with appropriate degrees and professional memberships. All suggestions should be reviewed by your medical professional before starting.
The answers above describe my logic and thinking and is not intended to give advice to this person or any one. Always review with your knowledgeable medical professional.Posted on b
April 2022 strong antibiotic treatment against another pathogen flared my chronic borrelia/babesia/bartonella. [I had Ceftriaxone iv and 1500mg of azithromycin as a single dose].
Shortly after this stinging started in the belly and burning when passing a stool and urinating. Its yeast symptoms. I have mthfr mutation and low bifido bacteria.
“chronic borrelia/babesia/bartonella” is also known as Chronic Lyme disease. See Lyme Disease Co-Infections | LymeDisease.org. It is a close sibling to ME/CFS, Long COVID and Occult Rickettsia. There are 77 samples uploaded marked with Lyme, 45 of these also indicate ME/CFS (58% overlap). There was no statistically significance difference in the microbiome between these two groups.
This person requested a video walkthrough due to cognitive issues with reading.
Analysis
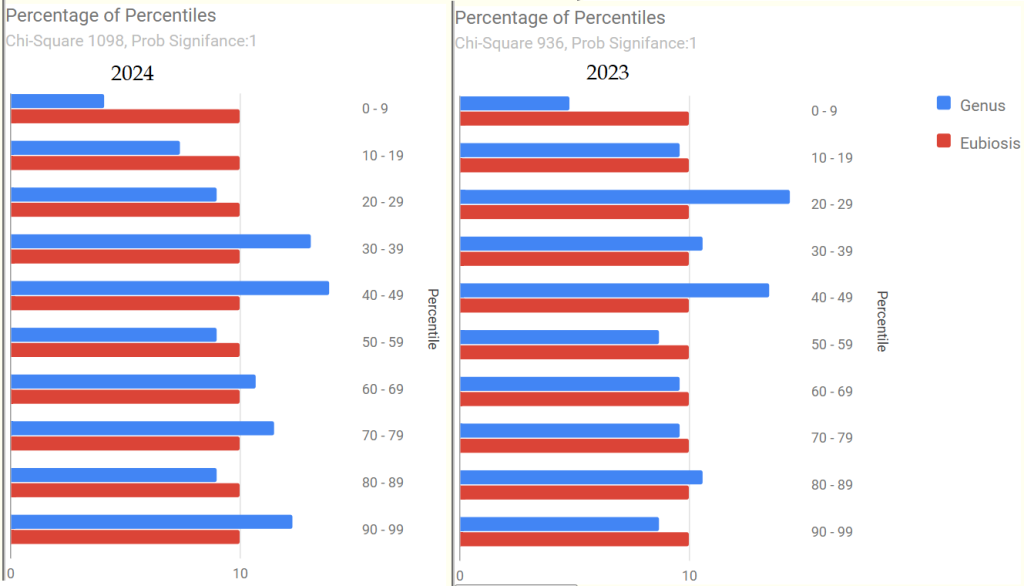
Looking at the Percentile-Percentage distribution, we see the common pattern with ME/CFS and Long COVID: over representation of the 0-9%ile range. The numbers in each percentile range should be about the same. They are not.
Looking at the new Anti inflammatory Bacteria Score [Score: 12.56 or 16.9 %ile], we see that bacteria controlling inflammation appears to be very deficient. Dr. Jason Hawrelak Recommendations is at 89%ile with the following anti-inflammation bacteria being flagged as low: Roseburia, Bifidobacterium, Lactobacillus and Akkermansia.
Looking at the Potential Condition lists, we see many that we would expect to see
I checked the KEGG suggested probiotics none of the suggestions were strong. On the other hand we have a good number of supplement suggestions from KEGG (shown below). The higher the Z-Score, the more important they are.
Looking at probiotics we see the best ones being bifidobacterium (which is good because many lactobacillus produce d-lactic acid that causes brain fog).
bifidobacterium pseudocatenulatum,
bifidobacterium infantis,
bifidobacterium breve
There are some lactobacillus also suggested:
lactobacillus casei — documented to be good for allergies and hay fever. Usually I suggest Yakult, one vial around each meal.
lactobacillus reuteri — biogaia (reported not to produce d-lactic acid)
For supplements, checking the items from the KEGG list above, we found that all items suggested which we have data on, agreement that they should help:
N-Acetyl Cysteine (NAC), +185
l-proline + 161
l-glutamine + 76
l-arginine +45
l-phenylalanine +40
Postscript – and Reminder
I am not a licensed medical professional and there are strict laws where I live about “appearing to practice medicine”. I am safe when it is “academic models” and I keep to the language of science, especially statistics. I am not safe when the explanations have possible overtones of advising a patient instead of presenting data to be evaluated by a medical professional before implementing.
I can compute items to take, those computations do not provide information on rotations etc.
I cannot tell people what they should take or not take. I can inform people items that have better odds of improving their microbiome as a results on numeric calculations. I am a trained experienced statistician with appropriate degrees and professional memberships. All suggestions should be reviewed by your medical professional before starting.
The answers above describe my logic and thinking and is not intended to give advice to this person or any one. Always review with your knowledgeable medical professional.
38yr Old now, Issues started around the age of 24-27 i think [gradual onset]
From the age of 17-35 my diet has been really bad ( Coca cola, pizza, burger, fries, candy and sweets etc)
From 23-25 I started getting really tired everyday followed by pains in various locations
Later, started loosing weight in the face, eyes started to sink deeper and deeper, my face become really gaunt. All my life i have been thin and could never gain weight nomatter how much i ate.
I also startet getting extremly fatigue after eating.
definitive stomach issues started around the age of 30-33, may have been before.
Since I turned 34, i have been trying to figure out what is wrong with me.
Allof the standard checks at the docs Office(ultrasound of organs and stomach area, CT/MRI of stomach area, Colonscophy and gastroscophy)
Nothing found
So everything points towards gut dysbiosis or something like that
I started to change around with my diet July 2022. Details of various attempted changes (Gluten free, no dairy, no sugar, carnivore diet) — currently on Keto with resistant carbs.
But many symptoms are still there.
I have been taken multiple rounds of antibiotics from november 2022 until Jan. 2023 (80 days) because i had a sinus and deviated septum surgery. I have also taken 7 days of metrodinazole and amoxicilin 12 weeks ago because of the H Pylori infection i had. Retest was negative for H. Pylori Got diagnosed with methane SIBO via breath test in september 2023
I have been diagnosed by a GI Map test in May 2023 with:
candida
E coli overgrowth
Streptococcus overgrowth by a gimap test in May 2023
I feel like my body is destroying itself. A long list of symptoms was given
Analysis
Potential Medical Conditions Detected
Nothing stood out. By this I mean that the Percentile ranking is well into the Prevalence. The closest was SIBO where the borderline would be 100-52= 58%ile. He was reasonably over that. He wrote “Got diagnosed with methane SIBO via breath test in September 2023”, so this was a definite matching forecast from PubMed literature.
Bacteria deemed Unhealthy
The one item of interest was Faecalibacterium prausnitzii, which was 19% of his microbiome and associated with increased Candida risk (which he has had).
This is my quick way to statistically determine if there is statistically significant dysfunction. The significance is 0.99999.. etc, so yes.
Forecast Symptoms
In the top ones we had the following agreements with reality:
cold extremities
Rapid muscular fatigability
Joint pain
Sinus issues with headaches
Onset: Gradual
Sinus issue
Onset: 2010-2020
Gender: Male
General: Headaches
Post-exertional malaise
The ones that did not match were connected to cognitive issues.
Pattern appear to match a subset of myalgic encephalomyelitis/chronic fatigue syndrome. Many MDs will suspect it, but will not give a diagnosis if the person is not totally disabled. The reason is simple, no treatment plan and likely a negative psychological impact.
Going Forward
This looks likes a good candidate for a two stage building a consensis:
“Just Give Me Suggestions”
THEN using special studies (everything at once – skipping Gender) to add a fifth set of suggestions
The suggestions are short and tight. Barley porridge with Walnuts for breakfast for most days.
I would suggest taking Danish product Biogaia Lactobacillus Reuteri just before bed each night for two weeks, then switch to clostridium butyricum for two weeks. The other probiotics – do 1 at a time for 1-2 weeks, take them 1-2 hours after breakfast.
Akkermansia Muciniphila probiotics and Swedish Filmjölk (on your porridge?) are two probiotics with no known negative impact and some positive impact. The list above are the highest predicted impact.
What to avoid
Keep up the no alcohol but reduce/drop beef in your carnivore diet. Go for herring, eels and other fish product. It is interesting that the two E.Coli probiotics are listed as avoid (the logic does not look at E.Coli levels, but other bacteria levels to make that suggestion)
Prescription Items (if you have a willing MD)
Doing antibiotics is usually consider if the above do not cause sufficiently improvement over time. I mentioned that the history looks quasi-ME/CFS. I was not surprise to see many ME/CFS antibiotics on the list, including:
AMOXICILLIN (ANTIBIOTIC)S[CFS]
AMPICILLIN (ANTIBIOTIC)S[CFS]
CIPROFLOXACIN (ANTIBIOTIC)S[CFS]
If you and your MD decide to try antibiotics, I would suggest on of those (using Dr. Jadin approach of pulsing).
Browsing the Details
High value was 701, low as -391. Usually these two numbers are about the same magnituded. Items spotted of note:
Q: Regarding your sugestion of all the probiotics. Usually the probiotic comes in bottles where there is like 4-10 different strains. Should i avoid that and only buy single strains in each bottle of all the ones you mentioned?
A: Each strain impacts things in different ways. My preference is always single strains, ideally ones that have been researched with the ideal being ones researched for your condition or symptoms and found effective. See https://microbiomeprescription.com/library/ProbioticSearch , There are reports of some probiotics making people worse. A major issue is that probiotics are not well regulated Many “retail mixtures” have over 60% of their contents misidentified. See Deceptive Probiotic Labels or Assessment of commercial probiotic bacterial contents and label accuracy, When the bottle gives an explicit strain (not species), then the owner of that strain has motivation to insure quality control.
Looking at the challenges of getting probiotics in Denmark. What may be an acceptable compromise is to find a probiotic mixture that does not contain any probiotics with an estimated adverse risk. In your case these are:
symbioflor 2 e.coli probiotics
colinfant e.coli probiotics
bacillus subtilis natto (probiotics)
bifidobacterium longum,lactobacillus helveticus (probiotics)
Example: lactobacillus rhamnosus gg (probiotics) is an explicit strain (“GG”) is the second highest positive, while generic lactobacillus rhamnosus is # 54 and negative.
Postscript – and Reminder
I am not a licensed medical professional and there are strict laws where I live about “appearing to practice medicine”. I am safe when it is “academic models” and I keep to the language of science, especially statistics. I am not safe when the explanations have possible overtones of advising a patient instead of presenting data to be evaluated by a medical professional before implementing.
I can compute items to take, those computations do not provide information on rotations etc.
I cannot tell people what they should take or not take. I can inform people items that have better odds of improving their microbiome as a results on numeric calculations. I am a trained experienced statistician with appropriate degrees and professional memberships. All suggestions should be reviewed by your medical professional before starting.
The answers above describe my logic and thinking and is not intended to give advice to this person or any one. Always review with your knowledgeable medical professional.
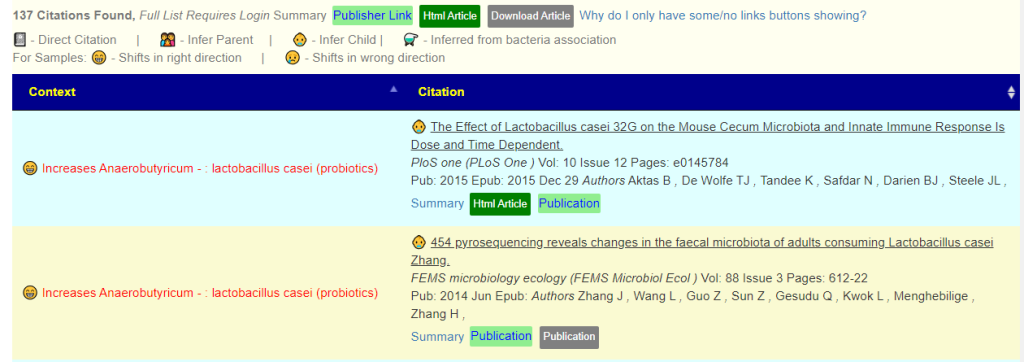
Over the last two weeks, there has been a couple of email pointing out possible errors in some citations. I am not surprised. I expect 90-95% correctness (i.e. 1 in 10 or 1 in 20) may be incorrectly entered. To improve the quality, we need independent review of the data. In one amusing case, I quoted my source correctly but that review study incorrectly cited it’s source. The data entry was right, the source document was wrong.
The articles are technical studies which often require advance reading skills and knowledge of this topic. Some of the sources are available in full on the web for free, others are behind a paywall. If you are connected with a university or college, you may have access thru your institution.
If you cannot access the full text of the source, then skip it. Extracts and summaries can contain errors.
Process
Just email me from the email account that you logged in with and I will add auditor or QA permissions to your account.
Doing it
When you logged in, you should see:
When you look at citations, you will see the ⚖️ icon (or a ✅ if someone has already checked) beside the citation.
Example for a list of citations
Note that there may be more in the study then what the titles implies. Often data is from Appendix and tables.
Clicking ⚖️ will take you to a page showing what was extracted and gives you an opportunity to correct it,
Click [Report above Issue] will send emails to me and to your self. If all of the information is correct, then click [I have verified..] and the next time you see the citation, there will be a ✅ beside it. Your email is stored beside the citation as the reviewer.
You will get an email confirming stuff
If there is information that was missed (more likely) please include the TAXON numbers of the bacteria. This speeds up the process. Often information was missed because of alternative spelling.
That’s the process. Short, simple and with the ability for me to quickly make corrections.
Recent Comments