For samples coming from uBiome, Ombre/Thryve and Biomesight there are two important numbers reported. [Count] and [Count_Norm].
- [Count] is the number coming from the lab equipment, the bacteria detected.
- [Count_Norm] is the above number scaled to be out of one million (1,000,000)
The question arises, if you have low lab quality and the number of bad bacteria also dropped: Is this an actual improvement or a false improvement due to low lab quality?
To partially answer that question, I pulled biomesight samples (biggest collection) and plotted the data. Shown below:
- Vertical axis is number of bacteria reported
- Horizontal axis is lab quality measure
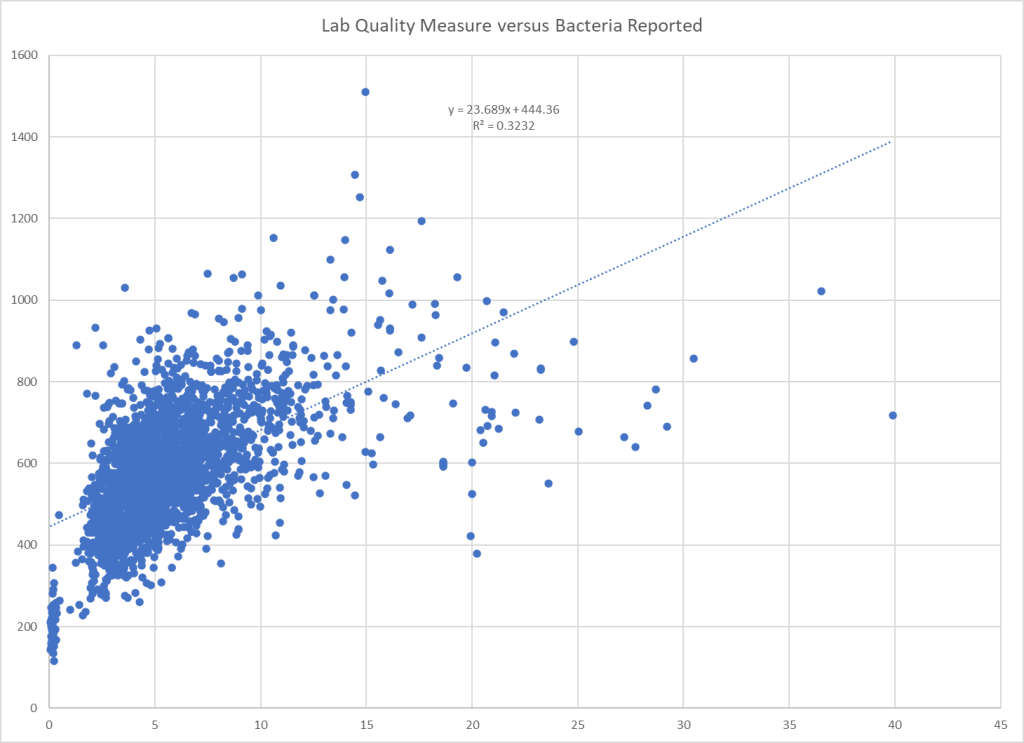
As is shown, there is a relationship.
Using this data and sample values of 4.3 and 8.4, we compute 546 and 643 for expected bacteria (just use the formula on the chart). This means that with 4.3 we expect only 85% (546/643 * 100) of the count seen with 8.4.
So we see the changes below are likely true improvements: (Left is 4.3, right is 8.4)
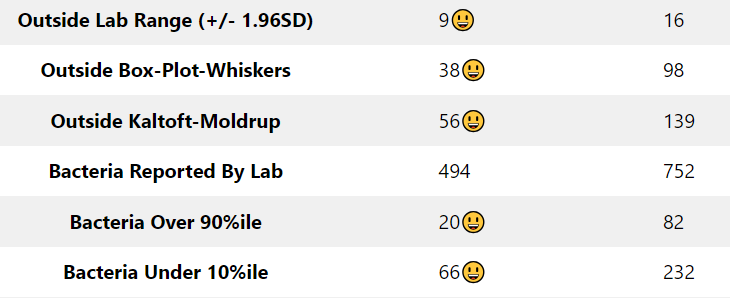
For bacteria reported by lab, the numbers suggests the left column has less odd bacteria and the gut microbiome may becoming more uniform.
For anyone interested in doing their own charting and analysis, the raw data is https://citizenscience.microbiomeprescription.com/
Recent Comments