First, some fundamentals:
Units of Measure
The notation “3.3e12” is scientific notation, which is a compact way of representing very large numbers. In this notation, the “e” stands for “exponent.” So, “3.3e12” means 3.3×10^12 .
Breaking it down:
- 3.3 is the coefficient or mantissa.
- 10 is the base.
- 12 is the exponent or power of 10.
Therefore, “3.3e12” is equivalent to 3.3 multiplied by 10 raised to the power of 12 , which equals 3.3 followed by 12 zeros:
3.3×1012=3,300,000,000,000.
In other words, “3.3e12” represents 3.3 trillion.
Total Bacteria
Ideally, you would add up all of the phylums; unfortunately GI-MAP only provides two
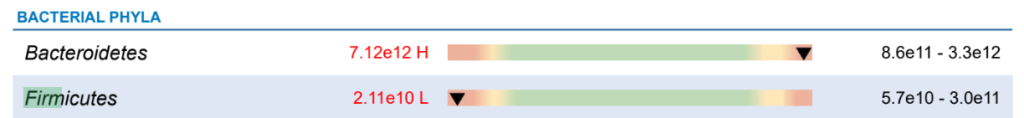
So the total in this sample is 7.15e12 which is above the reference range max of 3.6e12. So for the purposes of this discussion, we will assume 7.15e12 (with the difference from reference being other phylums).
How does GI-MAP work?
The GI-MAP (Gastrointestinal Microbial Assay Plus) is a diagnostic tool used to assess the composition of bacteria, parasites, and other microorganisms present in the gastrointestinal tract. It utilizes a technique called quantitative polymerase chain reaction (qPCR) to measure the abundance of specific microbial DNA in a stool sample. Here’s how it works:
- Stool Sample Collection: A patient provides a stool sample, typically collected at home and sent to a laboratory for analysis.
- DNA Extraction: The laboratory extracts microbial DNA from the stool sample. This step involves breaking open the cells of the microorganisms to release their genetic material.
- Primer Design: Primers are short DNA sequences designed to bind specifically to the target DNA sequences of interest. For the GI-MAP, these primers target specific regions of the microbial DNA that are unique to certain bacterial species, parasites, or other microorganisms.
- qPCR Amplification: The extracted microbial DNA is mixed with the primers and other reagents in a reaction mixture. The qPCR machine then cycles through a series of temperature changes to amplify (copy) the target DNA sequences. Each cycle doubles the amount of DNA present, allowing for the exponential amplification of the target DNA.
- Fluorescent Detection: During the qPCR process, fluorescent reporter molecules are incorporated into the DNA as it is amplified. As the amount of amplified DNA increases, so does the fluorescence signal. This allows the qPCR machine to detect and quantify the amount of DNA present in the sample.
- Data Analysis: The fluorescence data collected during the qPCR process are analyzed to determine the abundance of specific microbial DNA targets in the stool sample. By comparing the fluorescence signals to standard curves generated from known concentrations of DNA, the laboratory can quantify the relative abundance of different microorganisms present in the sample.
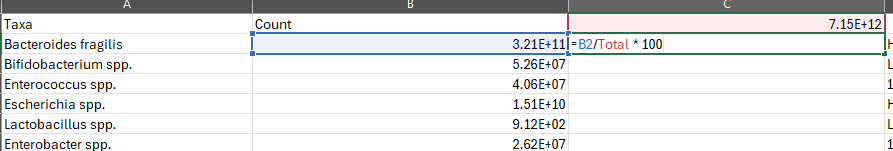
Converting to Percentage
Now, how do we convert. The easy way is to use EXCEL or other spreadsheets. Example of the formula is below.
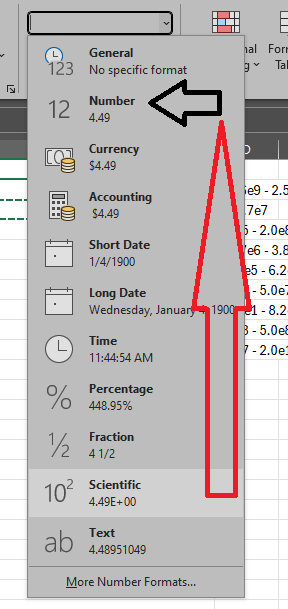
Then change the display from Scientific to Percentage
We now have the percentages
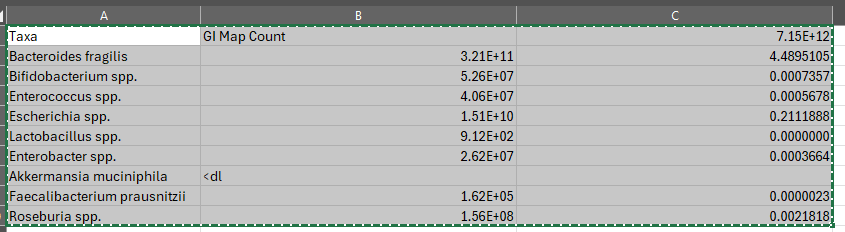
That is it!
You can then compare to Jason Hawrelak Criteria for Healthy Gut or other criteria.
A word of Caution
One word of caution… to illustrate, take GI-MAP reference ranges and convert to Percentiles.

this becomes 0.0007 – 0.28%
then go to https://microbiomeprescription.com/library/details?taxon=841
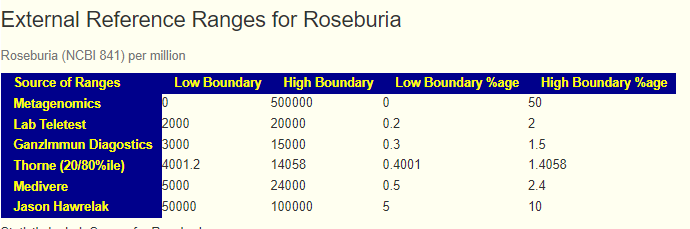
Their measurement scale seems inconsistent with other scales (16s and Shotgun)
Recent Comments