Recently I revisited finding association between bacteria. We know bacteria both produce and consume metabolites and chemicals, as well as bacteriocins that will inhibit other bacteria. “Bacteriocins are potential alternatives to traditional antibiotics. These peptides, which are produced by many bacteria, can have a high potency and a low toxicity” {Nature 2012]. Finding the relationships has been a challenge because of the nature of the distribution (not a bell curve — see this post on the solution that I use for identifying abnormal values) Post #1 Post #2.
This is a technical note (WARNING: Geek Speak) on the 262,603 relationship with correlation coefficient R2 of 0.10 or higher that is available on the site.
Example of Classic Association
For our example, we will compare two families: Brucellaceae and Caulobacteraceae. Their ancestry is shown below
- Proteobacteria; Alphaproteobacteria; Hyphomicrobiales Brucellaceae
- Proteobacteria; Alphaproteobacteria; Caulobacterales Caulobacteraceae
Because they have some shared ancestry, you would usually expect them to be friendly and suppurative of each other. The standard analysis is shown below, charting the counts from samples that have both bacteria.
Classic Approach
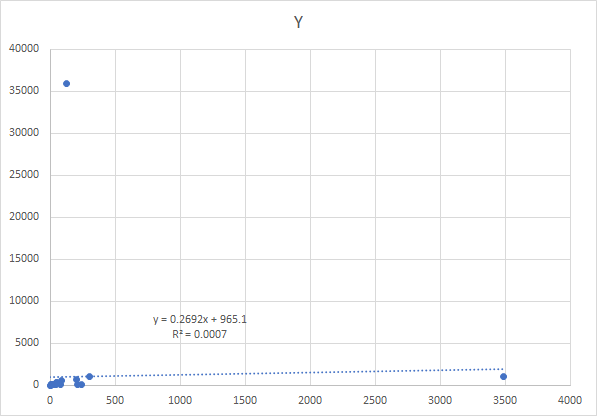
After an intro course to statistics, most people would do a regression. It is unlikely they would look at the chart because there are 2,669,956 charts that would be produced with the dataset that I am working with.
The regression and the chart is shown below, logical conclusion – no relationship.
Alternative Approach
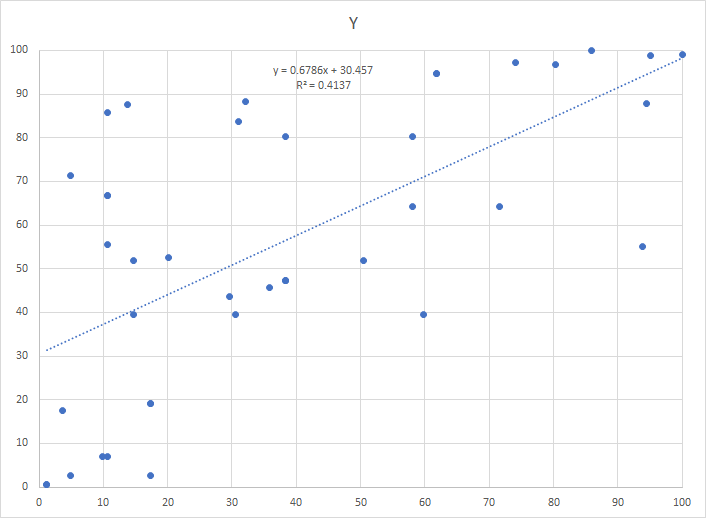
The alternative is to use what is called monotonic increasing functions on the counts. We scale the function so that it’s range is 0 to 100. This preserves the nature of the data and discard the naïve assumption of linearity. The result is shown below. With this approach, we get the following chart. same data!!!
We could for each pair of bacteria derive the absolute optimal monotonic functions. This approach I find problematic because your appear to be fiddling with the data too much. I have put the additional constraint that you are allowed only one monotonic function per bacteria. I believe this will inhibit over-fitting the data to the model.
How many relationships over 0.1?
We have 1621 bacteria with at least one, and the top ones are shown below
| taxonomy rank | taxonomy name | Count |
| family | Halanaerobiaceae | 546 |
| class | Fibrobacteria | 526 |
| class | Dehalococcoidia | 506 |
| family | Fibrobacteraceae | 505 |
| order | Fibrobacterales | 501 |
| genus | Fibrobacter | 483 |
| family | Nitrosomonadaceae | 474 |
| genus | Dehalogenimonas | 474 |
| order | Acidobacteriales | 467 |
| family | Micromonosporaceae | 461 |
| genus | Nitrosomonas | 460 |
| genus | Acinetobacter | 459 |
| family | Colwelliaceae | 455 |
| family | Acidobacteriaceae | 453 |
What benefit does this give?
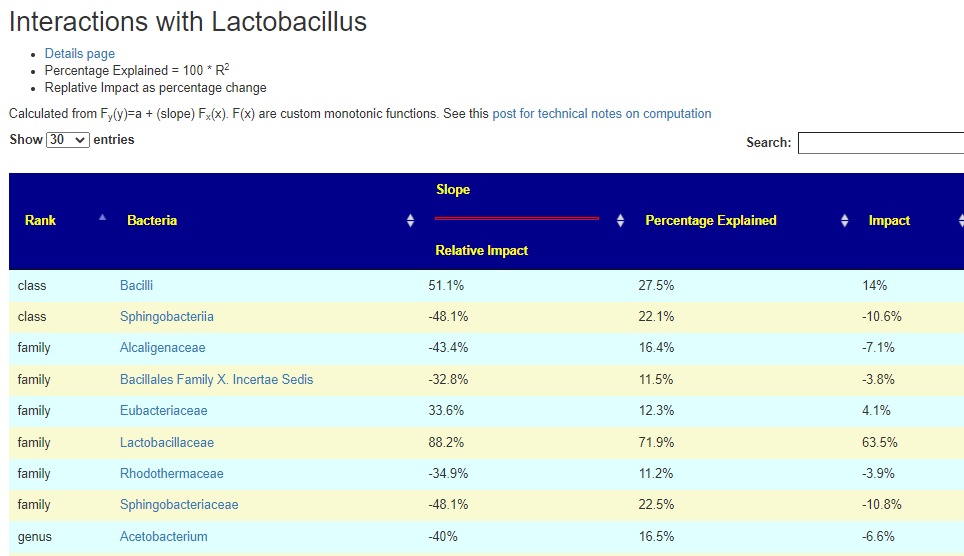
The impact of one bacteria on the other may be computed as slope * r2 . So R2 of .5 and a slope of .4 = .5 * .4 = .20 or 20%, thus for every 10 steps of one, the other will increase by 2.
We can use this when some bacteria X is high or low and we have no information on modifying it. We can look at the related bacteria with highest impact and its modifiers. We are trying to cascade by changing the associated bacteria to change our target bacteria! We are attempting to model the modifiers secondary changes into our suggestions.
Where is this on the site?
On the bacteria details pages. if there are associations, there will appear a link to it
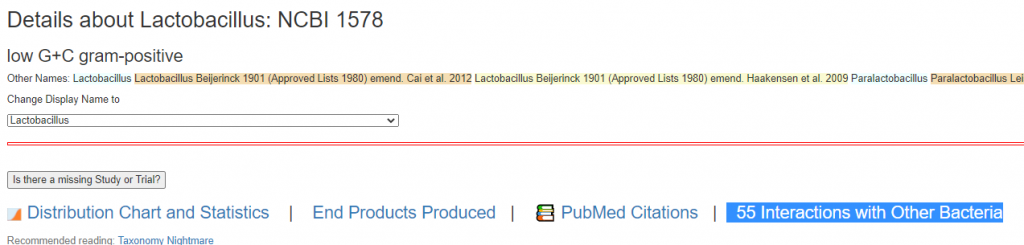
Clicking this will take you to the impact page. In the example below you see that Lactobacillus accounts for 63% of it’s parent class. Lactobacillaceae(family) which includes Lactobacillus , Pediococcus , and Sharpea. So it is the greatest contributor the three.
Orphan Detail Pages
I call these orphan because there is not literature on them or little studies. For example Pectinatus where there was just one know citation, ginko. We now have 10 more marked with the association icon as shown below.
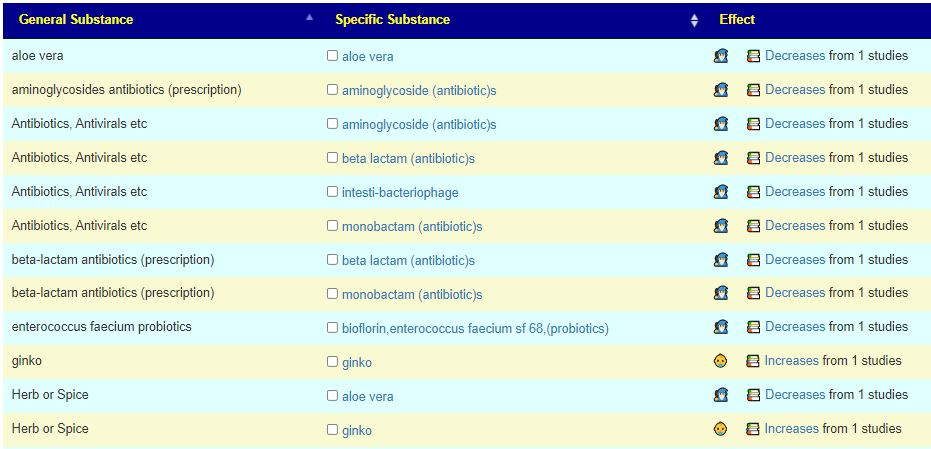
Available to include for Suggestions
There is a new checkbox on the custom suggestion page. If you wish these to be factored into suggestions just check the box.

We know immigrants to the US are more susceptible to developing obesity and metabolic diseases such as diabetes than either people from the same countries who don’t migrate or native-born US citizens, but we don’t really understand why. To try to understand this phenomenon from a health perspective, researchers from the University of Minnesota conducted a large, in-depth study of Chinese and Thai immigrants moving to the US. The authors looked at the diet, gut microbes and body mass index of the immigrants before and after they moved. The evidence showed that the longer immigrants spent in the US, the less diverse their bacteria became, and that this was linked to rising obesity. The human gut is home to hundreds of different species of bacteria known collectively as the “gut microbiome”. As well as breaking down food, this community of microorganisms helps our bodies fight and prevent disease. There is even tantalising evidence that the gut microbiome can influence our mental health .
Simplest answer change of diet. This include “the same food items processed differently”. Other factors include life style changes and environment.