I have refactored Bacteria Interactions Why? on the site to use the data discovered via this post. The information is more accurate and more comprehensive than the prior version
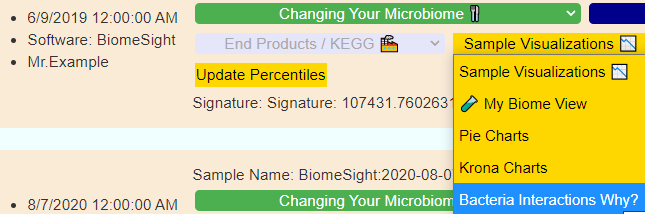
I have done a quick demo, shown below, and I will add a few examples after.
Key points
- The color of the oval indicate level of hierarchy
- Same color to the middle one indicates that it’s independent
- Often other colors are children or parents
- Line thickness indicate amount of influence
- Size of the ovals indicate percentile ranking.
- A small oval indicates less than bacteria than normally seen
- A large oval indicates more bacteria than normally seen
Examples
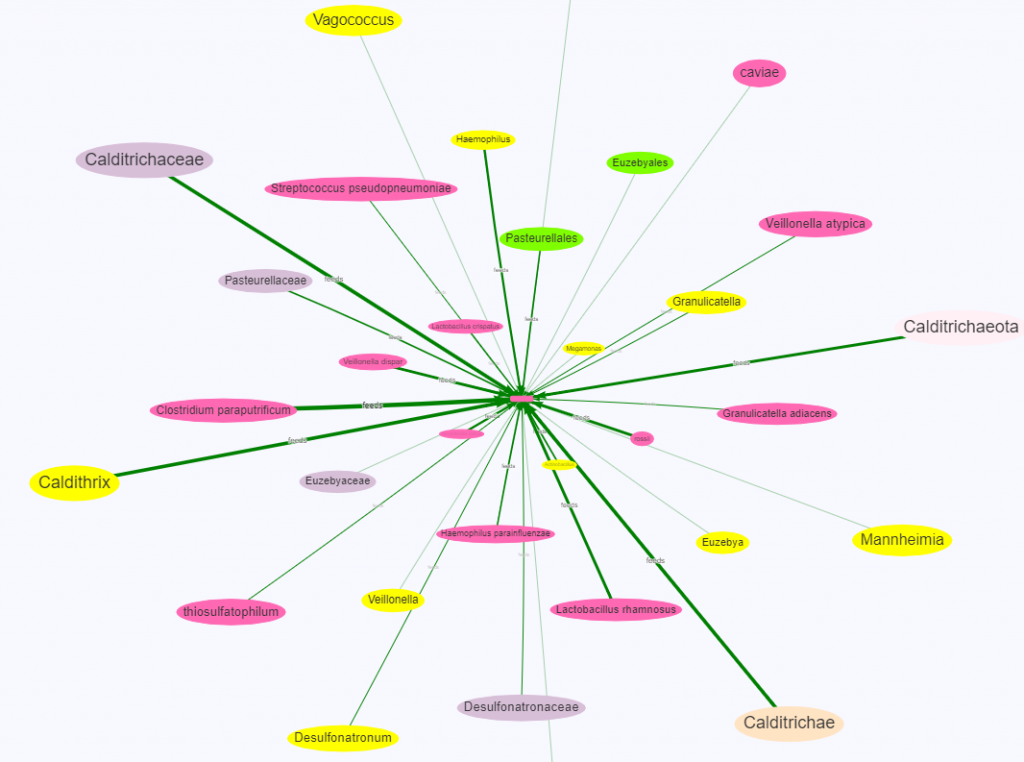
In our first example below we see many other species encourages this species If we look at it’s hierarchy on NCBI, we see a lot of bacteria that are not related by descent.
Firmicutes; Negativicutes; Veillonellales; Veillonellaceae; Veillonella
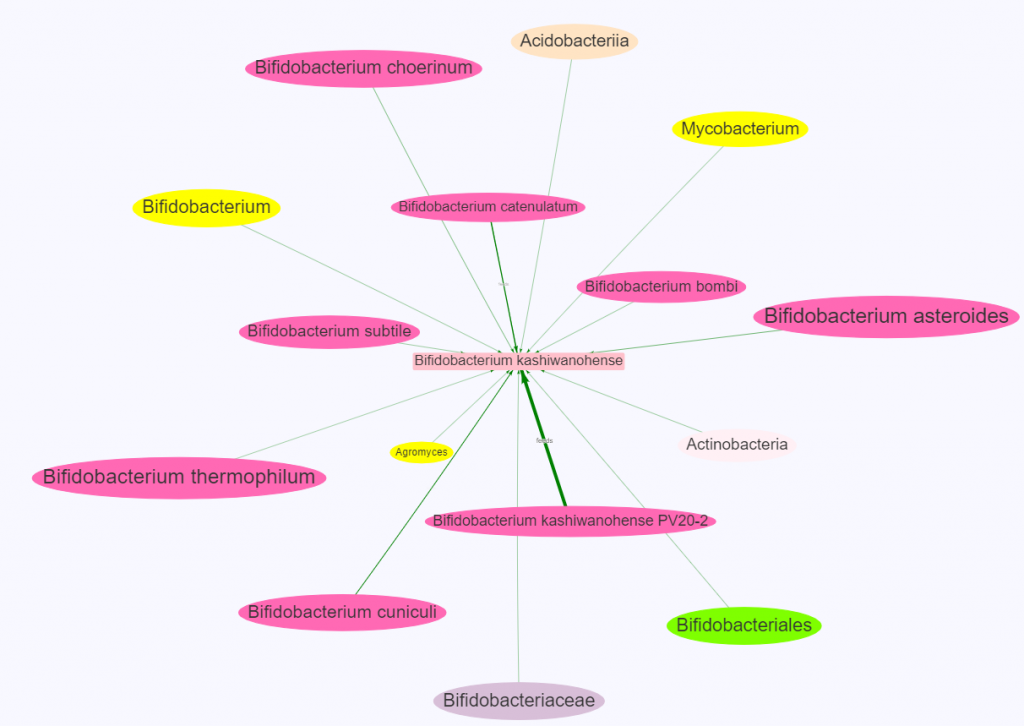
For the next example we see many siblings influencing it.
Bottom Line
Beyond the fun to see aspect, if there is an item of concern you may wish to see what bacteria influences it and include those in a hand-picked sample.
Recent Comments