Details on Bacteria Selection

People have asked why going different suggestion choices give different results – sometimes contradictory ones! The suggestions are determined by the bacteria included to alter. There is no magic way to select the bacteria. The site gives you a variety of choices/methods reflecting various requests expressed. This post attempts to explain these choices. Remember a typical microbiome result may be 600 bacteria – picking a dozen bacteria at random will give different suggestions every time. Many of the bacteria are ‘noise’ with no health impact in most cases

Quick Suggestions

This looks at only the bacteria in Dr. Jason Hawrelak criteria for a healthy gut. If you are outside of his ranges then low values are attempted to be increased and high values are decreased.

Number of Bacteria Considered: 15

If any other published author care to provide their criteria and grant permission to use, it can be added.

Medical Conditions

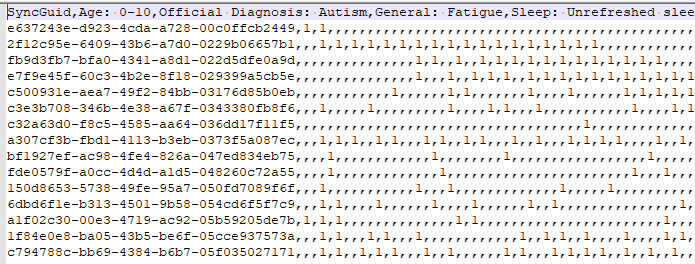
When you click on one of the items on the “Adjust Condition A Priori” link there is no microbiome to refer to so one is synthetically created. This is done by looking at the reported shifts and computing one.

From the Autism Profile

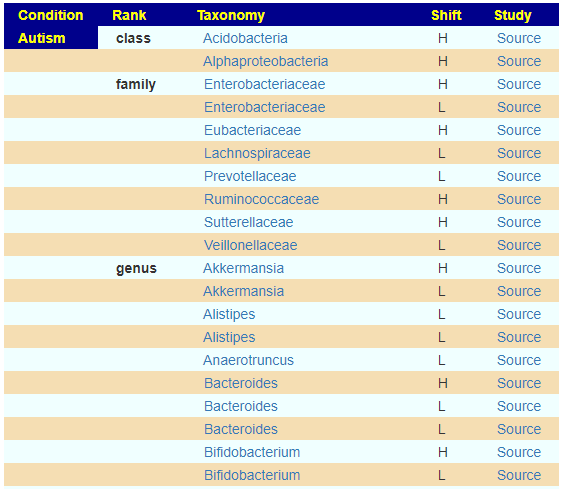
We apply some fuzzy logic here.

  • If just one report, we run with that value
  • If equal number of high and low we ignore.
  • If different number of high and low, we compute the difference, and deem the winner to be included

We then create a profile using the 12%ile value for low and 87% for high value.

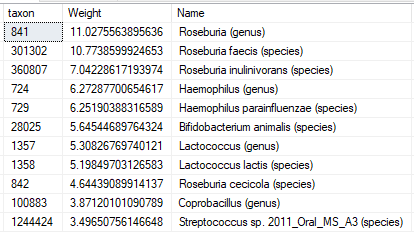
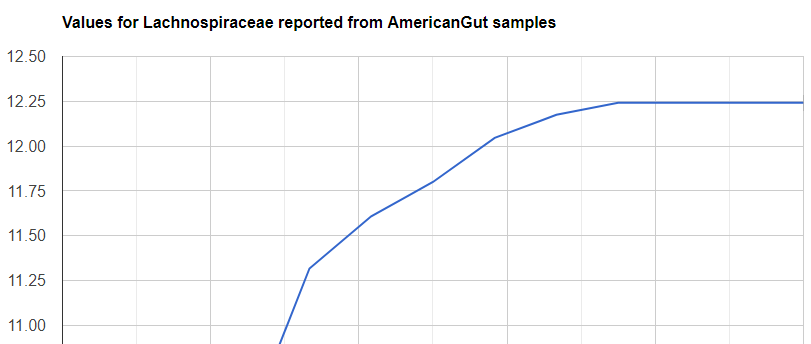
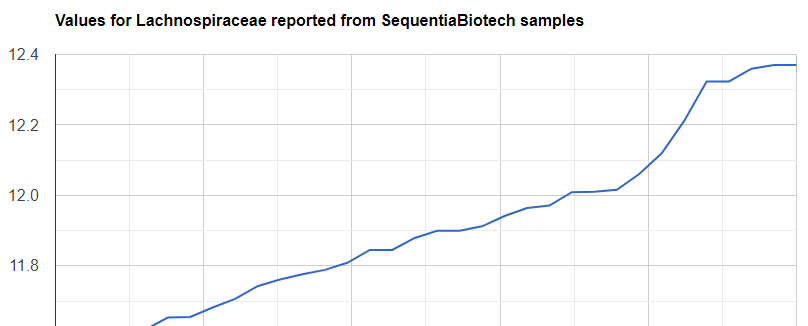
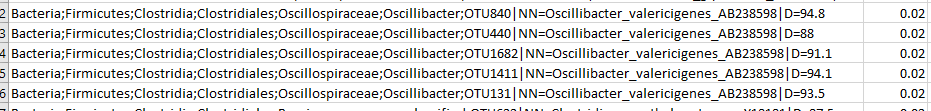
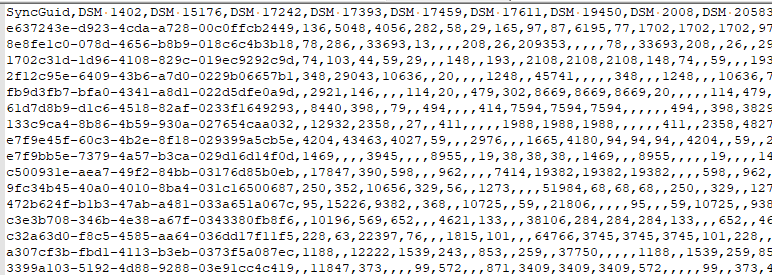
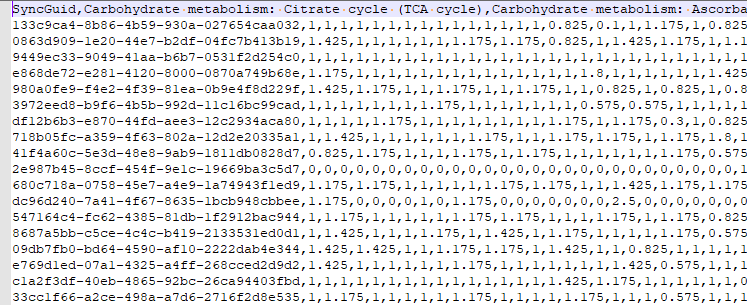
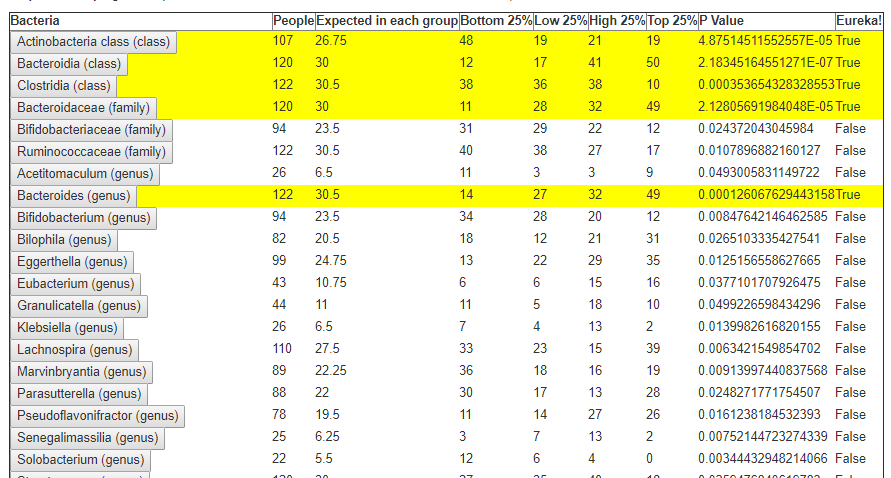
The resulting synthetic microbiome is then processed using the 50%ile as our reference, scaling. The data to be processed may look like this:

Example for Autism

Number of Bacteria Considered: depending on condition: 5- 300 bacteria, typically 30

Advance Suggestions

This is the workhorse which gives many options to both increase and decrease bacteria included. It takes all bacteria (regardless of possible medical significance) as a starting point and adjusts them.

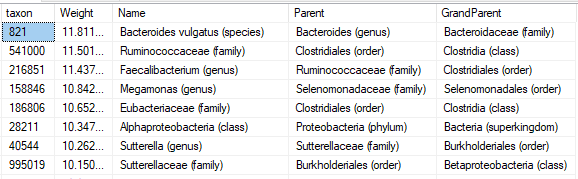
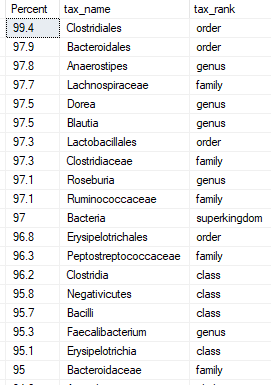
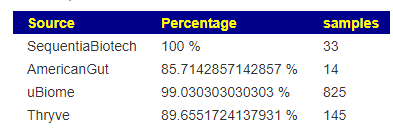
Add in all those I am missing that are seen in % of other samples

No bacteria is seen in every samples. Some people have none of some bacteria and they are concerned about this. This allows you to include very common bacteria that you are missing with a zero value. It is questionable if this philosophical belief have significance. The most common bacteria is listed below.

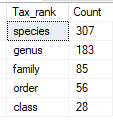
Limit to Taxonomy Rank of ….         

It appears that often the real health significant items are at the lowest level of the bacteria hierarchy. There are good Lactobacillus strains and there are bad Lactobacillus strains (which have been reported to be fatal). This allows you to focus only the bottom levels. The more levels, the more bacteria are targeted – and the greater that ‘noise’ may hide what is significant.

A simple analogy. A kid at a school did some vandalism, you have a vague idea of who (the Species). Do you proceed to punish him with all of his friends (i.e. the Genus)? Do you punish those in classes that he is in (the Family) – keeping all of the classes in for detention. Do you push the entire grade in that school (the Order)? The entire school (the Class). Morale and school performance will change for those impacted.

Number of Taxa at different ranks seen in at least 10% of uploads

Bacteria Selection Choices

This attempted to filter to outliers before the [My Taxa View] was created which allowed hand selection. The philosophical reasoning is that very high and very low are the most probable cause of health issues. This discards bacteria that are in the middle range. You specify if you want to focus only on:

  • top/bottom 6% – Example Count: 6
  • top/bottom 12% – Example Count: 35
  • top/bottom 18% – Example Count: 66

Filter by High Lactic Acid/Lactate Producers

This was a special early request from a reader. It will filters to those bacteria that are lactic acid producers where the values are above the 50%ile. Everything else is excluded. This functionality has been improved using EndProducts Explorer and hand picking the taxa (thus you can do it for any end product in our system). Values are scaled from the difference to the median value.

This was retained because lactic acid issues often result in cognitive impairment, hence a simple route for those people.

Deprecated: Filtering by….

Filtering by medical conditions, symptoms have been deprecated and replaced by hand picked taxa. This allows unlimited combinations of conditions and symptoms to be handled.
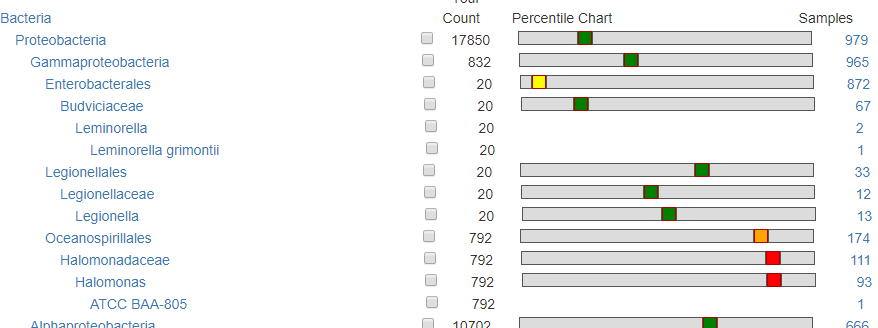
Where to go to pick shifts matching end products, symptoms, medical conditions

My Biome View

This is for people that wishes to ‘eye-ball’ the choice of bacteria. This shows the relative ranking/percentile and how many samples have it. For a bacteria that is seen in only a dozen sample (like Legionellaceae below) or with a count of 100 or less, is unlikely to have any significance.

How are Hand Pick Taxa Handled?

We maintain the same pattern: What is the difference from the median/50%ile (NEVER the average) and we then scale it and feed those values into the suggestion engine.

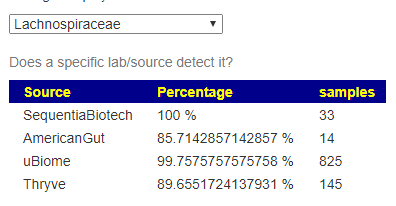
How are Lab Results handled

The original approach of giving every bacteria equal weight has been updated recently. Like with Medical Conditions above, we create a synthetic microbiome using

  • 1 down arrow for 18%ile value
  • 2 down arrow for 12%ile value
  • 2 down arrow for 6%ile value
  • 1 up arrow for 82%ile value
  • 2 up arrow for 88%ile value
  • 3 down arrow for 94%ile value

Bottom Line

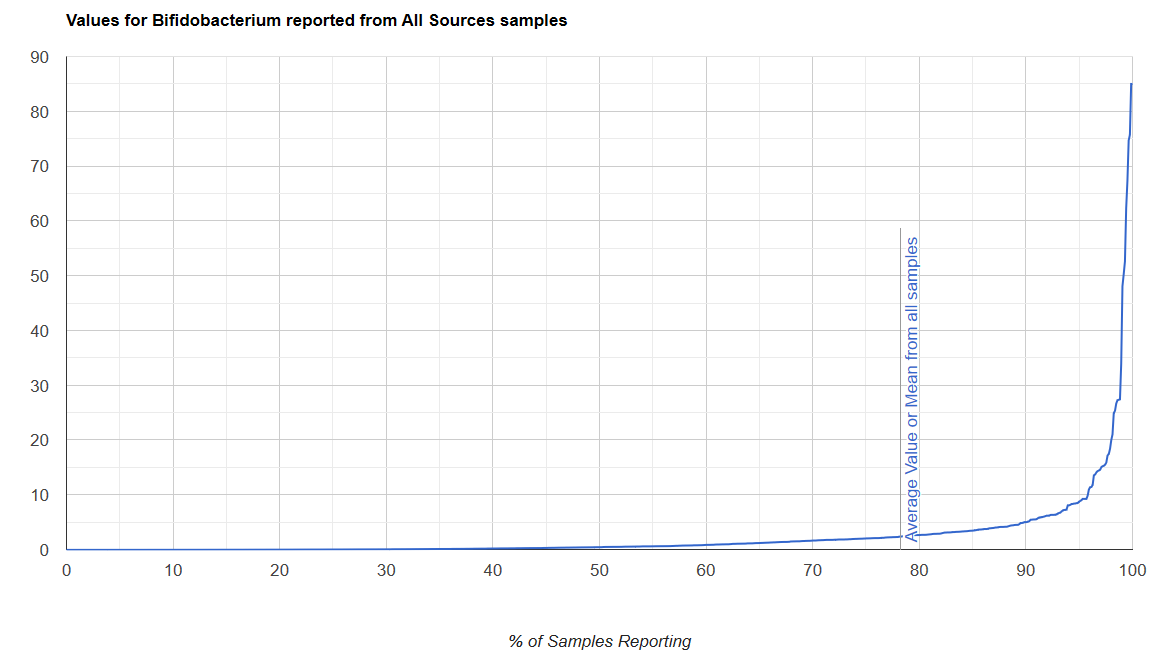
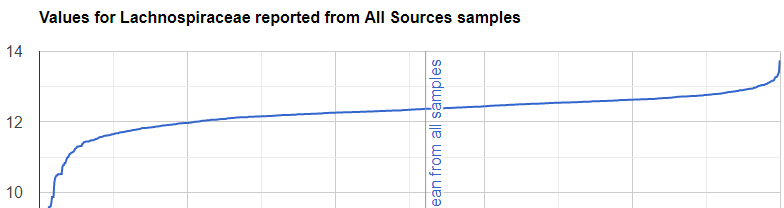
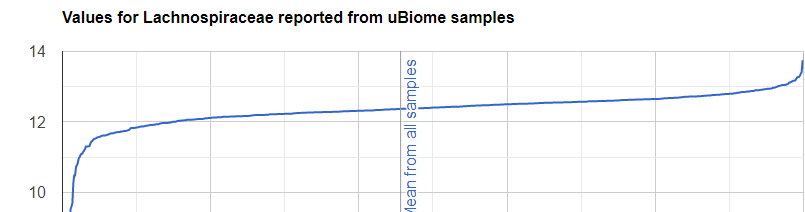
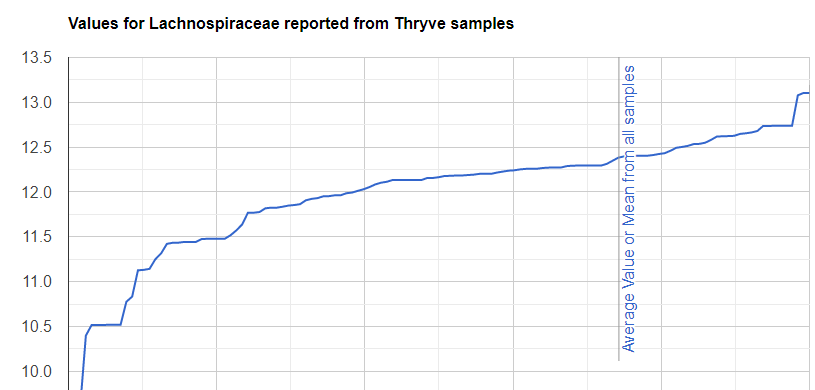
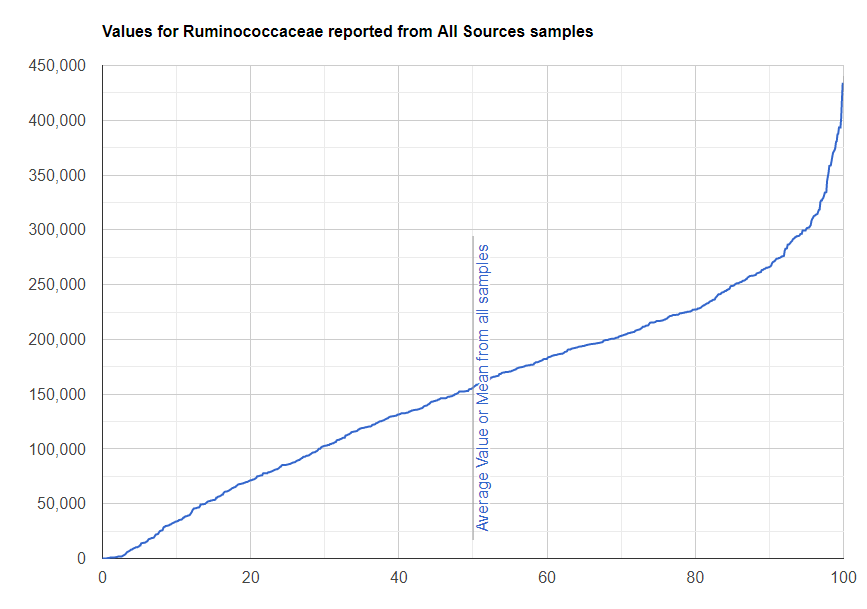
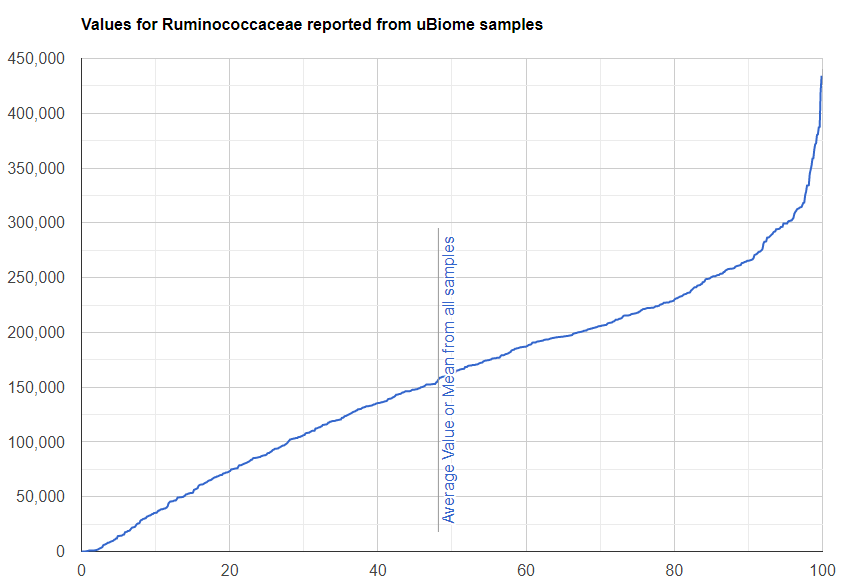
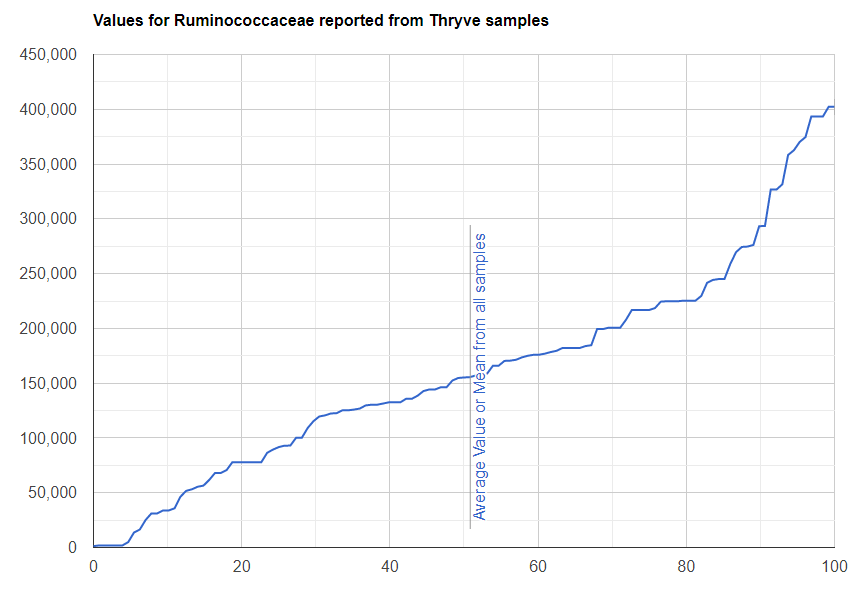
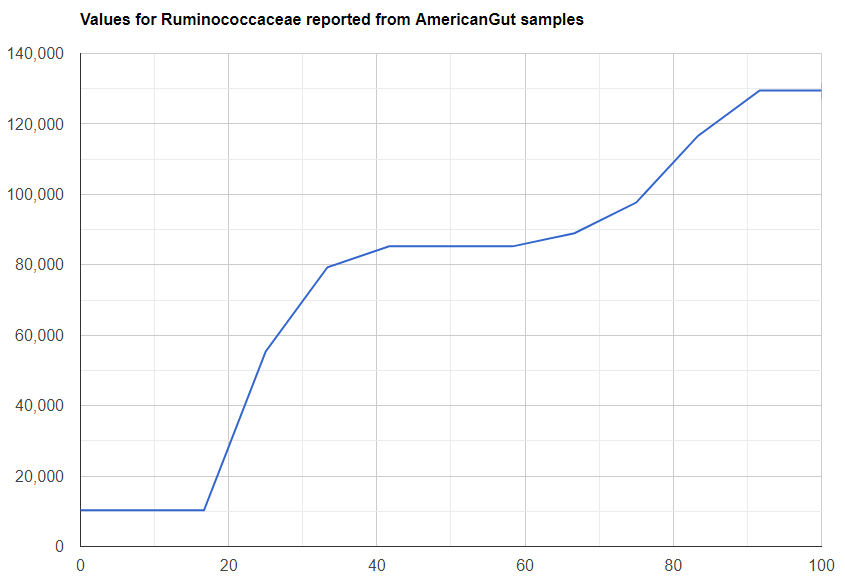
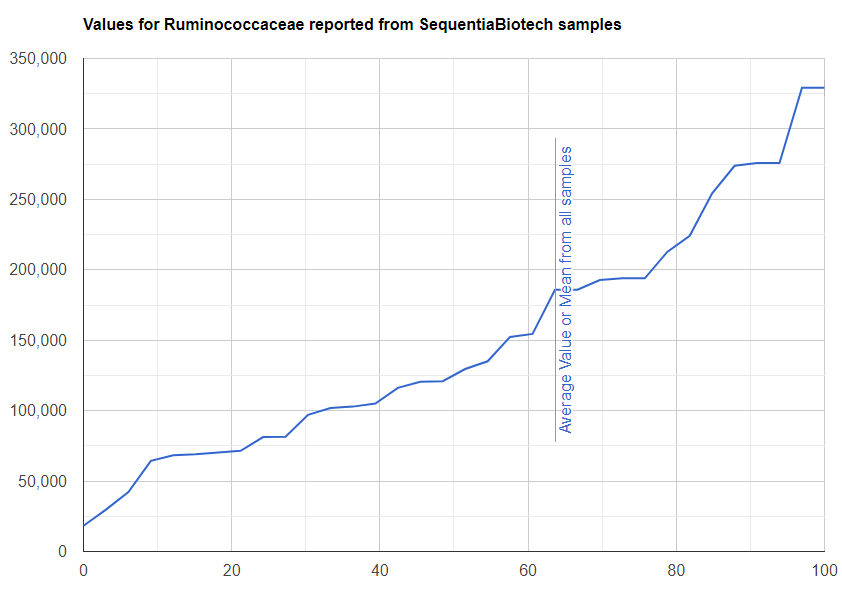
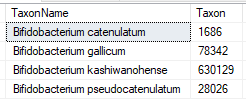
We always use a provided range (Jason Hawrelak) or the difference from the 50%ile/median. We never use Average — and feel that any lab that reference averages do not really understand the data and lack adequate statistical staff. Once upon a time, in the early days we used average but as we got familiar with the data we realized how wrong that approach was — the data is not a bell curve/normal distribution. A simple example is below.

Almost 80% of people have below average counts.

A series of post looking at the microbiome overtime

While the medical condition is autism, the same approach may be applied to other conditions.

  • Technical Study on Autism Microbiome – comparing citizen science to published science. There is little agreement between published studies, but citizen science agrees with some published studies.
  • Child Autism microbiome over time – Part 1 – Using the bacteria taxa identified above, we look at 11 samples over 2 years to see how these key taxa varied.
  • Child Autism microbiome over time – Part 2 – We look at the predicted symptoms for each of these 11 samples and how certain bacteria cluster that are associated with autism
  • End Products and Autism, etc – We look at citizen science identification of end product shifts associated with autism. Often the pattern is not too high Or too low BUT too high and too low — that is, out of balance
  • Child Autism microbiome over time – Part 3 – we examine the end products over the two years and saw that Camel Milk with L.Reuteri made a significant change in the microbiome. A side effect was that Eubacteriaceae started to climb and kept climbing until it was very extreme. This bacteria produces formic acid which alters the pH of the gut and is hostile to many bacteria, including Bifidobacterium.

Distribution Charts by Lab/Source

This is the next step of dealing with the Taxonomy Nightmare before Christmas. On the taxa detail pages, allow people to view the distributions be specific labs. For illustration I will be using Lachnospiraceae http://microbiomeprescription.azurewebsites.net/library/details?taxon=186803 because it is reported in almost all sources.

You will see a new drop down

Log of Values

20% below 12
15% below 12
40% below 12
55% below 12
68% below 12

Actual Values

We will use Ruminococcaceae, http://localhost:42446/library/details?taxon=541000 . Again, something everyone reports

Because most are uBiome, then the shapes above and below are similar
The highest value found was still below the average values of other tests

Bottom Line

There are oddities with some taxa between labs. These charts will help determine better if your readings are atypical or not.

FastQ interpretation between providers

I recall reading reviews of difference of reports by bloggers who took two samples from the same stool and sent them to different analysis labs. There are a dozen possible explanation for those differences.

Due to the demise of uBiome, a number of former users downloaded their FASTQ data files and processed that data through different providers that will determine the bacteria taxonomy from FastQ files. Most of us naively believed that the reports would be similar – after all it is digital data in and thus similar taxonomy would be delivered… It appears that things are a lot more complex than that.

From Standards seekers put the human microbiome in their sights, 2019 https://cen.acs.org/biological-chemistry/microbiome/Standards-seekers-put-human-microbiome/97/i28

What is in a FastQ File

A taxonomy download may be 20-30,000 bytes. This contains the bacteria name and hopefully the taxa number with the percentage or count out of a million. The FastQ file is the result of a machine reading the DNA bits of bacteria in your microbiome. It is a lot bigger. DNA bits are represented by 4 characters (A,T,C,G) The typical data would be 170,000,000 bytes (170 Megs).

If you examine the text, yes text, you will see line after line with:

CCGGACTACTAGGGTTTCTAATCCTGTTTGCTCCCCACGCTTTCGAGCCTCACCGTCAGTTACCGTCCAGTAAGCCGCCTTCGCCACCGGTGTTCTACCCAATATCTACGCATTTCACCGCTACACTGGGTATTCCGCGATCCTCTCCAGA

These strings have been matched to certain bacteria, just like your DNA would match to you (and other people closely related). If you go over the US National Library of Medicine, you will find information on these sequences, like this for Bacillus subtilis , a common probiotic.

So, the process is matching up to a reference set. At this point of time we walk into the time trap!

A firm like uBiome may have gotten the latest values when it was started. I suspect a business decision was made not to constantly update them. Why you ask? The answer is simple, to maintain consistency and comparability from sample to sample over time. If they use newer ones, then they should reprocess the old ones to be consistent, but then reports will change in minor or major ways — resulting in support emails and phone calls. Support can be a major expense. So keep to what we started with. I suspected that with uBiome Plus, they were working on using new reference values, after all it was a different test!!

Each provider has a different set of reference sequences. Their sequences may be proprietary (not in the publish site above). This means that to compare results, you need to use the same reference sequences to match with your FastQ microbiome data. If not, it may result in a “bible” by taking page 1 from King James Bible, page 2 from the Vulgate, page 3 from Tynsdale’s translation, etc. Things become a hash.

Another issue also arises, bacteria get renamed or refined. The names used in an older reference library may not match the names in a latter reference library.

For myself, I have the FastQ for all of my uBiome tests and my Thryve Inside tests. I will continue on requiring these FastQ files from testing firms so I can keep the ability to compare samples to each other overtime by running them through the same provider.

I have created a page to allow comparison between FastQ files processed to taxonomy by different provider. The button to get to it, is at the top of the Samples Page – “FastQ Results Comparison”

image.png

This takes you to a list of all of your samples. Note that I have 4 samples with the same date below. It is actually just 1 FastQ file interpreted by four different providers. There are additional providers.

image.png

This produces a report showing the normalize count (scaled to be per million). I also have the raw count on the page as tool tips over each numbers.

image.png

Who has the right numbers?

Without full disclosure by all of the providers, it is difficult to tell.

With all things equal, the current provider that you are getting samples processed through would be the first choice. Why? it allows you to do immediate comparisons. This is not that critical because both https://www.biomesight.com/and https://metagenomics.sequentiabiotech.com/ will convert a FastQ file to a taxonomy in less than a hour.

What about Research Findings?

Fortunately, researchers use the same process for each study. That means that the results are relatively independent of the process used. It does mean that Study A may find some bacteria are high or low and this is NOT reported in Study B. The why may be very simple, that bacteria was never looked for. Things get fuzzy. With the distribution of bacteria known for a particular method, then we can determine if it is high or low… but that means sufficient samples with that method. With uBiome, we had a large number of samples from this one provider and that allow us to make some good citizen science progress.

Bottom Line on why the difference

  • Different reference libraries
  • Change in bacteria classifications (same sequence, different name)
  • Bugs in software

Atlas Bio Upload Notes

The report file reports only at the strain level, no genus or family levels are given. These total sums up to 100%. The smallest resolution appear to be 0.02% That is 1 in 5,000 bacteria. This is a lot lower resolution than other providers ( 1 in 160,000 is seem in some other reports with a good sample). There is something odd about a large number of bacteria being at 0.02 or 0.04 percent.

While different strains are identified, the naming is not matching the official NCBI name.

It appears that FASTQ downloads from them (alleged to be available if requested) is the prefered way to get better data.

One bacteria was listed as:”(Bifidobacterium catenulatum/Bifidobacterium gallicum/Bifidobacterium kashiwanohense/Bifidobacterium pseudocatenulatum)”

which is with more current tests are 4 different strains.

Bottom Line: Won’t Do

There are too many problems with the data. I have spent almost an entire day fighting it. If they provide a FASTQ file, I have unload for those processed through SequentiaBiotech web site.

To use their CSVs:

  • They must provide the official Taxon Numbers in the Excel File
  • They must provide the full hierarchy with numbers at each level

Without those, their data will pollute the existing contributed base too much. There are no acceptable kludge arounds for these defects.

Exporting data for DataScience

For over a year I have made donated data available at: http://lassesen.com/ubiome/ . I would hope that anyone using open source software project to also be open data.

This post deals with exporting the taxon, continuous and category data to a csv file format suitable for importing to R or Python for data exploration. The program code is simple (with all of the work done in the shared library).

DataInterfaces.ConnectionString = "Server=LAPTOP-BQ764BQT;Database=MicrobiomeV2;Trusted_Connection=True; Connection Timeout=1000";
File.WriteAllLines("DataScience_Taxon.csv", DataInterfaces.GetFlatTaxonomy("species").ToCsvString());
File.WriteAllLines("DataScience_Continuous.csv", DataInterfaces.GetFlatContinuous( ).ToCsvString());
File.WriteAllLines("DataScience_Category.csv", DataInterfaces.GetFlatCategory().ToCsvString());
File.WriteAllLines("DataScience_LabReport.csv", DataInterfaces.GetLabReport().ToCsvString());

The result files examples are shown below:

Source at:

Library update is shown below https://github.com/Lassesen/Microbiome2/tree/master/DataScienceExport

Non Parametric Detection

As we have seen, the microbiome is NOT a normal or bell curve. I struggled for almost a year trying to get statistical significance out of the data with parametric techniques. While I did get some results, the results were disappointing. When I switched to a non-parametric approach, I shouted EUREKA (without becoming a streaker thru town, unlike a certain ancient greek did).

In the last post we dealt with both continuous and category factors associated with a person. In terms of my existing site, using symptom explorer you will see tables such as the one shown below with used 4-quantilies.

In our earlier post on statistics, we saw how we can compute the quantiles for the available taxonomy. In this lesson we will use that data plus a category variable to detect significance as shown above in real time. This means that the results may change as more data is added — to me, this makes it a living research document.

First the Nerd Stuff — Moving to Libraries

For this example, I have consolidated into a library most of the key stuff from prior posts. The class diagram is below. I plan to keep expanding it with future posts.

https://github.com/Lassesen/Microbiome2/tree/master/MicrobiomeLibrary

Computating the non-parametric

This is done by selecting a LabTest (remember that technically we cannot compare uBiome numbers to XenoType numbers to Thryve numbers) and then some Category. I opted not to go down the control group to category group path because with my donated data, it is not reliable. I opted to go down the population to category group path, which while technically less sensitive — it is a reasonable approach.

We need to associate Category and Continuous Reports to Lab Results and this means just adding one new table LabResultReport as shown below, it links two timeline items together.

From the @LabTestId and @CategoryId we just need to select which quantile to use. Did we divide data into 3,4,5,6,7 etc. buckets. If you look at the prior post, we see that it is easy to select which one, “Q3_”, “Q4_”, etc is the @quantileRoot. We need one more value: @MinSamples – if we do not have at reasonable number, there is almost no change of getting significant. I usually require 4 data points per bin — so Q3_ -> 12, Q4_-> 16, Q5->20.

Passing these number to a stored procedure, we get a dataset back as shown below:

  • Quantiles
    • Taxon
    • Count
    • StatisticsValue
    • StatisticsName (i.e. Q3_1,Q3_2 or Q4_1,Q4_2,Q4_3 etc)
  • User Data
    • Taxon
    • Value
  • Taxon Data
    • Taxon
    • TaxonName

The process is simply counting the data in User Data in each range and then applying some simple statistics to get P Values.

In terms of the calling program, the code is very simple:

var data = DataInterfaces.GetNonParametricCategoryDataSet(1, 1, "Q4_", 20);
var matrix = MicrobiomeLibrary.Statistics.NonParametric.CategoricSignficance(data);
matrix.WriteXml("Matrix.xml");

I just dump the data to a file for simplicity sake. You can open this file via excel to get a nice spreadsheet.

For myself, I wrote a long running (24hrs) program that iterated thru the range of values for Categories (and combinations of categories!) with different quantiles.

https://github.com/Lassesen/Microbiome2/tree/master/ConsoleTestLibrary

Homework

When we work with Continuous variables, we need to convert the ranges into quantiles (just like we did for taxon). This could be done using the ranges we entered, or by breaking into quantiles. Personally, using quantiles would be my preference because too many numbers are not bell/normal curves but are assumed to be just that. I will leave people to do pull requests with their code suggestions.

Connecting the dots…

We have a microbiome, we have lab results, we have official conditions (ICD), we have symptoms. Last, we have substances (for example, probiotics) that modify the microbiome and thus may alter:

  • lab results
  • official condition status (i.e. mild, severe, acute)
  • microbiome
  • symptoms (one symptom may disappear or appear)

Information on expected impact of the above come from medical studies.

The typical question is “What should I take to improve {lab results|symptoms|official diagnosis|microbiome}?” The response should be typically, “Base on study A,B,C,K, you should take X to improve {lab results|symptoms|official diagnosis|microbiome}? “

The answers may come indirectly and may be by inference. For example:

I wish to improve my diabetes.

  • Severity of diabetes is connected with high A bacteria and low B bacteria and high levels of TNF-alpha
  • Substance X has no published studies for diabetes
  • Substance X has published studies for decreasing A and not altering B.
  • Substance Y has published studies for increasing B and not altering A but it does reduce TNF-alpha levels.

The inference is that you should consider taking X and Y to improve your diabetes. In some cases, you may find something like:

I wish to improve my mother’s Alzheimer’s Disease.

  • Severity of Alzheimer’s Disease is connected with high A bacteria and low B bacteria.
  • Substance X and Y has published studies for Alzheimer’s Disease showing positive results
  • Substance X has published studies for decreasing A and not altering B.
  • Substance Y has published studies for increasing B and not altering A.

The database schema below attempts to capture this information from citations (studies).

Let us look at what information may be in a study and map the information to tables (following are made up study results for illustrations)

  • Salted Herrings at 20gm/day improves IBS from Study A
    • Modifier: Salted Herring
    • Citation: A
    • ICDCode: IBS
    • ICDModifierCitation
      • DirectionOfImpact: +1
      • AmountOfImpact: NULL — nothing reported
      • UsageInformation: 20gm/day
  • Same study found TNF-Alpha Increases by 20% above control
    • Confinuous Reference: TNF-Alpha
    • ContinousModifierCitation:
      • DirectionOfInpact: +1
      • Amount of Impact: 1.2 (1 being no change)
      • UsageInformation: 20gm/day
  • Same study found Asthma Disappear in 30% of patients
    • CategoryReference: Asthma (Yes or No remember)
      • ContinousModifierCitation:DirectionOfInpact: -1
      • Amount of Impact: 0.8 (1 being no change)
      • UsageInformation: 20gm/day
  • Same study found Sillium bacteria increased in patients
    • TaxonHierarchy: Sillium
      • TaxonModifierCitation:DirectionOfInpact: +1
      • Amount of Impact: nothing reported
      • UsageInformation: 20gm/day

So the results of one study ended up with entries in 4 tables.

We have a lot of possible inferences here:

  • Sillium impacts TNF-Alpha
  • Low Sillium may be associated with Asthma

All of this stuff becomes facts in our Artificial Intelligence/Expert System engine which I will cover in a few weeks.

Alternative Names

Alternative names is actually critical for text mining (i.e. having programs determine if there is important data is a study, paragraph or sentence). Studies may use a multitude of names for the same thing. For example, you may decided to use the latin name for herbs, Hypericum perforatum and then have the alternative names “St. John Wart” and “Saint John Wart”. The alternative names should be unique, hence the unique index is placed on this column.

Bottom Line

Above is the full solution, I have only partially implemented it and the only one of the table that I have been populating has been TaxonModifierCitation. Readers have asked question about TNF-Alpha, Interleukin 10 (IL-10), also known as human cytokine synthesis inhibitory factor (CSIF). My own resources could only stretched to review and processing this table. Ideally, a crowd-source efforts (or a wealthy patron to have Ph.D. students) would allow the full solution to be populated.

Other Medical Properties

Where are we?

  • We have implemented a microbiome reference from ncbi data
  • We have implemented a medical condition reference from ICD
  • We have implement the ability to store personal microbiome values.
  • We have implement the computations on microbiome values (including non-parametrics, i.e. quantiles).

In this post we will look at storing personal medical conditions, lab results and symptoms. Medical parameters change over time, we need to date when these parameters is in effect (just like we date when microbiomes are done). All of the information at a particular time is a Report. I have my draft database diagram below (the SQL is uploaded at

https://github.com/Lassesen/Microbiome2/tree/master/DBV2

We are also going to add two more reference types which are up the user to define. There is no reference sources for these like we have for ICD and NCBI.

At the data modelling level these reference types are:

  • Categoric, effectively Yes or No
    • Do I have this ICD diagnosis?
    • Do I have this symptoms?
    • Am I a male or female?
  • Continuous
    • What is my C-Reactive Protein result?
    • What level is my Vitamin 1,25 D
    • How old am I

I call these items: Continuous Factors and Category Factors. For processing simplicity, instead of giving a choice for eye color of {Brown, Hazel, Blue, Green, Gray, Amber etc) – each is an independent choice (in the database). You could group them in the DisplayGroup as ‘Eye color’ and in the user interface allow only one to be chosen (although some people do have different color eyes!)

You will note that ICDCode is an optional column Category because I expect most sites will only use a subset of them. Having an Id (Integer) makes processing a lot easier for some non-parametric techniques.

Also note that we have Associations, for example, you may to wish to associate certain symptoms with IBS or IL-10 levels with Chronic Fatigue Syndrome. Thus if someone selects IBS, you may wish to present a short list of appropriate symptoms to select from (more on that in a later post – I did a patent filing on that approach years ago).

For the above tables we may wish to classify or group items for the sake of display. With this number of reports (from C-Reactive Protein to Brain Fog to DNA mutations) organizing the presentation on a web site can be a challenge.

On my current implementation, you will see that I have broken things into two large groups:

  • Symptoms
  • uBiome metabolism numbers

For symptoms, I ended up adding an additional layer as shown below. There can be poor UI designs – for example, hitting a person with 300 sequential questions often we result in the questions being only partially completed.

One way of handling a UI hierarchy

For common lab tests, I would suggest using Lab Tests Online as a starting point — remember each laboratory uses slightly different processes and have different reference ranges.

Continuous ranges also have ranges of values (with labels, for example on age: Infant 0-2, Toddler 2-5, Child 5-10, PreTeen 11-12 etc; or for other items: High, Normal, Low). The ranges help with interpretation and may often be used for the first cut with non-parametric techniques.

For symptoms, I strongly suggest for any ICD diagnosis, you search the web for symptoms often seen with each condition.

Bottom Line

Unlike prior tables where we can populate from prepared sources, we have to research, select and populate the table by hand. This can be a time consuming process to do right. Similarly, getting the user interface right is also time consuming.

Detecting Duplicate Uploads

Humans are human. Often a sample will get uploaded multiple times (perhaps the spouse uploaded the same data). Duplicate sample data can generate bias. In this post I will look at detecting duplicates and then eliminating all of them except for one (the last one uploaded). This is a recommended step before computing statistics as discussed in this prior post.

So how do you detect duplicate dataset easily? As a long time SQL developer I can think of some complex left joins and other pain, but as a statistician there is a simple elegant cheat – use standard deviation of the count column to create a hash that uniquely (at least until you get a few billion samples) identifies a sample.

Create Proc RemoveDuplicateUploads As
Declare @Rows int =1
Declare @ToDelete as Table (LabResultsId int)
While @Rows > 0
BEGIN
	Insert into @ToDelete(LabResultsId)
	Select Min(OldestId) From (
		SELECT R.[LabTestId],Min(T.LabResultsId) as oldestId
		, Cast(1000 * STDEV([BaseOneMillion]) as Int) as Hash
		FROM  [dbo].[LabResultTaxon] T (NOLOCK)
		JOIN [dbo].[LabResults] R (NOLOCK)
		ON T.LabResultsId=R.LabResultsId
		Group By R.LabTestId ) HashTable
	Group by Hash, LabTestId Having Count(1) > 1
	-- We cycle until we have deleted all
	SET @Rows=@@ROWCOUNT
	-- We need to delete the taxon before the test
	Delete from [dbo].[LabResultTaxon] Where LabResultsId in (Select LabResultsId from @ToDelete)
	--Now delete the test
	Delete from [dbo].[LabResults] Where LabResultsId in (Select LabResultsId from @ToDelete)
 END

The steps explained:

  • First we get a hash for each test’s measurements (as Hash)
  • Then we find all of the test data for a specific test that have the identical Hash and we have 2 or more tests with those values
  • We insert the OLDEST TestId into a table
  • We then delete the Taxon level data
  • We then delete the Test level data (we can’t delete the test and it’s data is deleted).
  • Once that is done, we repeat because there may be more duplicates – remember we only removed the oldest one.

That’s it. A needed cleanup of donated data to keep our data clean and unique.