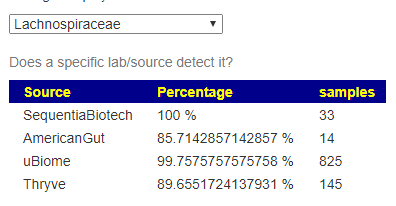
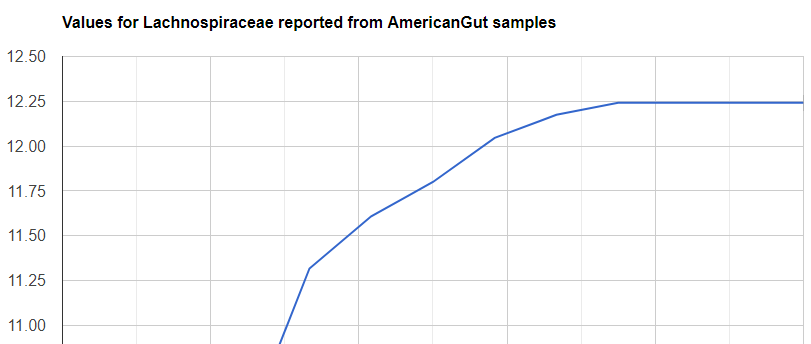
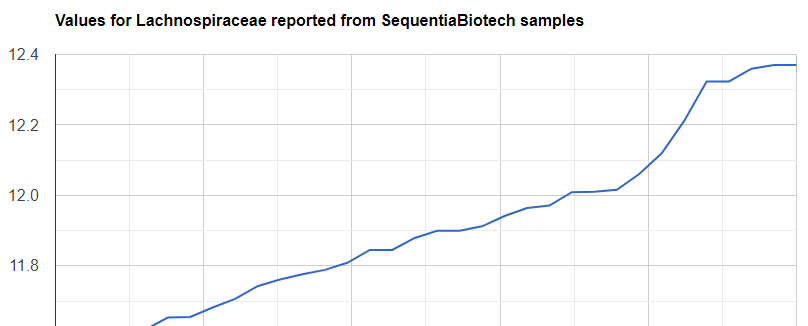
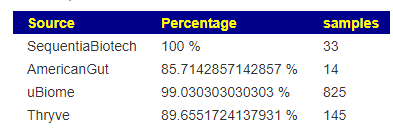
This is the next step of dealing with the Taxonomy Nightmare before Christmas. On the taxa detail pages, allow people to view the distributions be specific labs. For illustration I will be using Lachnospiraceae http://microbiomeprescription.azurewebsites.net/library/details?taxon=186803 because it is reported in almost all sources.
You will see a new drop down
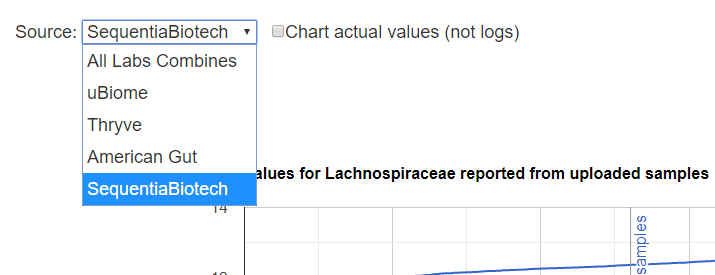
Log of Values
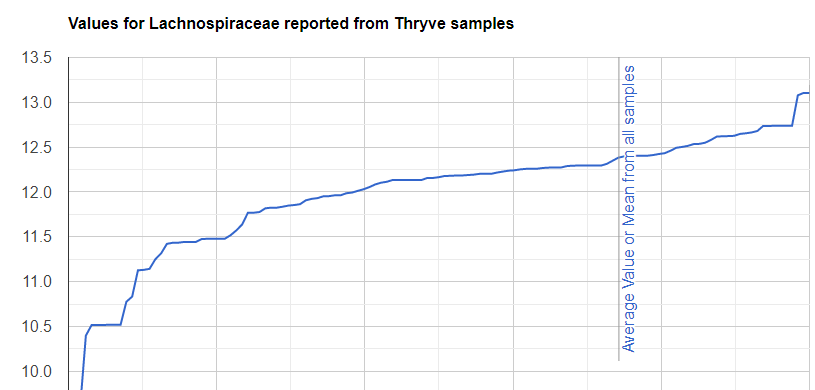
Actual Values
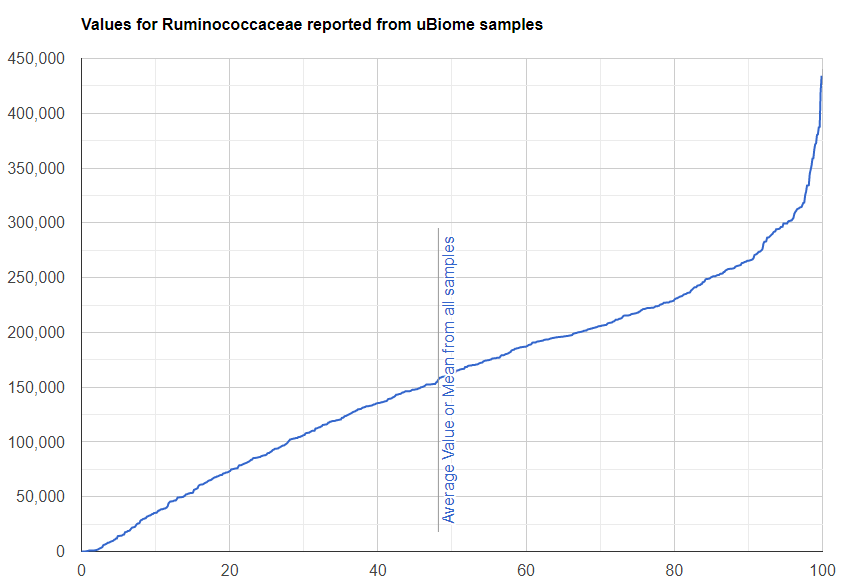
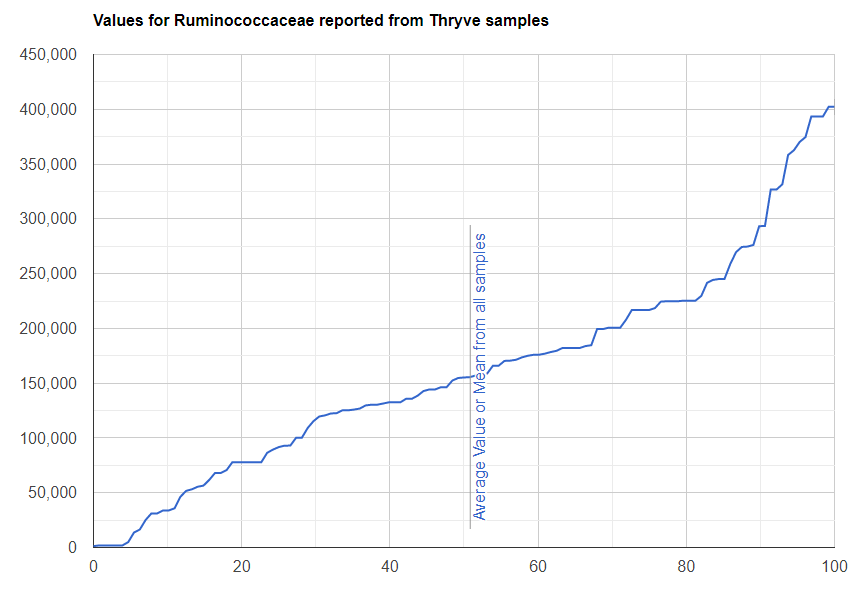
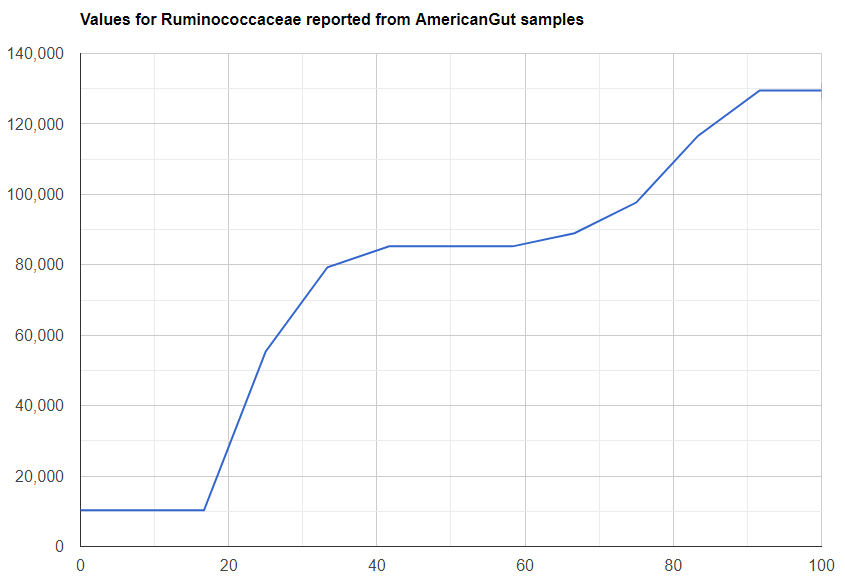
We will use Ruminococcaceae, http://localhost:42446/library/details?taxon=541000 . Again, something everyone reports
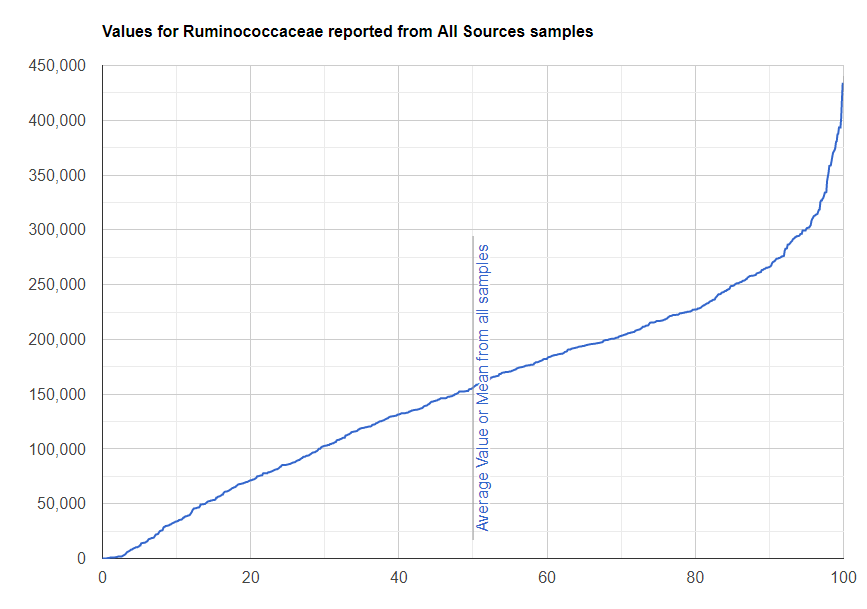
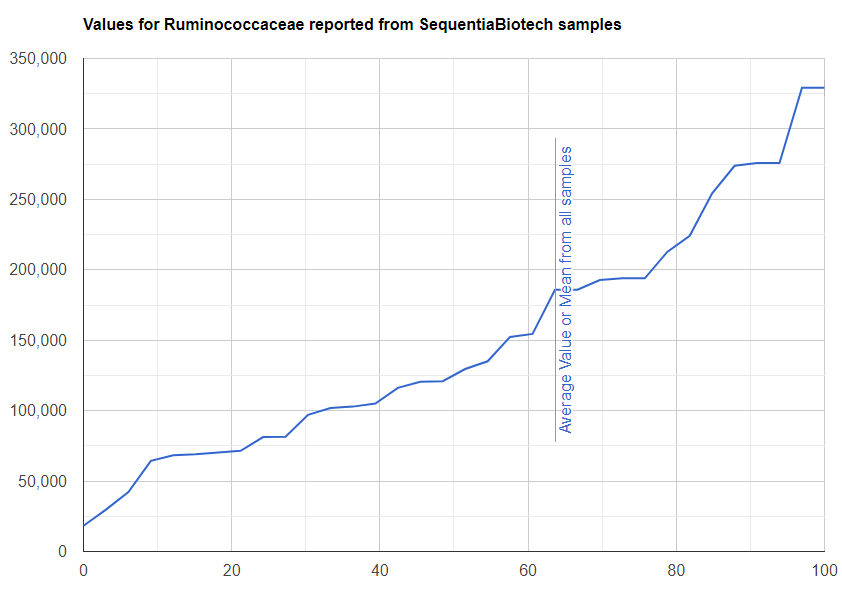
Bottom Line
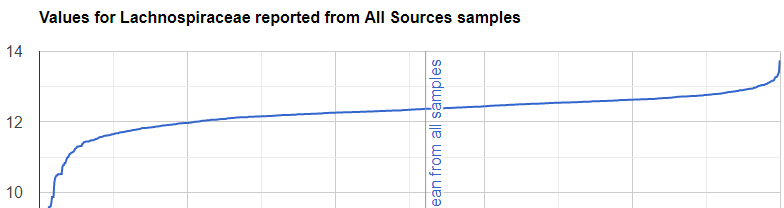
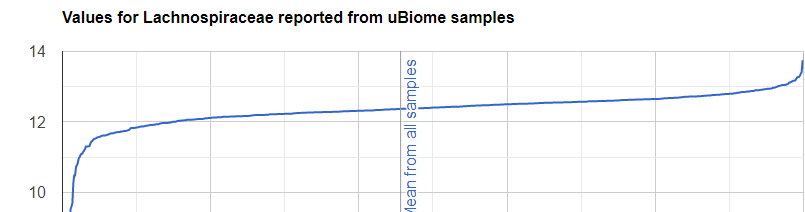
There are oddities with some taxa between labs. These charts will help determine better if your readings are atypical or not.
Recent Comments