A few days ago I posted the results for Bacteria Association (with graphics). I did some operations Research black magic in transforming the data. This black magic is a key part of a patent application that has been filed.
Over the last decade, I have been focused on understanding the statistics of the microbiome bacteria. My multiple degrees are in Probability and Statistics, hence the desire to build mathematical models for the microbiome bacteria.
One of my key observations is that “one model does not fit all taxa“. One observation is very consistent: no bacteria fits the gaussian (normal or bell curves) rendering the use of mean and standard deviation not only suspect, but naively dumb.
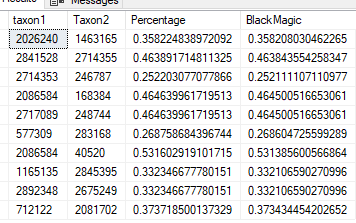
This post exhibits the challenges. We take 1000 Shotgun samples of healthy people using 10 million reads and look for associations by doing classic linear regression. We apply a variety of monotonic increasing transformations to the percentage/counts and see where we get the most relationships with R2 > 0.25.
First Pass Analysis
I decided to see how well “common textbox solutions” would do compared to my “Black Magic” monotonic increasing transformation. If people want to suggest other monotonic increasing transformations, I am very willing to run other transformations on this dataset and add it to this report.
Method
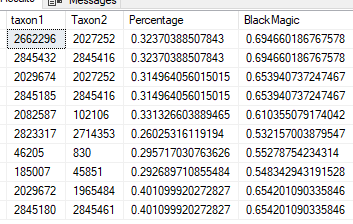
“Black Magic”
Using Percentage / Count
Using Log(Count)
Number of R2 > 0.25
15,183
1,764
9,616
Number with higher R2
1,356
7,167
Number with lower R2
408 [13,827]
2,449 [8016]
Numer of items with R2 > 0.25
The [ ] is the sum of not found and lower R2.We see that the “Black Magic” clearly found more statistically significant relationships. Taken in isolation, “Black Magic” also found more relationships with a higher R2. The Log(Count) items with a higher value are worth some extra analysis.
Percentage or Count
This is the typical naïve approach used by people who rote-learn statistics. We found only 10% of those we got via “Black Magic”. Many relationship were very similar, they tend to be for bacteria with low rates of detection (i.e. occurs in < 25% of samples) and low amounts of bacteria. To translate, very few distinct values in these subsets.
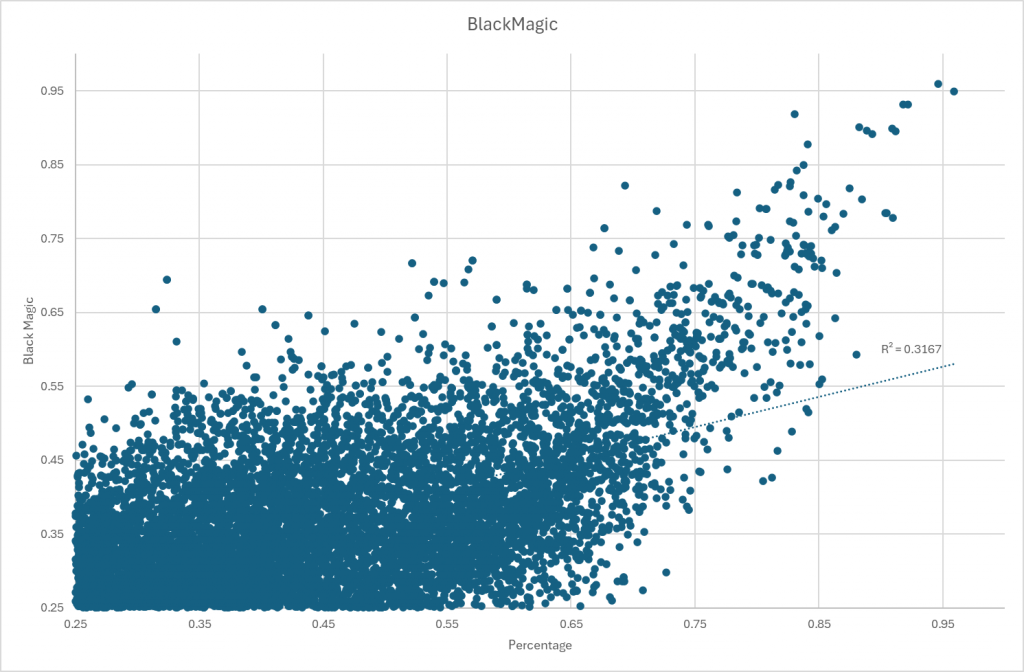
Other has significant differences
A chart comparing results.
Log(Count)
Using a log(values) is a common statistical trick dealing with non-gaussian (normal/bell curve) data to get semi-normal data. For R2 that were higher than “Black Magic” we have:
Mean Difference: 0.23
StdDev Difference: 0.09
Maximum Difference: 0.43
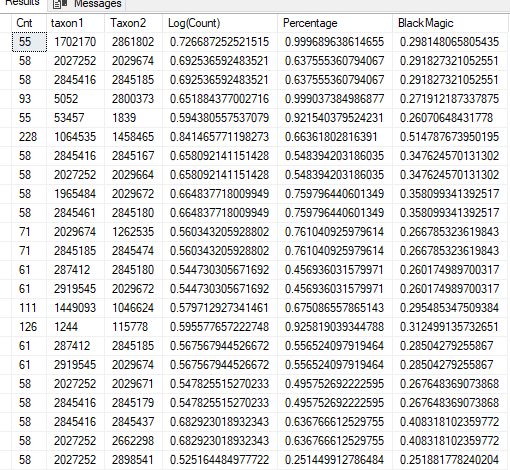
We have a sample of the greatest difference below, and note that the sample size was relatively small. The top line has R2 of 0.999. This suggests that we may need to exclude taxa that has less than N distinct values (a possible follow up post)
Restricting to samples where we have 300 or more (incidence of detection: 30%). In this case Log(Count) with higher R2 exceed those with lower R2 compared to “Black Magic”
Method
“Black Magic”
Using Percentage / Count
Using Log(Count)
Number of R2 > 0.25
10,733
702
8,121
Number with higher R2
494
6130
Number with lower R2
208 [10239]
1991 [4603]
Bottom Line
Log(Count) produces acceptable results while failing to detect 20% of those detected by “Black Magic”. The ideal solution would be to do both methods and take the highest R2 from each regression. I await other suggestions for monotonic increasing transforms to try. It is very clear that using counts / percentage is a poor statistical choice.
There is a follow up post suggested based on the density/sparseness of different values. Having too few distinct values appears to over-fit and produce suspect/false higher R2.
Methane may be reduced by up to 98% by eating a small amount of Red Seaweed. Bromoform in red seaweed inhibits a key enzyme used by microbes to produce methane gas. It is commonly found in red seaweed Asparagopsis taxiformis(Recommended reading)
Asparagopsis is one of the most popular types of limu.[4] in the cuisine of Hawaii, it is principally a condiment.[5] It is known as Limu kohu in the Hawaiian language, meaning “pleasing seaweed”.[6]Limu kohu has a bitter taste, somewhat reminiscent of iodine,[7] and is a traditional ingredient inpoke.
In reviewing the literature on different types of seaweeds, most studies found that they reduced methane. Consumption of common seaweeds supplements or foods are a viable approach. The levels of Bromoform may not be as high, but may be enough to cause changes while generally considered safe to consume..
There are no studies on using seaweed with SIBO that could be located.
L-lactic acid (L-lactate, (S)-lactic acid, or (+)-lactic acid):
This is the form produced in human metabolism, especially during anaerobic glycolysis (when oxygen is limited, such as during intense exercise or tissue hypoperfusion).
L-lactate is the predominant form found in human blood and tissues.
D-lactic acid (D-lactate, (R)-lactic acid, or (−)-lactic acid):
This form is produced mainly by certain bacteria during carbohydrate fermentation, including some gut bacteria.
Humans produce very little D-lactate, but it can accumulate in specific conditions, such as short bowel syndrome, where bacterial overgrowth leads to increased D-lactate production and absorption. Typically this form often manifest itself as Brain Fog.
Lactic acidosis refers to the accumulation of lactic acid in the body, leading to a decrease in blood pH. It is classified based on the underlying cause:
Type A Lactic Acidosis:
Caused by tissue hypoperfusion and hypoxia (lack of oxygen), leading to increased anaerobic metabolism and L-lactate production.
Common in shock (septic, cardiogenic, hypovolemic), severe hypoxemia, or cardiac arrest.
This is the most serious and common form.
Type B Lactic Acidosis:
Occurs without obvious tissue hypoxia or hypoperfusion.
Subdivided into:
Type B1: Associated with underlying diseases (e.g., liver failure, cancer, diabetes).
Type B2: Caused by drugs or toxins (e.g., metformin, antiretrovirals).
Type B3: Due to inborn errors of metabolism or microbiome dysbiosis.
Can also result from intense exercise, seizures, or certain metabolic conditions.
D-Lactic Acidosis:
A rare form caused by excess D-lactate, typically in patients with short bowel syndrome or after certain intestinal surgeries.
Human enzymes cannot efficiently metabolize D-lactate, so it can accumulate and cause neurological symptoms (encephalopathy)
In Home Treatment Options for Normal Acidosis
The common approaches include:
Vitamin B1 or Thiamine : A deficiency of this vitamin can cause lactic acid issues
Water / hydration: Goal is to urinate out the excessive lactic acid
Stop any medication associated, to do this do google search or use perplexity.ai naming your medication or supplement and asking if lactic acidosis can be cause by it. Example below
Treatment Options for d-Lactic Acidosis
“Symptoms typically present after the ingestion of high-carbohydrate feedings. Neurologic symptoms include altered mental status, slurred speech, and ataxia, with patients often appearing drunk. Onset of neurologic symptoms is accompanied by metabolic acidosis and elevation of plasma D-lactate concentration. “
“Treatment includes correcting the acidosis and decreasing substrate for D-lactate such as carbohydrates in meals. In addition, antibiotics can be used to clear colonic flora.”
“Oral antibiotics that are poorly absorbed are most effectively used locally in the gut—these include clindamycin, vancomycin, neomycin, and kanamycin”
“There have been reports as described above regarding probiotics being implicated as a causative agent in a few cases of D-la”
Bottom line for d-Lactic Acidosis
Reduce or eliminate carbohydrates
Antibiotics
Avoid probiotics
Get a detailed microbiome report (ideally shotgun) to identify candidate bacteria and then alter diet appropriately.
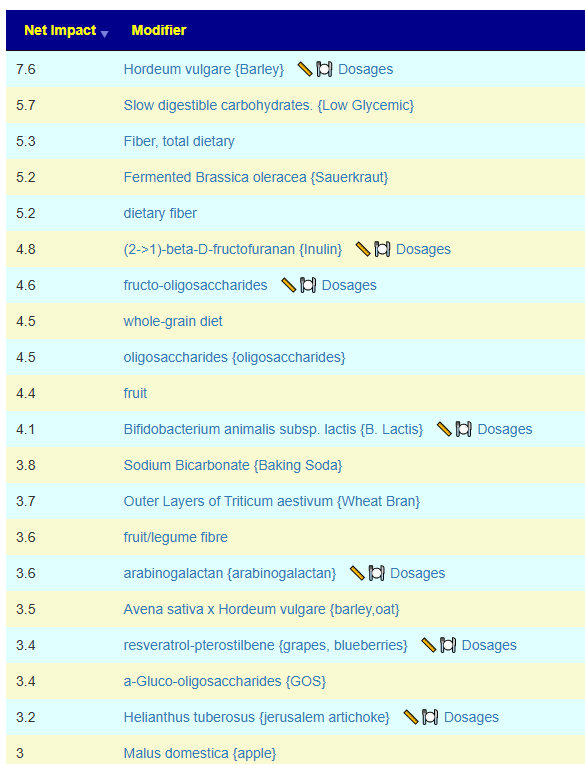
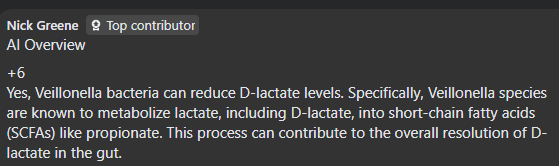
See what encourage it here. MAKE SURE TO EXCLUDE everything that could contain d-lactic producing probiotics (i.e. ANY probiotics, i.e. Yogurt). Items that modifies Veillonella are there.
I’d love some additional help, please. I’ve done two BiomeSight.com tests. I followed the suggestions after the first test and my microbiome has changed and some of my symptoms are improving. However, I couldn’t tolerate any of the bifidobacterium strains I tried, all of them caused very painful long-lasting migraines. Despite taking them for a combined 6wks (3 different strains for 2wks each), my bifidobacterium levels look unchanged. The suggestions do say that ‘No Probiotics without some adverse risks could not be identified.’ so maybe it’s better I just avoid them altogether for now?
I was diagnosed with ME/CFS 16yrs ago, after EBV 22yrs ago.
I caught Covid-19 in 2023.
I was diagnosed with chronic migraines in 2024 – they have increased in severity and occurrence over the last 5yrs, since the Covid-19 vaccines, though I can’t be sure it’s related.
My primary symptoms are: fatigue, pem, migraines, brain fog, ibs, acne, and hair loss.
I give my permission to use the above information anonymously for a blog post.
Analysis
I smiled when I saw ” ‘No Probiotics without some adverse risks could not be identified” and “I couldn’t tolerate any of the bifidobacterium strains I tried“. It seems that the expert system are making good (probable) suggestions. Suggestions are based on odds and not guaranteed.
Pass 1 – Based on Reported Symptoms
When there are many symptoms, my usual path is to get symptoms entered and then get suggestions focused on the bacteria likely associated to those symptoms. This is a targeted approach.
This person had entered any symptoms for their latest sample, and did for the sample from 7 months prior. 4-9 months between samples is what I advocate (balancing costs and time to change the microbiome).
I usually check all of the types of suggestions (I have no ideological position against using any of the types)
Then on the resulting page we see 12 bacteria that are the most likely causes. 2 low and 10 high. Suggestions are computed using five(5) different algorithms and then we use Monte Carlo Model to improve the odds of making good choices. Why different algorithms — simple, microbiome tests are fuzzy in their identification and many different criteria for selecting bacteria are advocated in the literature.
We go to the Consensus Suggestions and sort by Take Count — to get what all agrees about.
Looking at positive 5’s only:
Vitamins
Vitamin B2
Vitamin B1
Zinc
Amino Acid
Melatonin
Carnitine
Glutamine
Taurien
Antibiotic (Only 5’s)
loperamide hydrochloride Loperamide is most commonly used to treat acute and chronic diarrhea, including traveler’s diarrhea and diarrhea associated with inflammatory bowel disease (IBD).
florfenicol. Florfenicol is effective against a wide range of bacterial pathogens in animals, including both Gram-positive and Gram-negative bacteria. It is commonly used to treat respiratory infections, gastrointestinal infections, urinary tract infections, and other bacterial infections in livestock and companion animals
AtorvastatinAtorvastatin belongs to a class of medications known as statins, which work by inhibiting HMG-CoA reductase, an enzyme involved in cholesterol synthesis. By reducing cholesterol production in the liver, atorvastatin helps lower total cholesterol, LDL cholesterol (often referred to as “bad” cholesterol), and triglyceride levels.
It is interesting that Lactobacillus dominate with just one Bifidobacterium. I would carefully try these, one at a time, starting with a low dosage and increases, then change every 1-2 week to the next (keeping notes!!!), My preferred source of probiotics are listed here.
Pass 2 – Based on PubMed
I view this method as less accurate but the suggestions are ideal for discussion with a MD if antibiotics or other prescription items are suggested. It is available as the last item.
Rather than detailing items, I attached the report below
I’ll give this new round of suggestions a go, and then I’ll do another test.
I don’t have a willing GP (or vet, lol) to prescribe antibiotics but it’s very interesting that statins suggested – high cholesterol runs in my family and a lot of them are on statins.
The cholesterol issues are often DNA related… and DNA also impacts the microbiome. DNA is hard to change, the microbiome is easier.
From Perplexity: High cholesterol levels can indeed be influenced by genetic factors, with both common and rare gene variants playing significant roles in LDL cholesterol regulation. Here’s a breakdown of the genetic mechanisms involved:
Key Genes Affecting Cholesterol
LDLR (LDL Receptor) Mutations in this gene (chromosome 19) disrupt LDL cholesterol clearance, causing familial hypercholesterolemia (FH). This autosomal dominant condition leads to lifelong elevated LDL levels (200–300% higher in heterozygotes) due to defective receptor production or function126.
APOB (Apolipoprotein B) Mutations in APOB impair LDL binding to receptors, reducing clearance. For example, the APOB variant causing “familial ligand-defective apoB-100” increases LDL by 200–300%17.
PCSK9 Gain-of-function mutations in this gene degrade LDL receptors excessively, raising LDL levels. Conversely, loss-of-function variants (e.g., in 2% of African Americans) lower LDL by 30% and protect against heart disease168.
E4 carriers have ~5% higher LDL due to rapid lipoprotein clearance and LDLR downregulation.
E2 carriers have ~5% lower LDL but risk familial dysbetalipoproteinemia13.
Inherited Disorders
Familial Hypercholesterolemia (FH): Caused by mutations in LDLR, APOB, or PCSK9. Affects ~1/250 people, leading to LDL >190 mg/dL and premature atherosclerosis if untreated146.
Familial Hypobetalipoproteinemia: APOB mutations reduce LDL production, resulting in very low cholesterol levels13.
Autosomal Recessive Hypercholesterolemia: Rare ARH mutations cause LDL receptor dysfunction, leading to severe cholesterol elevation1.
Polygenic Influences
Most hypercholesterolemia cases involve interactions between multiple common variants (e.g., APOE, NPC1L1) and lifestyle factors. These variants individually exert small effects but collectively contribute to cholesterol variability137.
While genetics set baseline risks, diet and exercise remain critical for management, especially in individuals with predisposing variants368. Genetic testing is recommended for suspected FH to guide early intervention
Postscript – and Reminder
I am not a licensed medical professional and there are strict laws where I live about “appearing to practice medicine”. I am safe when it is “academic models” and I keep to the language of science, especially statistics. I am not safe when the explanations have possible overtones of advising a patient instead of presenting data to be evaluated by a medical professional before implementing.
I cannot tell people what they should take or not take. I can inform people items that have better odds of improving their microbiome as a results on numeric calculations. I am a trained experienced statistician with appropriate degrees and professional memberships. All suggestions should be reviewed by your medical professional before starting.
The answers above describe my logic and thinking and is not intended to give advice to this person or any one. Always review with your knowledgeable medical professional.
Microbiome Prescription has a rich collection of annotated samples from different labs (uBiome, Ombre, Biomesight). The samples are annotated with self declared symptoms from a list of 548 different symptoms/diagnosis. 328 symptoms had statistically significant associations.
Biomesight: 4169 samples
Ombre: 1514 samples
uBiome: 795 samples
There are several possibility of associations to these symptoms, including:
Bacteria Association
Enzyme Association
Metabolite Association which we can decompose into
Production
Substrate (Consumers)
Net Metabolite (Production – Consumer)
For each of these 5 vectors, we use these three statistical methods and set out criteria to p < 0.005:
Fisher’s exact test on prevalence of bacteria
Mann Whitney Wilcoxon Test
t-Test on Means
We used KEGG.JP data as a poor man method of compute metabolites.
Below we have counts of the associations found. It is clear that bacteria associations are weaker(fewer) than Enzymes by a factor of 4-10. With metabolites, the net metabolite appears a poorer estimator than either producers or substrates.
As would be expected, large population, we find more associations as the population increases.
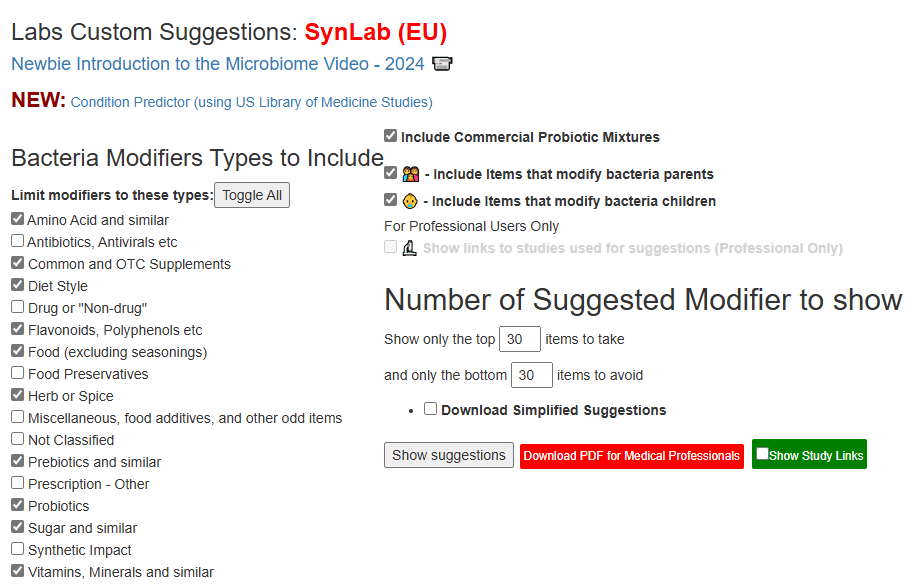
This post deals with lab results that can not be uploaded for anyone of dozens of reasons. the current list is shown below. I am going to do a walkthru in 3 manners for the latest addition SynLab (EU):
The usual best practice is to PRINT the report from the lab and have a pen handy.
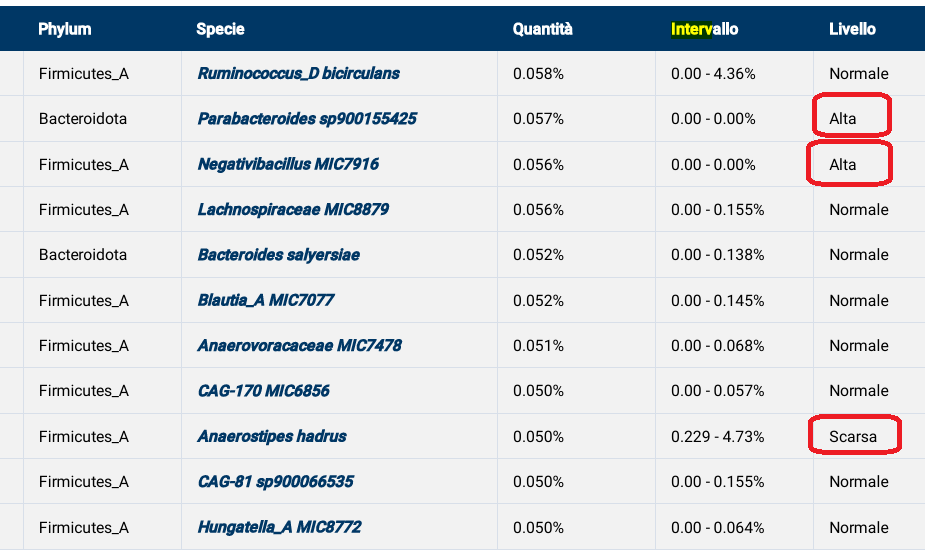
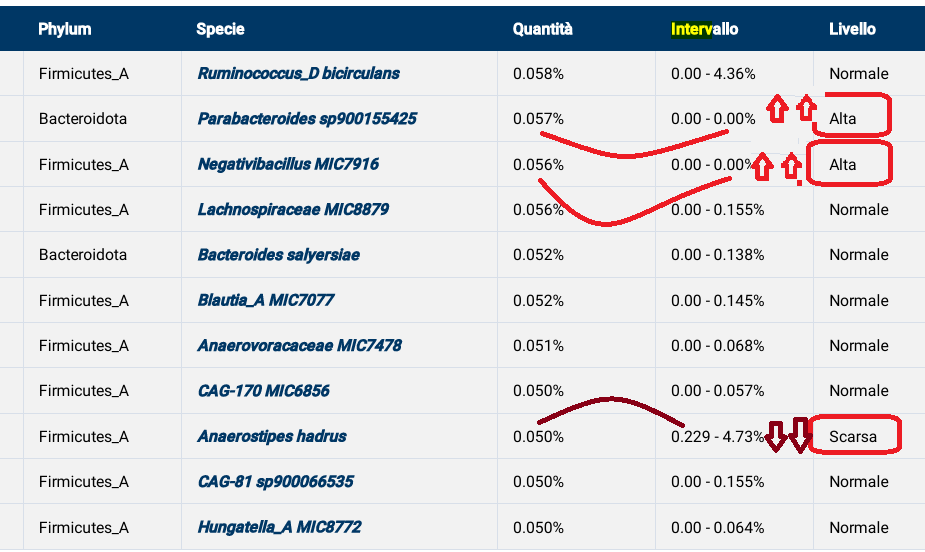
First step is to go thru and circle the high and low.
For High, if you are more than DOUBLE the high of the range, put 2 up arrow
For Low, if you are less than HALF the high of the range, put 2 up arrow
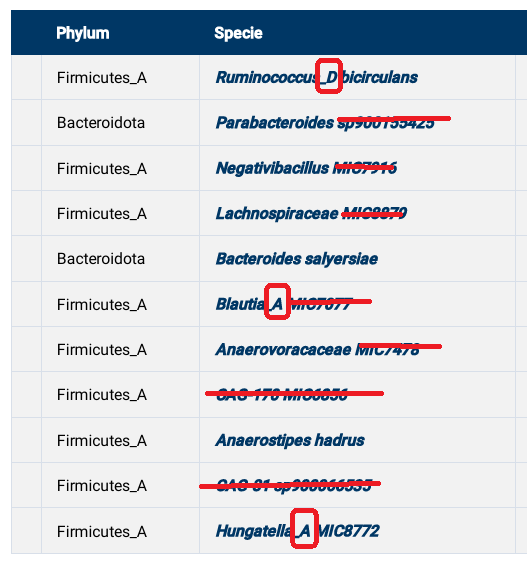
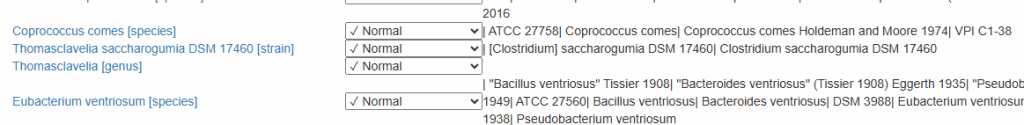
The next step can become a little confusing because the same bacteria may have multiple names – your lab uses one, Microbiome Prescription uses another name. We use the standardized names from the NCBI Taxonomy Browser because those names are used by most labs.
To help resolve this issue, we often list the bacteria in the same sequence as on the report.
Some Reports will list one bacteria at many places which can add to confusion
Some bacteria do not have matches…
CAG names are produced by an alternative naming schema that do not map to any NCBI Ids
Often strains are given, since they do not precisely match, we ignore them and go with the species or genus instead (“closest match”)
For some genus, the alternative schema breaks things down into _A, _B, _C, _D subgroups. We ignore those
Since we are entering ONLY abnormal, then use an that are abnormal when there are many to choose from!
We also give some of the alternative names to the right side. If it is a 2 part name, the second part is usually key to making a match
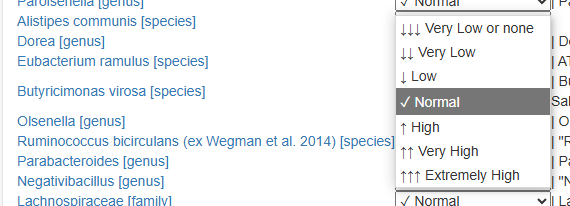
Next we indicate whether the lab says too high or too low. If normal, do nothing. This is made easier if you have a printed copy that has been marked up.
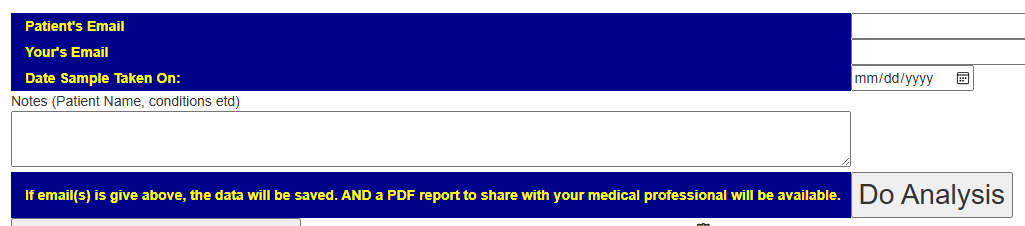
Once you finished entering the data, fill in the bottom. and then clock Do Analysis. You do not need to enter any emails if you wish, but if you want to explore options later, it saves having to re-enter the data.
The Do Analysis will take you to a page to select what type of modifiers you want, etc.
Video using a PC
This is a long video (40 minutes) that does the entire long test results.
We have two self reported symptoms with sufficient samples to explore associations:
Comorbid: Histamine or Mast Cell issues
Official Diagnosis: Mast Cell Dysfunction
I have done simplified tables below. One item that was very interesting is that some Bifidobacterium was too high and others too low. Of the four low bacteria, only Bifidobacterium breve is available commercially. Low Lactobacillus was not reported anywhere and high Lactobacillales is reported
Too High
Bifidobacteriaceae
Bifidobacteriales
Bifidobacterium
Bifidobacterium adolescentis
Bifidobacterium adolescentis JCM 15918
Bifidobacterium angulatum
Bifidobacterium gallicum
Too Low
Bifidobacterium breve
Bifidobacterium catenulatum PV20-2
Bifidobacterium catenulatum subsp. kashiwanohense
Bifidobacterium cuniculi
Everything below is P < 0.005 (or 1 in 200 of happening at random).
Official Diagnosis: Mast Cell Dysfunction
Biomesight
Bacteria
Rank
Shift
Anaerofustis
genus
Too High
Anaerofustis stercorihominis
species
Too High
Luteibacter
genus
Too Low
Luteibacter anthropi
species
Too Low
Ombre
Bacteria
Rank
Shift
Actinomycetes incertae sedis
no rank
Too High
Comamonadaceae
family
Too High
Deinococci
class
Too High
Deinococcota
phylum
Too High
Desulfocella
genus
Too High
Desulfocella halophila
species
Too High
Emticicia
genus
Too High
Hungateiclostridiaceae
family
Too High
Hungateiclostridium
genus
Too High
Limosilactobacillus
genus
Too High
Limosilactobacillus fermentum
species
Too High
Listeria
genus
Too High
Listeriaceae
family
Too High
Methylococcaceae
family
Too High
Methylococcales
order
Too High
Microbacter
genus
Too High
Neisseriaceae
family
Too High
Neisseriales
order
Too High
Oscillatoriales incertae sedis
no rank
Too High
Paracoccaceae
family
Too High
Pseudoscillatoria
genus
Too High
Pseudoscillatoria coralii
species
Too High
Rickettsia
genus
Too High
Slackia heliotrinireducens
species
Too High
Sphingobacterium
genus
Too High
Staphylococcus
genus
Too High
unclassified Burkholderiales
family
Too High
unclassified Clostridiales
family
Too High
Varibaculum
genus
Too High
Comorbid: Histamine or Mast Cell issues
We have a lot more annotated samples on this self-reported symptoms. There is fuzziness between a pure histamine issue and a mast cell issue
Ombre
Bacteria
Rank
Shift
Absiella tortuosum
species
Too High
Actinomycetes incertae sedis
no rank
Too High
Actinopolysporales
order
Too High
Agaribacter
genus
Too High
Agaribacter marinus
species
Too High
Anaeromicropila
genus
Too High
Anaeromicropila populeti
species
Too High
Blastocatellia
class
Too High
Cerasicoccus frondis
species
Too High
Clostridium grantii
species
Too High
Comamonadaceae
family
Too High
Cryomorphaceae
family
Too High
Deinococci
class
Too High
Deinococcota
phylum
Too High
Desulfitobacteriaceae
family
Too High
Desulfitobacterium
genus
Too High
Desulfobacteriaceae
family
Too High
Desulfocella
genus
Too High
Desulfocella halophila
species
Too High
Desulfofarcimen acetoxidans
species
Too High
Desulfosporosinus
genus
Too High
Desulfuromonadaceae
family
Too High
Desulfuromonadia
class
Too High
Emticicia
genus
Too High
Fusibacter
genus
Too High
Gammaproteobacteria incertae sedis
no rank
Too High
Halopolyspora
genus
Too High
Halopolyspora alba
species
Too High
Holdemania massiliensis
species
Too High
Hydrogenibacillus
genus
Too High
Hydrogenibacillus schlegelii
species
Too High
Limosilactobacillus
genus
Too High
Limosilactobacillus fermentum
species
Too High
Listeria
genus
Too High
Listeriaceae
family
Too High
Mesomycoplasma conjunctivae
species
Too High
Methylococcaceae
family
Too High
Microbacter
genus
Too High
Microbacter margulisiae
species
Too High
Mzabimycetaceae
family
Too High
Neisseriaceae
family
Too High
Neisseriales
order
Too High
Nostocales
order
Too High
Odoribacter laneus
species
Too High
Oscillatoriales incertae sedis
no rank
Too High
Oscillibacter valericigenes
species
Too High
Paracoccaceae
family
Too High
Parasporobacterium
genus
Too High
Pedobacter
genus
Too High
Planctomycetales
order
Too High
Planctomycetia
class
Too High
Planctomycetota
phylum
Too High
Pontibacillus
genus
Too High
Pontibacillus halophilus
species
Too High
Porphyromonas somerae
species
Too High
Propioniferax
genus
Too High
Propioniferax innocua
species
Too High
Proteinivorax tanatarense
species
Too High
Pseudoramibacter
genus
Too High
Pseudoramibacter alactolyticus
species
Too High
Pseudorhodobacter
genus
Too High
Pseudoscillatoria
genus
Too High
Pseudoscillatoria coralii
species
Too High
Rhodocyclaceae
family
Too High
Rhodocyclales
order
Too High
Rickettsia
genus
Too High
Rickettsiaceae
family
Too High
Rickettsiales
order
Too High
Rickettsieae
tribe
Too High
Saccharofermentans
genus
Too High
Saccharofermentans acetigenes
species
Too High
Sedimentibacter
genus
Too High
Sphingobacterium
genus
Too High
spotted fever group
species group
Too High
Stackebrandtia nassauensis
species
Too High
Stomatobaculum
genus
Too High
Texcoconibacillus
genus
Too High
Texcoconibacillus texcoconensis
species
Too High
Thiohalobacter
genus
Too High
Thiohalobacter thiocyanaticus
species
Too High
Thiohalobacteraceae
family
Too High
Thiohalobacterales
order
Too High
Thiohalorhabdaceae
family
Too High
Thiohalorhabdales
order
Too High
Verrucomicrobiaceae
family
Too High
Weeksellaceae
family
Too High
Biomesight
Bacteria
Rank
Shift
Acidaminococcus
genus
Too Low
Acidaminococcus fermentans
species
Too Low
Actinomycetes
class
Too High
Actinomycetota
phylum
Too High
Amedibacillus
genus
Too High
Amedibacillus dolichus
species
Too High
Anaerobranca
genus
Too High
Anaerobranca zavarzinii
species
Too High
Anaerolinea
genus
Too High
Anaerolinea thermolimosa
species
Too High
Anaerolineaceae
family
Too High
Anaerolineales
order
Too High
Anaerotruncus
genus
Too Low
Anaerotruncus colihominis
species
Too Low
Archaea
superkingdom
Too Low
Atopobium fossor
species
Too Low
Azoarcus
genus
Too High
Bacteroidaceae
family
Too Low
Bacteroides
genus
Too Low
Bacteroides acidifaciens
species
Too Low
Bacteroides cellulosilyticus
species
Too Low
Bacteroides fluxus
species
Too Low
Bacteroides uniformis
species
Too Low
Bifidobacteriaceae
family
Too High
Bifidobacteriales
order
Too High
Bifidobacterium
genus
Too High
Bifidobacterium adolescentis
species
Too High
Bifidobacterium adolescentis JCM 15918
strain
Too High
Bifidobacterium angulatum
species
Too High
Bifidobacterium breve
species
Too Low
Bifidobacterium catenulatum PV20-2
strain
Too Low
Bifidobacterium catenulatum subsp. kashiwanohense
subspecies
Too Low
Bifidobacterium cuniculi
species
Too Low
Bifidobacterium gallicum
species
Too High
Bilophila
genus
Too Low
Bilophila wadsworthia
species
Too Low
Blautia
genus
Too Low
Caloramator mitchellensis
species
Too High
Candidatus Tammella caduceiae
species
Too High
Catenibacterium
genus
Too High
Catenibacterium mitsuokai
species
Too High
Cetobacterium
genus
Too High
Chloroflexota
phylum
Too High
Coprococcus
genus
Too High
Coprococcus eutactus
species
Too High
Coraliomargarita
genus
Too High
Coraliomargarita
genus
Too Low
Coraliomargarita akajimensis
species
Too High
Coraliomargarita akajimensis
species
Too Low
Coraliomargaritaceae
family
Too High
Coraliomargaritaceae
family
Too Low
Deferribacter
genus
Too High
Deferribacter autotrophicus
species
Too High
Deferribacteraceae
family
Too High
Deferribacterales
order
Too High
Deferribacteres
class
Too High
Deferribacterota
phylum
Too High
Desulfitobacterium
genus
Too Low
Desulfomonilaceae
family
Too High
Desulfomonilales
order
Too High
Desulfomonilia
class
Too High
Desulforamulus
genus
Too High
Ectothiorhodospira imhoffii
species
Too High
Entomoplasmataceae
family
Too Low
Entomoplasmatales
order
Too Low
Eubacterium limosum
species
Too High
Euryarchaeota
phylum
Too Low
Faecalibacterium
genus
Too High
Fusobacterium nucleatum
species
Too High
Hathewaya
genus
Too Low
Hathewaya histolytica
species
Too Low
Helicobacter
genus
Too High
Helicobacter
genus
Too Low
Helicobacteraceae
family
Too High
Helicobacteraceae
family
Too Low
Holdemanella
genus
Too High
Holdemanella biformis
species
Too High
Holdemania
genus
Too Low
Hoylesella loescheii
species
Too High
Hyphomicrobiales
order
Too High
Hyphomicrobiales
order
Too Low
Johnsonella
genus
Too Low
Johnsonella ignava
species
Too Low
Lachnobacterium
genus
Too High
Lactobacillales
order
Too High
Lactococcus
genus
Too High
Limosilactobacillus
genus
Too Low
Luteibacter
genus
Too High
Luteibacter anthropi
species
Too High
Lysobacter deserti
species
Too High
Mesoplasma
genus
Too Low
Mesoplasma entomophilum
species
Too Low
Methanobacteria
class
Too Low
Methanobacteriaceae
family
Too Low
Methanobacteriales
order
Too Low
Methanobrevibacter
genus
Too Low
Methanobrevibacter smithii
species
Too Low
Methanomada group
clade
Too Low
Mogibacterium vescum
species
Too High
Mollicutes
class
Too High
Mycobacteriaceae
family
Too High
Mycobacterium
genus
Too High
Mycoplasmatota
phylum
Too High
Myxococcales
order
Too High
Myxococcia
class
Too High
Myxococcota
phylum
Too High
Natranaerobiales
order
Too High
Pedobacter
genus
Too Low
Phascolarctobacterium faecium
species
Too Low
Phocaeicola
genus
Too Low
Phocaeicola massiliensis
species
Too High
Phocaeicola paurosaccharolyticus
species
Too Low
Polyangia
subclass
Too High
Prevotella dentasini
species
Too High
Prevotellaceae
family
Too High
Prosthecobacter
genus
Too High
Proteinivoraceae
family
Too High
Ruminococcus callidus
species
Too High
Schaalia naturae
species
Too High
Segatella
genus
Too High
Segatella copri
species
Too High
Segatella paludivivens
species
Too High
Shewanella upenei
species
Too High
Slackia
genus
Too High
Slackia isoflavoniconvertens
species
Too Low
Sphingobium
genus
Too High
Sutterella stercoricanis
species
Too High
Syntrophales
order
Too High
Syntrophia
class
Too High
Syntrophomonadaceae
family
Too High
Thermus
genus
Too High
Thiothrix ramosa
species
Too High
Bottom Line
The above data will eventually be incorporated into the expert system suggestions on Microbiome Prescription.
The process is very simple, for a condition like ME/CFS, we compute the expected number of samples reporting this bacteria (based on people without Long COVID) and compare it to the actual number seen. This can be used to compute a statistical value called Chi-Square (χ²), This is then used to compute the chance of it happening at random. This is possible because we have over 3600 samples from some labs and thus able to detect things better.
Actual example:
Tetragenococcus halophilus – Species reported by Biomesight
Expected to see 15
Actually seen 59
In other words almost 4x more common than expected. The probability is
1.68054690853052E-30
or 1 chance in 600,000,000,000,000,000,000,000,000,000 of happening at random.
This suggests that we should reduce it to remedy Long COVID [with the other 92 bacteria involved]
Biomesight and Ombre identifies bacteria using different methodologies so often give different names and amounts. For background on this lack of standardization, see The taxonomy nightmare before Christmas…
The data below is for samples marked with “Official Diagnosis: COVID19 (Long Hauler)”. Only Biomesight had sufficient data to get patterns.
Unlike some conditions shown below, it is not just one bacteria involved but combinations.
Peptic ulcer disease: Helicobacter pylori
Tetanus: Clostridium tetani
Typhoid fever: Salmonella typhi
Diphtheria: Corynebacterium diphtheriae
Syphilis: Treponema pallidum
Cholera: Vibrio cholerae
Leprosy: Mycobacterium leprae
Tuberculosis: Mycobacterium tuberculosis
Sinusitis: Corynebacterium tuberculostearicum
Biomesight Data
We have more data from Biomesight which means better (more) detection of significant bacteria. The data is very different from ME/CFS. We have 16 bacteria too high and 61 bacteria too low. With ME/CFS and the same lab, we have 12 bacteria that are too low and 116 bacteria that are too high.
We have some commonalities
Bifidobacterium adolescentis is too low for both Long COVID and ME/CFS
Lactobacillus crispatus is too high
Another probiotic genus, Lactococcus, is also too high
Tax_Name
Tax_Rank
Expected
Observed
Shift
Probability
50 kb inversion clade
clade
77.3
54
Too Low
0.008002
Acinetobacter antiviralis
species
13.7
24
Too High
0.00524
Acinetobacter johnsonii
species
18.1
30
Too High
0.004944
Actinopolyspora
genus
62.3
35
Too Low
0.001477
Actinopolysporaceae
family
62.3
35
Too Low
0.001477
Actinopolysporales
order
62.3
35
Too Low
0.001477
Aeromonadaceae
family
81.8
57
Too Low
0.006169
Alkalibacterium
genus
112.5
81
Too Low
0.005041
Anaerococcus lactolyticus
species
23.2
38
Too High
0.002205
Anaerococcus prevotii
species
20.1
33
Too High
0.003987
ant, tsetse, mealybug, aphid, etc. endosymbionts
clade
82.7
58
Too Low
0.006624
Bifidobacterium adolescentis
strain
103.5
65
Too Low
0.002509
Chromatium
genus
61.3
34
Too Low
0.00355
Chromatium weissei
species
61.2
34
Too Low
0.00355
Chromobacterium group
no rank
15.3
26
Too High
0.006127
Citrobacter
genus
64.1
41
Too Low
0.003939
Clostridium neonatale
species
13.7
25
Too High
0.002196
Cohnella
genus
108.6
78
Too Low
0.005067
Coraliomargarita
genus
96.4
70
Too Low
0.00718
Coraliomargarita akajimensis
species
96.3
70
Too Low
0.007357
core genistoids
clade
77.3
54
Too Low
0.008002
Corynebacterium striatum
species
16.9
28
Too High
0.006887
Crotalarieae
tribe
77.3
54
Too Low
0.008002
Deferribacteraceae
family
98.2
71
Too Low
0.006129
Deferribacterales
order
98.2
71
Too Low
0.006129
Deferribacteres
class
98.2
71
Too Low
0.006129
Deferribacterota
phylum
98.2
71
Too Low
0.006129
Desulfallaceae
family
148.6
108
Too Low
0.001472
Enterobacter cloacae complex
species group
86.4
60
Too Low
0.004516
Enterobacter hormaechei
species
85.4
57
Too Low
0.002134
Enterobacteriaceae incertae sedis
no rank
82.7
58
Too Low
0.006624
Erysipelothrix inopinata
species
54.2
21
Too Low
4.45E-05
Fabaceae
family
77.3
54
Too Low
0.008002
Fabales
order
77.3
54
Too Low
0.008002
fabids
clade
77.3
54
Too Low
0.008002
genistoids sensu lato
clade
77.3
54
Too Low
0.008002
Granulicella
genus
16.4
29
Too High
0.001841
Granulicella tundricola
species
16.2
29
Too High
0.00148
Hallella bergensis
species
20.1
33
Too High
0.003987
Lactobacillus crispatus
species
26.5
43
Too High
0.001406
Lactococcus
genus
161.5
201
Too High
0.001877
Leptospira
genus
89.5
61
Too Low
0.002559
Leptospira licerasiae
species
89.4
61
Too Low
0.002701
Leptospiraceae
family
89.5
61
Too Low
0.002559
Leptospirales
order
89.5
61
Too Low
0.002559
Lysinibacillus
genus
51.5
32
Too Low
0.006618
Lysinibacillus parviboronicapiens
species
50.4
29
Too Low
0.002564
Macrococcus
genus
118.9
89
Too Low
0.006111
Microbacteriaceae
family
99.5
72
Too Low
0.005912
Moorella group
norank
152.6
188
Too High
0.004132
Oxalobacter
genus
130.9
99
Too Low
0.005356
Oxalobacter vibrioformis
species
94.9
65
Too Low
0.007793
Papilionoideae
subfamily
77.3
54
Too Low
0.008002
Peptoniphilus lacrimalis
species
51.8
72
Too High
0.004884
Piscirickettsiaceae
family
51.5
29
Too Low
0.007262
Psychrobacter
genus
138.9
99
Too Low
0.001332
Psychrobacter glacialis
species
75.1
51
Too Low
0.00545
rosids
clade
77.3
54
Too Low
0.008002
Rothia
genus
77.3
54
Too Low
0.008002
Rothia mucilaginosa
species
64.1
40
Too Low
0.002631
Sporotomaculum
genus
148.6
108
Too Low
0.001472
Sporotomaculum syntrophicum
species
146.7
107
Too Low
0.001751
Streptococcus massiliensis
species
53.6
34
Too Low
0.007353
Syntrophobacteraceae
family
118.3
83
Too Low
0.00291
Tetragenococcus halophilus
species
18.0
59
Too High
3.63E-22
Thiomicrospira
genus
43.7
26
Too Low
0.007396
Tolumonas
genus
80.7
55
Too Low
0.004169
Tolumonas auensis
species
79.9
54
Too Low
0.003748
Trabulsiella
genus
59.1
37
Too Low
0.004074
Vagococcus
genus
99.2
72
Too Low
0.00718
Varibaculum cambriense
species
17.3
30
Too High
0.002302
Bottom Line
My personal view is that this pattern is not unexpected. ME/CFS microbiome is typically after years of the dysbiosis microbiome evolving. With Long COVID, we have the microbiome still trying to stabilize.
Bif. Adolescentis
And all Lactobacillus and Lactococcus probiotics should be avoided.
The above information will be eventually integrated into Microbiome Prescription suggestions expert system. The purpose is to first identify the bacteria of concern.
The following bacteria were reported by 2 or 3 of the ME/CFS analysis and the same shift seen with Long COVID.
Anaerococcus murdochii
species — sibling high in ME/CFS
Peptoniphilus lacrimalis
species – HIGH EVERYWHERE
Varibaculum
genus – HIGH EVERYWHERE
Varibaculum, particularly Varibaculum cambriense, has been identified as a potential pathogen associated with various human infections, especially in skin and soft tissues26. This anaerobic, gram-positive bacterium was first described in 2003 and has since been isolated from several clinical cases2.
A new species, Varibaculum timonense, has been isolated from human stool samples, indicating that the genus Varibaculum may have a broader presence in the human microbiome than previously recognized3.
While Varibaculum species are not yet widely known pathogens, their isolation from various infection sites suggests they may play a more significant role in human health than currently understood. Further research is needed to fully elucidate the pathogenic potential and clinical importance of these bacteria.
The process is very simple, for a condition like Long COVID, we compute the expected number of samples reporting this bacteria (based on people without Long COVID) and compare it to the actual number seen. This can be used to compute a statistical value called Chi-Square (χ²), This is then used to compute the chance of it happening at random. This is possible because we have over 3600 samples from some labs and thus able to detect things better.
Actual example:
Tetragenococcus halophilus – Species reported by Biomesight
Expected to see 15
Actually seen 59
In other words almost 4x more common than expected. The probability is
1.68054690853052E-30
or 1 chance in 600,000,000,000,000,000,000,000,000,000 of happening at random.
This suggests that we should reduce it to remedy Long COVID [with the other 92 bacteria involved]


Recent Comments