For other analysis for ME/CFS see this list.
Concerns
“For the Ombre/Thryve sample data, dated 12/31/24, I found the following:
- Rickettsiales – order – 31%ile High
- Rickettsiaceae – family – 34%ile High
- Rickettsieae – tribe – 34%ile High
- Parasutterella excrementihominis – species – 69%ile High
The reason these bacteria stand out to me are because my CFS journey,
like many, began with a Lyme diagnosis 20 years ago.
And as testing and research improved, Lyme became synonymous with
“co-infections” like Rickettsia and Ehrlichia and a whole host of
others in the “Lyme Soup”.”
Parasutterella excrementihominis has been present in all samples, varying from 61-89%ile. For Rickettsiaceae, we see in much older samples
- 2022-04-11 at 6%ile
- 2022-11-01 at 18%ile
All bacteria wax and wane over time. Personally, I would not be concerned unless it is constantly above 75%ile for pathogenic. It is is over, then take your concerns to your MD for appropriate testing to confirm..
For this person we have a lot of symptom forecasts[new algorithm] matching reported symptoms
Analysis
Ombre Lab Processing
We are looking at the Ombre Lab Report data below. These are a lot of swings over the last 4 sample. Looking at the prior (likely the worse)
- Eubiosis was the worse
- Bacteria Under 10%ile was the highest
- Outside Kaltoft-Møldrup was the highest
- Chao1 Index was the highest
A lot of other measures had little or no change (i.e. JasonH, Microba Co-Biome,,Nirvana/CosmosId etc) suggesting low sensitivity to detect shifts. Some hits at a continuous shift (Simpson Diversity Index.
The wide variety of lab read quality makes reliable comparisons difficult. The Lab Read Quality bounces around, and with that, other values may echo these shifts (i.e. up to 20% shifts for some measures). A low read quality means less bacteria are reported, for example, when it was low, the Outside Kaltoft-Møldrup has low, when it was high, the value became high.
Another way to view it is this: If 10% are out of range and 660 are reported then we have 66. If we have 940 in another report then we would expect 94. This could be misread as a 94/66 or a 43% increase in out of range bacteria. Technically, it is more complicated but that should explain the problem.
| Criteria | 12/31/2023 | 10/2/2023 | 7/28/2023 | 4/18/2023 |
| Lab Read Quality | 5.6 | 12.6 | 8 | 4.9 |
| Eubiosis | 53.4 | 8.2 | 38.8 | 83.1 |
| Rickettsiaceae | 34%ile | 0 | 0 | 0 |
| Outside Range from GanzImmun Diagostics | 17 | 17 | 14 | 14 |
| Outside Range from JasonH | 5 | 5 | 5 | 5 |
| Outside Range from Lab Teletest | 32 | 32 | 25 | 25 |
| Outside Range from Medivere | 17 | 17 | 17 | 17 |
| Outside Range from Metagenomics | 8 | 8 | 7 | 7 |
| Outside Range from Microba Co-Biome | 5 | 5 | 6 | 6 |
| Outside Range from MyBioma | 16 | 16 | 9 | 9 |
| Outside Range from Nirvana/CosmosId | 24 | 24 | 26 | 26 |
| Outside Range from Thorne (20/80%ile) | 310 | 310 | 210 | 210 |
| Outside Range from XenoGene | 51 | 51 | 41 | 41 |
| Outside Lab Range (+/- 1.96SD) | 36 | 20 | 7 | 19 |
| Outside Box-Plot-Whiskers | 114 | 97 | 71 | 69 |
| Outside Kaltoft-Møldrup | 164 | 239 | 141 | 79 |
| Bacteria Reported By Lab | 765 | 941 | 762 | 663 |
| Bacteria Over 90%ile | 101 | 82 | 42 | 58 |
| Bacteria Under 10%ile | 60 | 302 | 102 | 28 |
| Shannon Diversity Index | 2.953 | 3.099 | 2.987 | 2.62 |
| Simpson Diversity Index | 0.043 | 0.053 | 0.079 | 0.098 |
| Chao1 Index | 23041 | 38183 | 26135 | 15707 |
| Pathogens | 28 | 25 | 23 | 15 |
| Condition Est. Over 90%ile | 1 | 1 | 1 | 1 |
| Top 10 forecast symptoms matching | 9 | 9 | 10 | n/a |
Rickettsiaceae was seen in earlier samples:
- 2022-04-11 at 6%ile
- 2022-11-01 at 18%ile
Biomesight Reporting
One sample could not be successfully processed thru Biomesight. Biomesight indicated that there are ongoing technical issues with their processing of Thryve FastQ files.
| Criteria | 12/12/2023 | 7/28/2023 | 4/18/2023 |
| Lab Read Quality | 5.6 | 8 | 4.9 |
| Eubiosis | 42.8 | 80.8 | 74.3 |
| Outside Range from GanzImmun Diagostics | 13 | 14 | 14 |
| Outside Range from JasonH | 3 | 5 | 5 |
| Outside Range from Lab Teletest | 16 | 23 | 23 |
| Outside Range from Medivere | 12 | 13 | 13 |
| Outside Range from Metagenomics | 5 | 8 | 8 |
| Outside Range from Microba Co-Biome | 1 | 2 | 2 |
| Outside Range from MyBioma | 8 | 4 | 4 |
| Outside Range from Nirvana/CosmosId | 11 | 23 | 23 |
| Outside Range from Thorne (20/80%ile) | 144 | 250 | 250 |
| Outside Range from XenoGene | 20 | 23 | 23 |
| Outside Lab Range (+/- 1.96SD) | 38 | 22 | 25 |
| Outside Box-Plot-Whiskers | 149 | 97 | 81 |
| Outside Kaltoft-Møldrup | 99 | 123 | 60 |
| Bacteria Reported By Lab | 664 | 696 | 618 |
| Bacteria Over 90%ile | 122 | 93 | 61 |
| Bacteria Under 10%ile | 38 | 46 | 9 |
| Shannon Diversity Index | 1.565 | 1.242 | 1.507 |
| Simpson Diversity Index | 0.037 | 0.057 | 0.078 |
| Chao1 Index | 17542 | 14092 | 10705 |
| Shannon Diversity Percentile | 41.2 | 10.8 | 32.6 |
| Simpson Diversity Percentile | 32.4 | 55.9 | 72 |
| Chao1 Percentile | 88.4 | 75.6 | 53.8 |
| Lab: BiomeSight | |||
| Pathogens | 25 | 23 | 19 |
| Condition Est. Over 90%ile | 1 | 1 | 1 |
| Top 10 forecast symptoms matching | 7 | n/a | 9 |
Bottom line, the variability of 16s Lab Quality leaves too much fogginess for interpretations 🙁
Revised Symptom Forecasting
This algorithm is similar to the Eubiosis algorithm. We compute the expected number of matches to bacteria shifts associated with the symptoms. The expected theoretical threshold by randomness is 16%. A higher number indicate increased odds, a lower number decreased odds. This is based on the existing annotated samples uploaded. It is not definitive and often there can be multiple subsets of bacteria associated with a symptom. The match is on too much or too few of a collection of bacteria
The checkmarks are the entered symptoms, the list are the predictions from most likely to lesser.
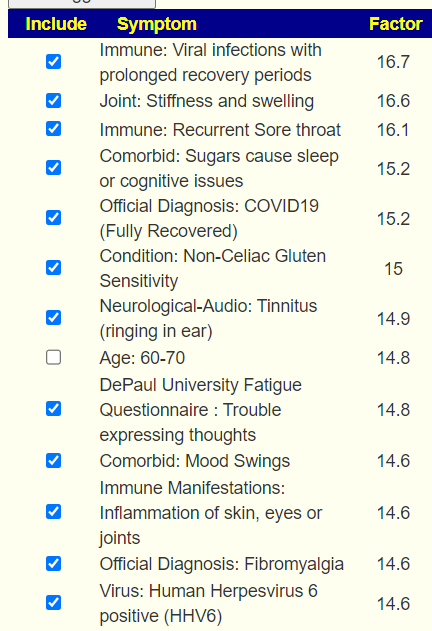
As seen in another post over multiple samples, we have a good accuracy in predicting symptoms from the microbiome.
Going Forward
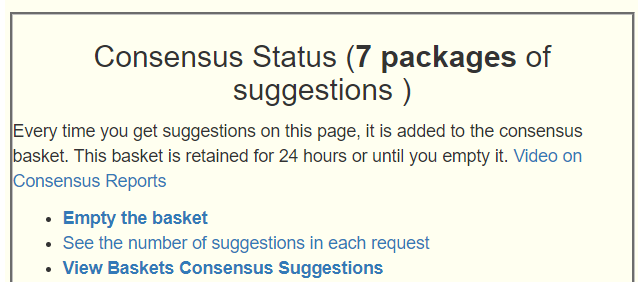
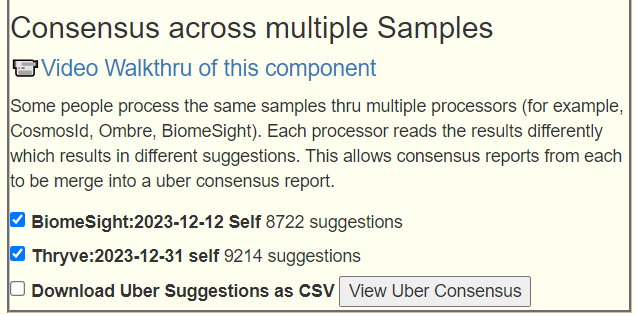
Again, using Just give me suggestions include Symptoms is how we are going to proceed. And then add in the two Special Studies. This results in 7 packages of suggestions for each lab. Since we have two different interpretations (Biomesight and Thryve) of the FastQ files. We then do an Uber Consensus merging 14 packages of suggestions!
And the merge (on [Multiple Samples] tab)
Thresholds: High is 383 thus 190 or higher, Low is -462 this -231 or lower
First we are going to look on what ALL 14 sets of suggestions agreed upon
- linseed(flaxseed)
- high red meat
- high animal protein diet
- lactobacillus rhamnosus (probiotics)
- low-fat high-complex carbohydrate diet
So low-fat animal protein. There were no avoids that everyone agreed upon.
Usual High Level Review
- Amino Acids and flavonoids
- Diet and Food
- Probiotics
- Vitamins
Remember to check suggested dosages here. A common issue is taking token amounts which are unable to effect changes.
Postscript – and Reminder
I am not a licensed medical professional and there are strict laws where I live about “appearing to practice medicine”. I am safe when it is “academic models” and I keep to the language of science, especially statistics. I am not safe when the explanations have possible overtones of advising a patient instead of presenting data to be evaluated by a medical professional before implementing.
I cannot tell people what they should take or not take. I can inform people items that have better odds of improving their microbiome as a result on numeric calculations. I am a trained experienced statistician with appropriate degrees and professional memberships. All suggestions should be reviewed by your medical professional before starting.
The answers above describe my logic and thinking and is not intended to give advice to this person or anyone. Always review with your knowledgeable medical professional.
Recent Comments