A reader asked this question about Lactobacillus Salivarius (NCBI 1624). I am doing it for this single strain — for a mixture, just do each one and consolidate the results.
FIRST, login to access more information. Most of the information below do not require a login.
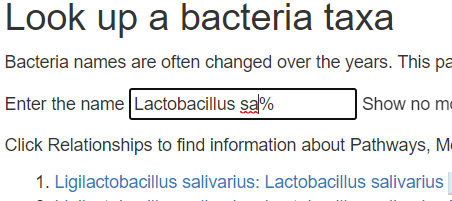
SECOND, look up the species
From https://microbiomeprescription.com/Library/Lookup?name=Lactobacillus+sa%25&top=200
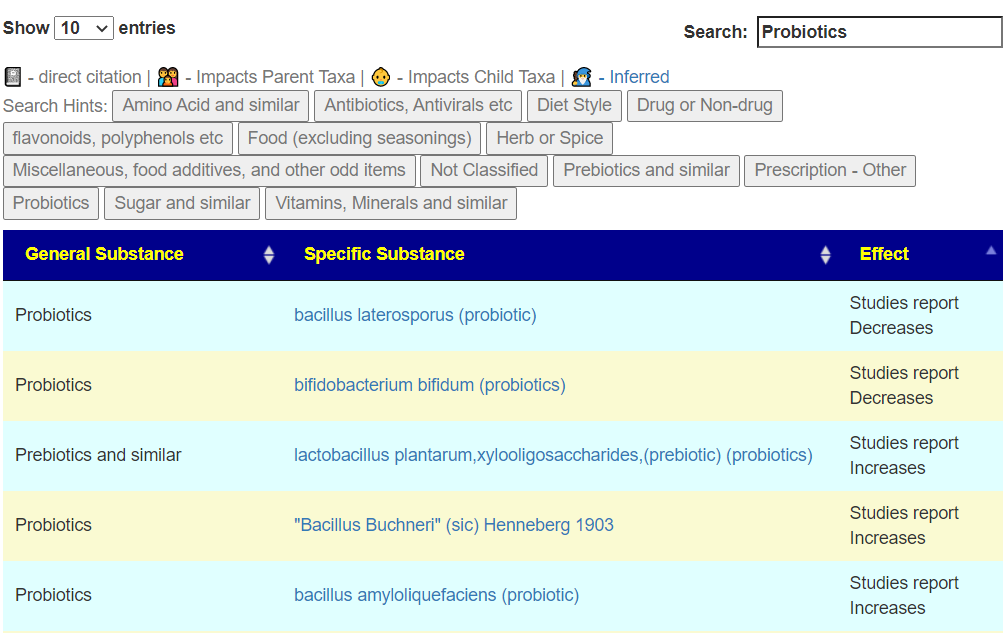
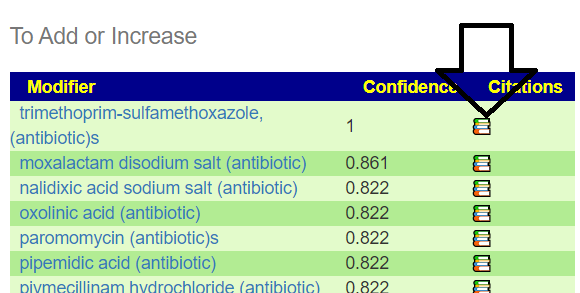
THIRD, click on that link above, this will show what helps or hurts this probiotic. Click on [Probiotics] for a start — you want to make sure that other probiotics you are taking support it. Note that I have gone thru a few retail mixtures and the probiotics fight each other!Buyer beware of mixtures! In this case we have 26 listed. 24 are friendly and 2 are hostile (bacillus laterosporus (probiotic), bifidobacterium bifidum (probiotics)
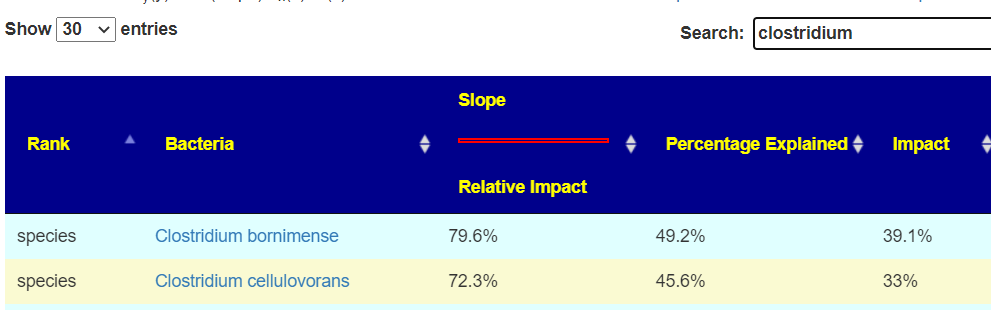
FOURTH, There is one more source of information, by looking at the associations in microbiome report. On the same page above click the red interactions button.
On the https://microbiomeprescription.com/library/details?taxon=1624 page
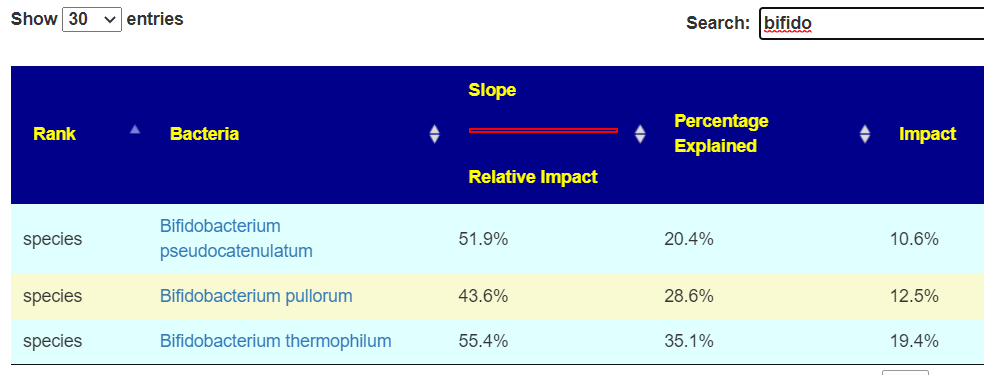
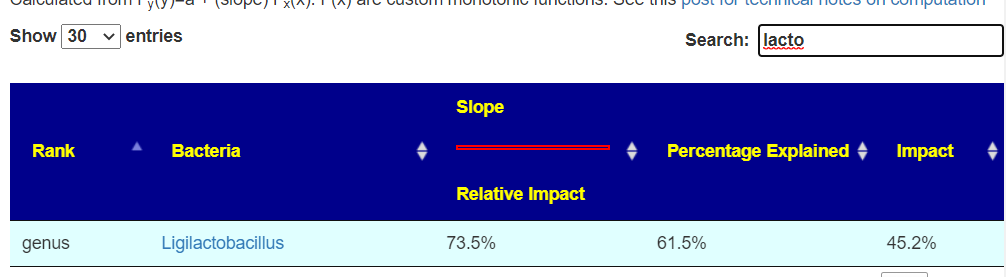
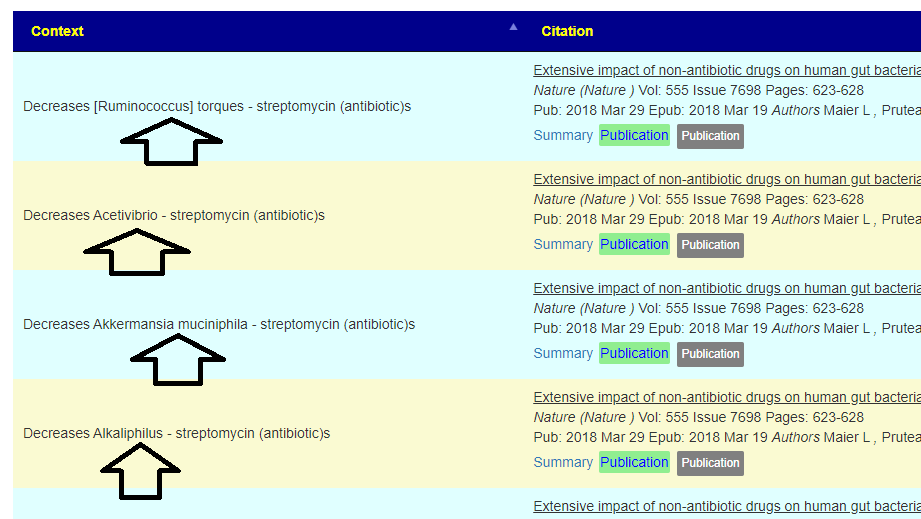
This will show a page of bacteria that are associated positively or negatively with this bacteria (i.e. probiotic). You will need to type in the family names:
These have a positive impact (i.e. IMPACT is > 0)Other lactobacillus are friendly
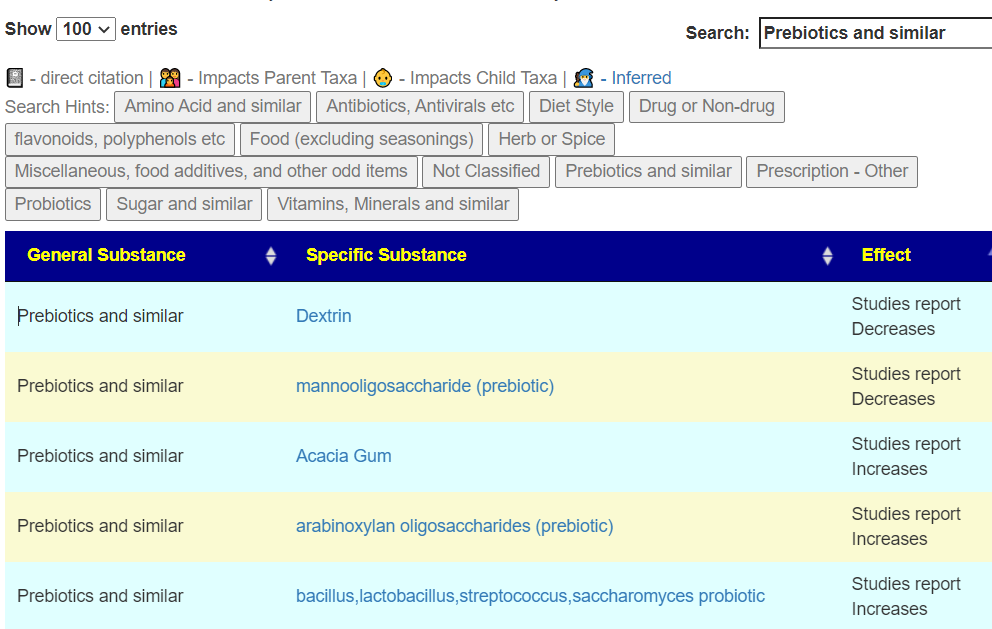
FIFTH, check prebiotics (they are often bunddled in probiotics) — 18 are friendly and two are hostile
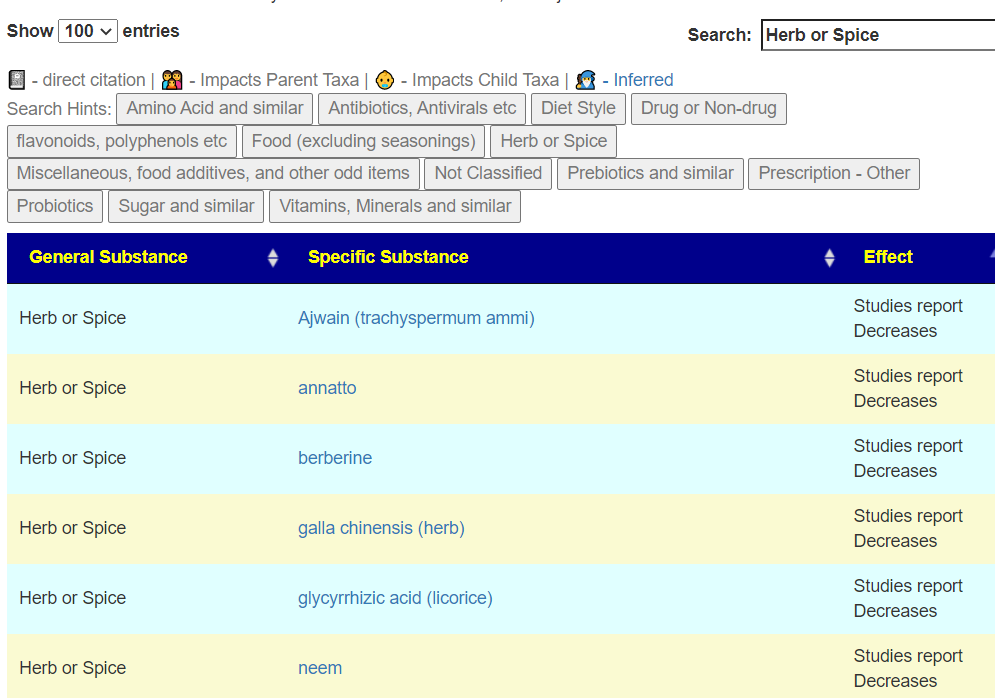
SIXTH Check Herbs and Spices, the results here may impact the rotation of herb and spices. You want to take friendly when you are doing the probiotics. Although they will likely not take up residency, the chemicals that they produce while in transit are good… you do not want to reduce the production of those chemicals.
Bottom Line
Doing your homework will get much better results than just tossing them in your mouth with something that will inhibit it!
This is using data from the study being done with BiomeSight. We will only use their samples. After the first review, a z-score of 6.4 or higher (or a lots of items) was set as a cutoff point. The following ignore False Detection Rate.
Conclusion: the ENZYME production of the microbiome is by far the strongest indicator.
The reference set consists of 1037 heterogenous samples (i.e. no Long COVID, but a variety of medical conditions) and 154 samples with Long COVID
Taxon Patterns
Care needs to be taken with these numbers because the frequency of reporting on a bacteria is a factor that impacts the z-score. The data for this table is available at Citizen Science site and independent analysis is strongly recommended. This table is a simplified view of very complex data.
tax_name
tax_rank
No Symptom Mean
Symptom Mean
Z-Score
Change
Terrabacteria group
clade
715040
520885
10.4
73%
Firmicutes
phylum
652452
502830
9.0
77%
Tenericutes
phylum
2562
6362
-7.9
248%
Eubacteriales
order
609888
482468
7.9
79%
Mollicutes
class
2562
6362
-7.9
248%
Clostridia
class
613743
487719
7.8
79%
Emticicia oligotrophica
species
769
2553
-6.8
332%
Faecalibacterium prausnitzii
species
100292
142415
-6.7
142%
End Product Patterns
End products only had a single item above our 6.3 z-score threshold with a very small shift.
EndProduct
No Symptom Mean
Symptom Mean
No Symptom StdDev
Change
H2
1329
1307
6.6
98%
KEGG Enzyme Patterns
This is where we see a massive number of patterns(182!!) with very high z-scores (i.e. 6.4 or higher). This hints that the bacteria associated with these enzymes may be a good target to modify.
Products are the output of enzymes. Various enzymes may produce the same product. Our starting assumption was that products would have stronger association than enzymes. That was not shown in the data.
Subtrate are the fuel for enzymes reaction. Various enzymes may consume the same compound. Our starting assumption was that substrate would have stronger association than enzymes. That was not shown in the data.
CompoundName
No Symptom Mean
Symptom Mean
No Symptom StdDev
Change
Dihydrourocanate
38026
55395
-7.8
146%
(S)-3-Hydroxy-3-methylglutaryl-CoA
34820
50269
-7.4
144%
Electron-transferring flavoprotein
106880
149551
-6.9
140%
threo-3-Hydroxy-D-aspartate
760
2532
-6.9
333%
3-(Methylthio)acryloyl-CoA
757
2494
-6.8
329%
3-Hydroxy-3-(methylthio)propanoyl-CoA
757
2494
-6.8
329%
3-Oxopropionyl-CoA
757
2494
-6.8
329%
ADP-sugar
772
2553
-6.8
331%
Aryl dialkyl phosphate
772
2553
-6.8
331%
beta-D-Mannose
772
2553
-6.8
331%
D-erythro-3-Hydroxyaspartate
761
2532
-6.8
333%
Pseudouridine
105195
147050
-6.8
140%
N4-(Acetyl-beta-D-glucosaminyl)asparagine
759
2473
-6.7
326%
Short-chain acyl-CoA
103536
144711
-6.7
140%
(2-Amino-1-hydroxyethyl)phosphonate
752
2431
-6.6
323%
trans-2,3-Dehydroacyl-CoA
68745
95899
-6.6
140%
(S)-4-Hydroxymandelate
113176
152269
-6.5
135%
5-Methylphenazine-1-carboxylate
750
2381
-6.5
317%
Hexadecanoyl-[acp]
1468
4753
-6.5
324%
Kanamycin B
34729
48298
-6.5
139%
Octadecanoyl-[acyl-carrier protein]
734
2376
-6.5
324%
(1E)-4-Oxobut-1-ene-1,2,4-tricarboxylate
739
2338
-6.4
316%
2-Deoxystreptamine antibiotic
35916
49415
-6.4
138%
Adenylated molybdopterin
119083
159672
-6.4
134%
Alditol
763
2429
-6.4
318%
beta-Carotene
720
2314
-6.4
321%
Molybdate
119083
159672
-6.4
134%
Bottom Line
Several years ago, I hypothesized that a symptom or condition is the result of a coming together of many small deviations in individual bacteria representation. There may be 10 different combination of bacteria with none overlapping causing a symptom. The inspiration for this was observing the literature and experience of people with Myalgic encephalomyelitis/chronic fatigue syndrome (ME/CFS) — a sibling condition to Long COVID. This model is contrary to the common belief that there is a single or small number of items that is the cause. My looking at Brain fog (using same technique as above Brain Fog: Microbiome scents…) came up with nothing. That was not desired, but almost expected because that population is very heterogenous for cause with a long time since the triggering event for the microbiome to diverge from each other (often treatment attempts would be a factor). With long COVID, we have a short time since the triggering event and the people tend to be treatment naïve, This makes finding patterns a lot easier (when you look under the right rocks!).
Almost everything is overproduction. This may be caused by the immune system ramping up to provide fuel to fight COVID. The microbiome is stuck in an on-state, likely with cross talk between enzymes keeping it stuck on. The term of the Pasteur Institute for Tropical Medicine, “an occult infection” describes the behavior seen nicely.
Addressing the few microbiome shifts is one approach — but the enzymes dominate in both statistical significance and number of items, It is likely the best path to address the enzymes instead of individual bacteria.
At present in our citizen science database we have samples reporting brain fog for:
Biomesight: 124 samples
Ombre/Thryve: 151 samples
UBiome/Thryve: 170 samples
Results from different labs cannot be safely aggregated, so we will investigate on a lab by lab basis. One lab will read data as bacteria A and a different lab as bacteria B.
Biomesight returned nothing, Ombre just 7 candidates and ubiome 23. There was nothing in common.
KEGG Substrate
Biomesight returned 2 candidates, Ombre returned 42 candidates and ubiome 86. There were a few things in common between Ombre and uBiome. False Detection rate is a risk.
(S)-Ureidoglycolate – much higher consumption
2-O-(alpha-D-Glucopyranosyl)-D-glycerate – much higher consumption
I am disappointed in not finding many associations. I will pass the torch to others to see if there is literature connecting these to coagulation or vascular constriction/dilatation .
Saying “gluten is bad for you” is the same as saying the “bacteria are bad for you” (or “vitamins are good for you”. In some cases bacteria can be good for you, i.e. probiotics. Some vitamins can be bad, for example, “Vitamin D Toxicity“[2022]. These are over simplification and sweeping generalizations. To me, they are akin to saying “Blacks are criminals”, “Irish are drunkards”, and “Italians are part of the Mafia”.
”Gluten is a complex mixture of hundreds of related but distinct proteins, mainly [in wheat] gliadin and glutenin. Similar storage proteins exist as secalin in rye, hordein in barley, and avenins in oats and are collectively referred to as “gluten.” ” What is gluten? (US National Library of Medicine) Barley is free of glutenins and gliadins, the troublesome glutens. You may be using “All black men are criminals” reasoning. You really need to be tested for which types of gluten proteins you reactive to and not go for internet-legend that all glutens are bad.
YES – you may feel better eating gluten free, but the why is more likely to be a wheat allergy than gluten issue!
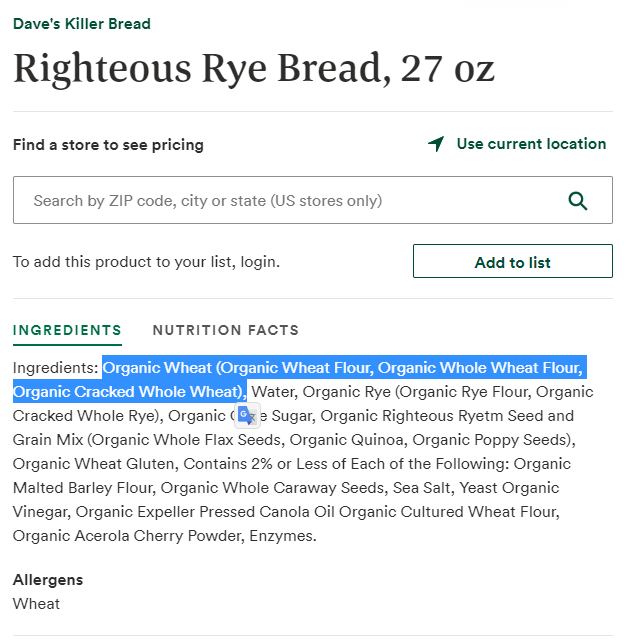
Looking at how the microbiome is influenced by barley, oats, rye, and wheat we see major differences –– which I ascribed to the chemical difference of the type of gluten in each. In most western diet, many items described as “Rye Bread” contain wheat, an example is below. People react to it and thus associate rye (the labelling) to problems.
An example, Barley increases Ruminococcus according to 3 studies while wheat decreases it. For Clostridium botulinum: Barley and wheat increases while rye decreases. While a gluten free diet is reported to decrease both of these bacteria.
Bottom Line
You really should be tested for each type of gluten (even if your diagnosis is celiac disease). Going completely gluten free may make correcting a microbiome dysfunction a lot harder. Less than 1% of the population has a medical need to go gluten free [2018]. It is well sold by influencers on the internet.
“Gluten-free diets have soared in popularity in recent years. But, shunning gluten has no heart benefits for people without celiac disease, and it may mean consuming a diet lacking heart-healthy whole grains, according to the quarter-century study.”
A 2018 study lists the following risks of doing it without a proven medical need:
Potential Harms of a GFD
Deficiencies of micronutrients and fiber
Increases in fat content of foods
Hyperlipidemia
Hyperglycemia
Coronary artery disease
Increased financial costs
Social impairment or restrictions
GF has a higher frequency of osteopenia and osteoporosis than in controls has been reported [2014]
A 2021 study reports “the currently available gluten-free products in the market are generally known to be lower in proteins, vitamins, and minerals and to contain higher lipids, sugar, and salt compared to their gluten-containing counterparts…. Some studies have shown that commercialized gluten-free food products are often not gluten free. “
No, I am not talking about voting politics in the US!
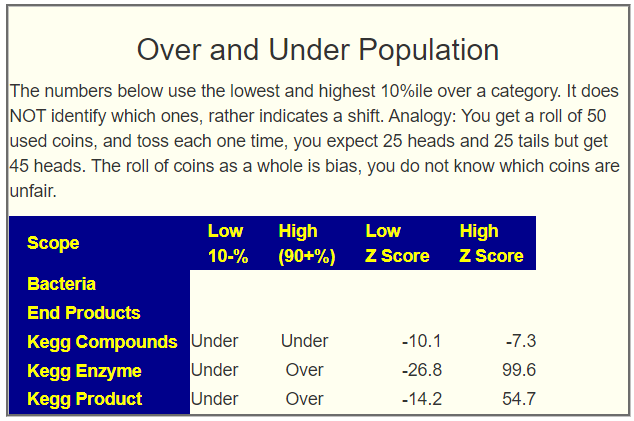
While doing an analysis, I went to the raw data to try to understand the sample. The result is the addition of a new section on the [Research Features] tab. Unlike most items, this is not directly actionable. An analogy:
You have gotten 100 used coins from the bank and proceeded to toss each one once. You would expect to get 50 heads and 50 tails. You got 20 heads and 80 tails. This means that these 100 coins have bias that is statistically significant. You do not know which are the problem (unfair) coins.
The same issue applied to vectors of the microbiome.
A reader had just emailed me that they have done another sample and it occur to me to view a time series of this person over time to see what this new report offers. The person reports some improvements following Dr. Artificial Intelligence suggestions. I included Dr. Jason Hawrelak rating on each for reference
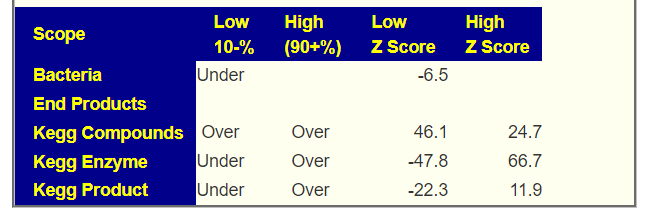
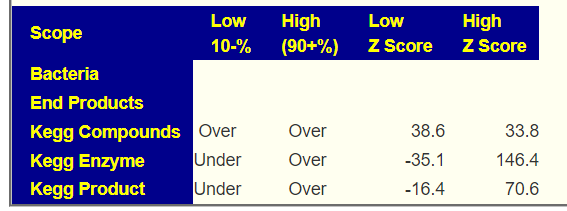
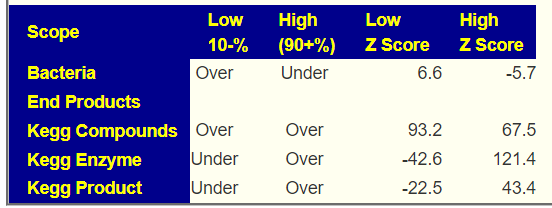
The biggest improvement with Dr. Jason Hawrelak was between the first two. KEGG Compounds went from being under produced for both high and low, to over on all subsequent ones. The pattern of over and under kept consistent until the very last one where bacteria edged into significance. I do have concerns with single digit Z-Scores, because of the false discovery rate.
What does Over Representation of Low Bacteria mean exactly? It means that the number of different bacteria types sitting below 10% was much higher than expected. It may imply a more diverse population with a lot of token representation.
What does Under Representation of High Bacteria mean exactly? It’s the flip side of above. The number of different bacteria types sitting above 90% was much lower than expected. It may imply a population without full representation.
WARNING: Do not assign undue significance to a change of z-score with the same sign.
On a personal note, seeing bacteria shift into significance from insignificance, looks like a good thing. It means that the prior microbiome has become disrupted. Our goal is to disrupt the stable dysfunctional microbiome causing symptoms.
Again, this is both an experimental feature AND it’s interpretation is not easy.
A reader on Facebook requested this data (since I am likely the only one that has the data that can speak of it). Here’s the charts – Have fun interpreting
A reader message me about Kefir. My usual response is “You do not know what you are getting”. While for a person with near normal health, it likely does some good (keeping with the concept of hygiene hypothesis), this is not so clear for more severe dysbiosis of the gut.
“Kefir grains consist of complex symbiotic mixtures of bacteria and yeasts, and are reported to impart numerous health-boosting properties to milk and water kefir beverages. ” [2022]
Which bacteria could be in Kefir
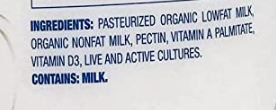
Typical Kefir Label – What are these cultures?
There is no legal requirement to report the name of the bacteria in the kefir, nor the genus, species or strains. Each batch may have a significantly different mixture of bacteria. You want live and active cultures? Go to the forest and eat a spoonful of dirt!!
Kefir is not a precise product, even in the vaguest terms. I am bias to juggling as few balls at a time as possible… Kefir feels like working with all of the balls in an IKEA kids ball room. It’s spinning the barrel of a bacteria roulette — especially since the same product from the same manufacturer may be different in the next batch. For grown at home kefir, the variability will be a lot higher.
I am not a licensed medical professional and there are strict laws where I live about “appearing to practice medicine”. I am safe when it is “academic models” and I keep to the language of science, especially statistics. I am not safe when the explanations have possible overtones of advising a patient instead of presenting data to be evaluated by a medical professional before implementing.
I cannot tell people what they should take or not take. I can inform people items that have better odds of improving their microbiome as a results on numeric calculations. I am a trained experienced statistician with appropriate degrees and professional memberships. All suggestions should be reviewed by your medical professional before starting.
I have done everything as planned since your first review
I maybe went up from 15% to 20%. I was able to reintroduce some new activities, but still am lying in bed most of the time. Also taking piracetam seems to help.
I still won’t be able to do the analysis myself.
COMMENT:ME/CFS patients are a priority for me because I personally understand their brain fog and cognitive impairments from past experiences.
I have had COVID in the meantime in case that matters for your analysis, but I did not notice any changes afterwards.
Analysis
Given the recent post for another ME/CFS person who had COVID too, with the result that their microbiome became a good match for long COVID and a poor match for ME/CFS, this was my first question. Fortunately, the sample was done via Biomesight, he did not needed with FASTQ files and transferring them. To keep the story short, I looked at his shifts compared to annotated sampled and compare to literature from the US National Library of Medicine nothing shifted between the samples. There is no shift towards Long COVID from ME/CFS in this case.
Comparing Samples
I do not know the answers. I have a model. Models often need adjustments so comparing samples (for better or worst) in a consistent manner is part of my learning process.
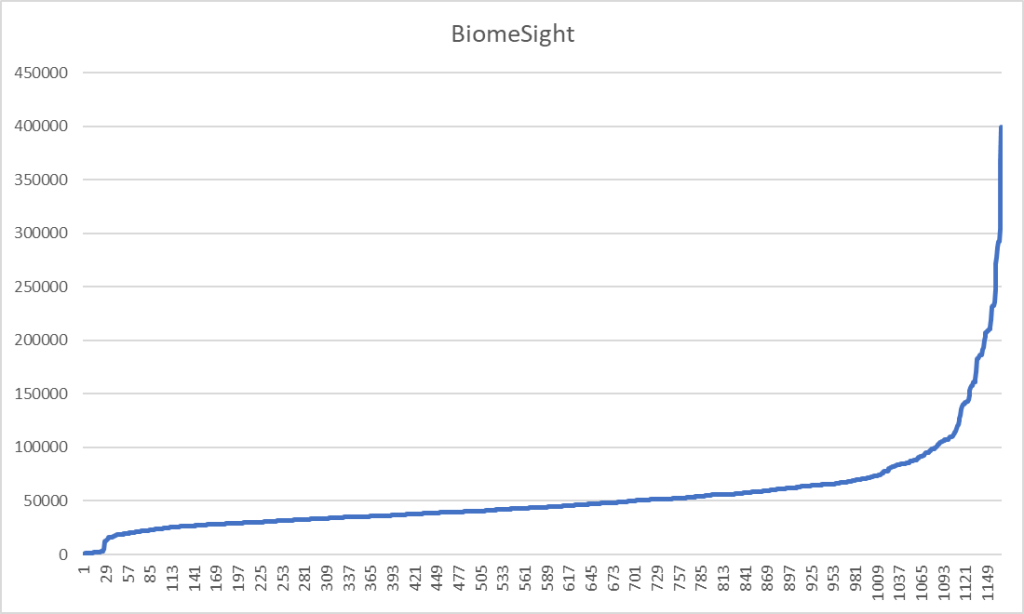
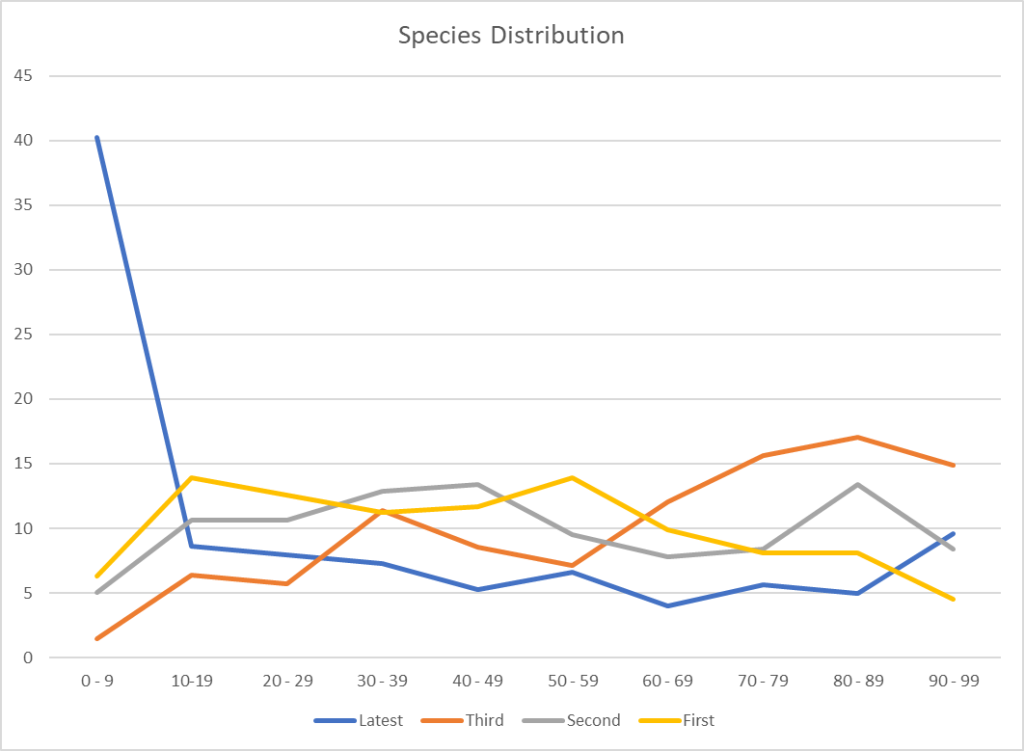
First thing we see a dramatic change with rare bacteria being seen much more often and common bacteria less often. There are more genus seen (184 vs 141) and more Species (230 vs 161) but this may be due the better sample reads in the latest sample (82,102 reads versus 55,117 reads).
Percentile
Latest Genus
Latest Species
Earlier Genus
Earlier Species
0 – 9
47
65
2
4
10 – 19
23
27
10
16
20 – 29
19
16
16
11
30 – 39
13
17
12
13
40 – 49
15
18
13
14
50 – 59
16
17
23
32
60 – 69
15
22
14
19
70 – 79
17
22
13
14
80 – 89
13
16
24
22
90 – 99
6
10
14
16
Average
18.4
23.0
14.1
16.1
Std Dev
11.0
15.4
6.2
7.4
Hawrelak’s criteria was 95.6%ile for both samples.
Potential Medical Condition dropped from 7 to 1. With Obesity being in common.
The person feeling subjectively better and doing more activities
Most of the other measures are the same or difficult to interpret. There is one possible concern, the high levels of Prevotella copri is an indicator of mycotoxin, typically from moulds and fungi. Considering that the time between the samples was winter with close windows and heating — there could be an environment issues here – so lots of fresh air may be good.
Over to Suggestions
There are various algorithms to suggesting probiotics, the strongest results are for:
I ran a few ways of picking bacteria based on Bacteria (and not genes) and lactobacillus casei kept was the top in the consensus report (overall and in terms of probiotics)
Unfortunately, some of the items have no studies. Given that the suggestions are based solely on bacteria with no knowledge of the diagnosis, the convergence with the literature suggests that the suggestions are very appropriate. Two different roads came to the same conclusion. In data science this is sometimes called “cross validation”. In Scotland, “O ye’ll tak’ the high road, and I’ll tak’ the low road, And I’ll be in Scotland a’fore ye,”
I looked at the antibiotic list for the latest sample and the top two are typically used for ME/CFS:
And interesting that several others often used are NOT recommended: azithromycin (which is a macrolide ?!?), minocycline [2021], fluoroquinolone, doxycycline.
ME/CFS is a heterogeneous condition with a wide variety of microbiome dysfunctions. I believe that using the microbiome to target the best candidate antibiotics is the rational way to proceed.
Question: Sadly I do not tolerate chocolate, but I will try it out again.
Answer: These are suggestions, do only what you are comfortable with. Nothing is required. The chocolate issue is interesting, my daughter does not tolerate most chocolates, she discovered that it was the type of sugar (i.e. made with liquid sugar / liquid glucose — adverse reaction) made with solid sugar — happiness. See Health effects of glucose syrup
If you try again, you may wish to determine the type of sugar actually being used first.
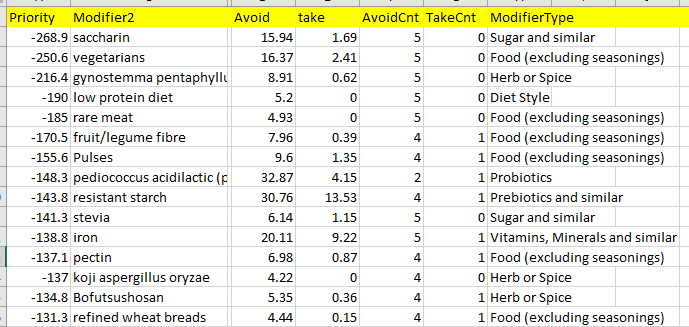
Question: Is there no avoid list?
Answer: Yes, in the download, any item with a NEGATIVE value in the priority is an avoid
Avoid Cnt is the number of time that suggestions placed it into avoid
Question: Is 1 capsule of Equilibrium per day really enough?
Answer: I honestly do not know. There is no literature to work from. If you take more, than separate them (i.e. 12 hrs apart)
Question: It seemed whenever I took turmeric that I was getting more nervous and anxious. Still take it now and then?
Answer: As above, do only what you are comfortable with — there are hundreds of items listed. Anxiety is contrary to the effects of turmeric / curcumin reported in the literature [2021] [2019] [2018] [2017]. If turmeric is causing die-off of bacteria that causes vascular constriction, that would result in anxiety. If you tolerate aspirin or niacin (flushing type), then try taking those with the turmeric.
I am not a licensed medical professional and there are strict laws where I live about “appearing to practice medicine”. I am safe when it is “academic models” and I keep to the language of science, especially statistics. I am not safe when the explanations have possible overtones of advising a patient instead of presenting data to be evaluated by a medical professional before implementing.
I cannot tell people what they should take or not take. I can inform people items that have better odds of improving their microbiome as a results on numeric calculations. I am a trained experienced statistician with appropriate degrees and professional memberships.
Backstory of Latest Sample
In light of your recent few blog posts about uploads without many microbiome shifts to work with, I was thinking this could be a beneficial walkthrough video for what seems to be the opposite.
I was doing pretty well on my antibiotic rotations (mainly tetracycline two weeks on, two weeks off since Aug of 2021) until Feb or so when I had a major crash / flare that I’m still suffering from.
I did have a very mild case of Covid in mid January that felt no worse than a regular cold.
But from what little I can parse from this sample, it seems I may be struggling with long Covid. I say little, because my brain fog is extremely dense.
And all of the results I’m getting for this sample via your site seem so drastically different from what has been going on over the last 7 years (my oldest sample is from 2015).
Comparison of samples
This person has samples going back to 2015 using uBiome. Unfortunately for comparison we need to keep to the same lab (why? read The taxonomy nightmare before Christmas…).
Jason Hawrelak Criteria etc
We finally see an improvement with Jason’s criteria. We also may be seeing more diversity with the increase of Genus and Species found. I say may because this could be a side-effect of a low raw count in some samples.
Date
Percentile
Unhealthy Bacteria
Genus
Species
2022-04-11
98.8 %ile
8
220
303
2022-01-11
89 %ile
11
89
141
2021-03-09
89 %ile
8
108
153
2020-05-27
89% ile
7
153
223
Finally, we have a significant improvement
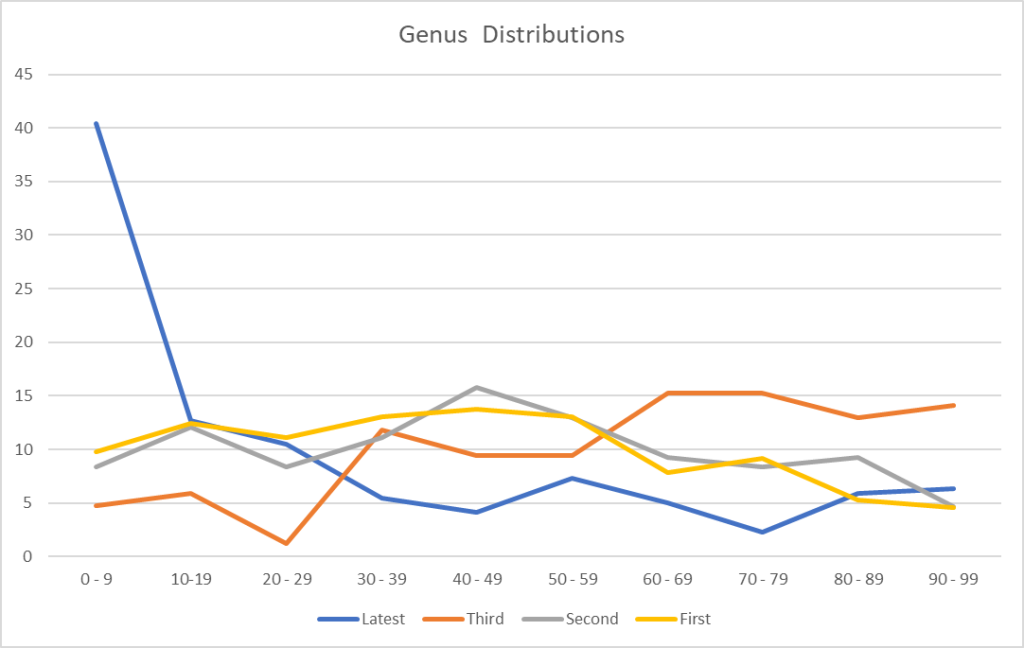
Expected values ar 10% for each line
I decided to look at the raw reads (which are captured from Thryve and Biomesights)
Sample Date
Raw Reads
5/27/2020
43311
3/9/2021
29247
1/11/2022
17630
4/11/2022
153194
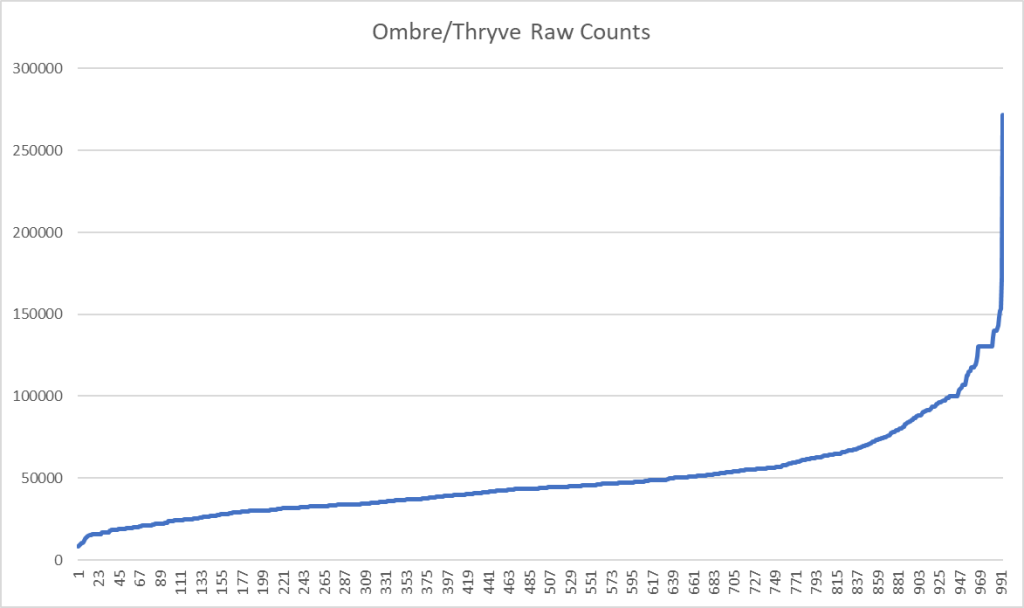
The cause of the jumps above may be the number of reads from the sample
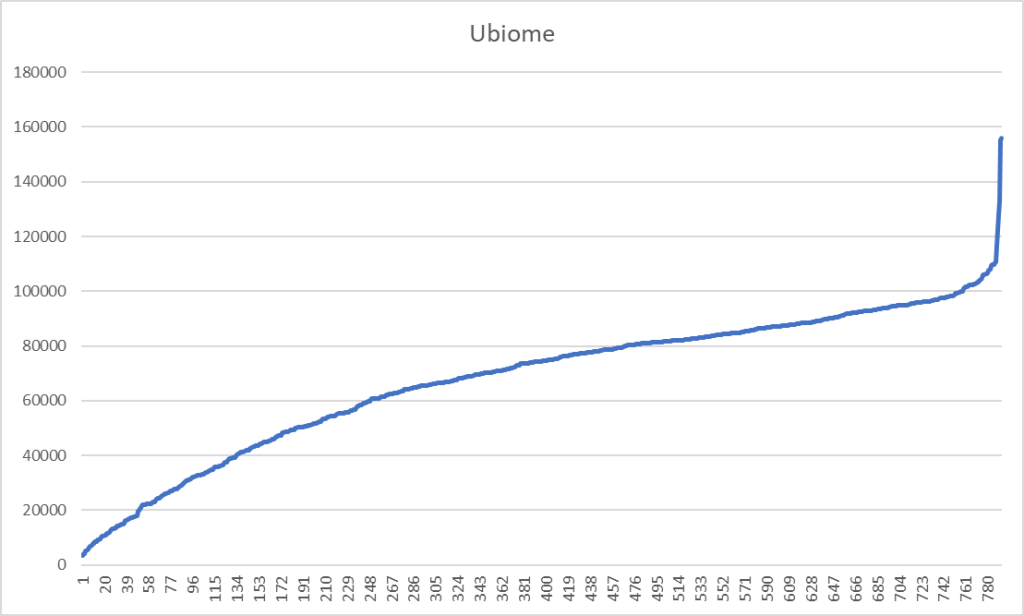
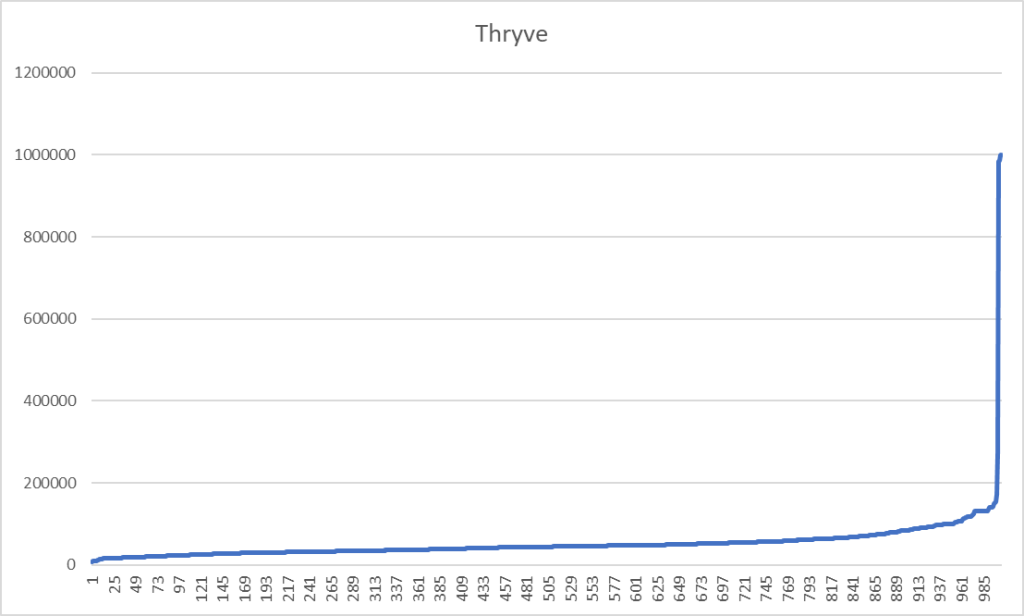
This lead me to look at what typical raw counts are from Ombre/Thryve
To find the raw counts for your sample, open the csv and look for this line
What is the consequences? It means that rarer bacteria may be ghost-like, appearing or disappearing from sample to sample. This adds let one more layer of fuzziness to doing analysis and generating suggestions.
First Question: ME/CFS or Long COVID microbiome or both?
This person uploaded the Ombre FASTQ files to BiomeSight so I may used data from the Long COVID study there. Both condition present similarly, I am curious to see if we have sufficient reference data to decide which condition is a better match.
The table above hints that he is at present much closer to Long COVID than ME/CFS.
I am not sure about the political correctness of saying “Congrads! You no longer have ME/CFS, you have Long COVID!” is what the microbiome reads like.
What is interesting is that the microbiome constantly shifts/evolves, with Long COVID the infection is constant and the duration since the infection is short — hence less evolution of the microbiome over all patients. With ME/CFS the triggering infection possibilities are huge with 20, 30, 40 years of evolution of the microbiome — hence patterns are diffused by time and original infection.
Looking at deficiency of compounds produced, we see a dramatic drop from the previous sample suggesting that bacteria are getting the needed inputs for correct functioning.
Sample Date
1%ile
5%ile
10%ile
5/27/2020
4
14
60
3/9/2021
2
14
16
1/11/2022
197
233
244
4/11/2022
6
28
52
Kegg Compounds below %ile shown
Where do we go from here
I am going to do consensus, but do only 3 items:
Hand Picked Bacteria using the study in progress data using BiomeSight (16 bacteria)
Using US National Library of medicine filter to Long COVID using BiomeSight and Box-Whiskers (14 bacteria)
Using US National Library of medicine filter to Long COVID using Ombre and Box-Whiskers (14 bacteria)
The consensus is below as a download. Since antibiotics are being prescribed at present, I included that in the suggestions criteria.
Why did I focus on the ME/CFS ones? Path of least resistance for the prescribing MD – the MD accepts ME/CFS and thus will have low resistance to prescriptions often used for ME/CFS. Asking for them for Long COVID could get rolling of eyes…. As always, we are using these off-label for their computed microbiome effect. For the prescription items, I would suggest rotation (one item for 10 days, then a 0-10 day break, then another item (or repeat if limited to one item).


Recent Comments