- If we review genus as an ethnic groups, we find over 3,365+ groups – each distinctive
- Species are the equivalent of small business, community groups – we have 10,567+
- Strains could be viewed as the individuals.
- Some strains (people) are criminals and some community leaders
- To understand what is happening in the cities, we need to get data / characteristics
- What foods are sent to the city
- What products are exported from the city
- What are the sources of energy for the city
- How may people come in or leave by ethnic groups
- What type of waste is produced by the city
- What types of crimes happen in the city
From this information, we may gain insight into how to administer and change the city.
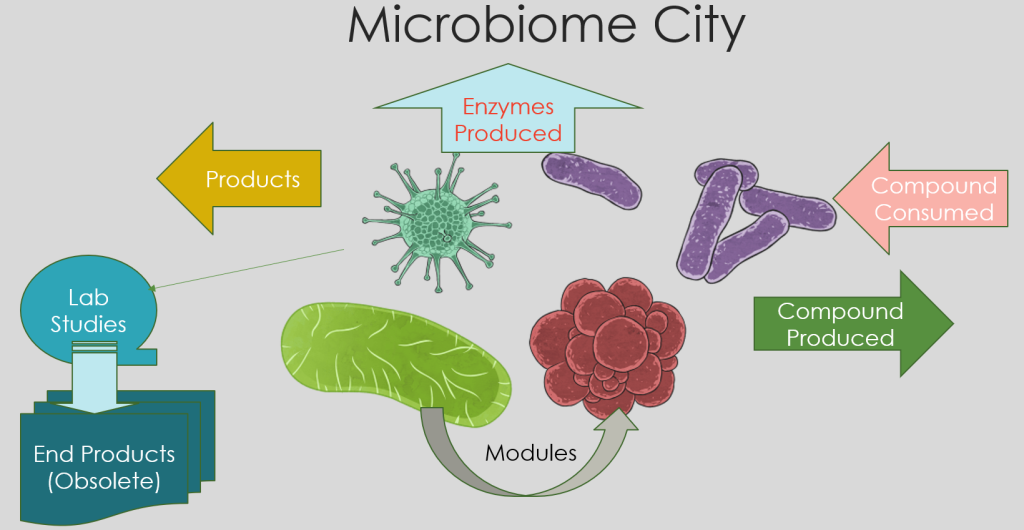
All of the above, except for End Products(Obsolete). This information is obtained from lab studies cultivating bacteria. Data is really hit and miss.
All of the other statistics is done using gene data from KEGG: Kyoto Encyclopedia of Genes and Genomes. Once the bacteria has been sequenced, all of this information can be computed. This works for both bacteria that can be cultured and those (most) that cannot be cultured in a lab.
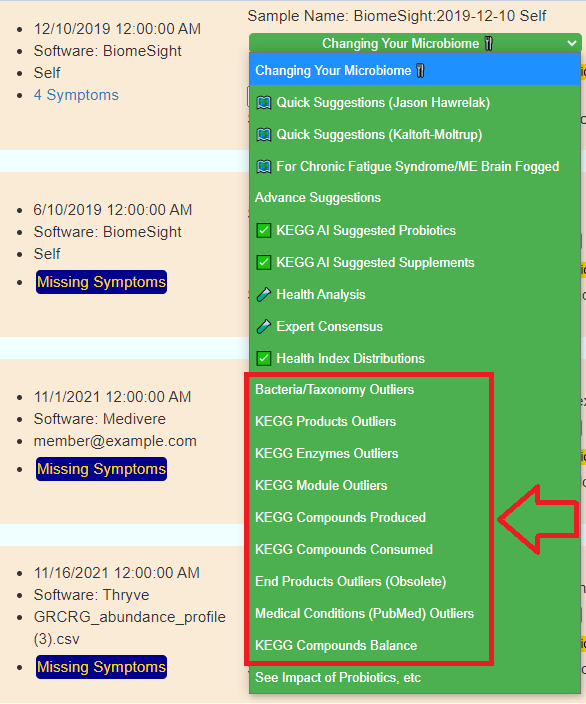
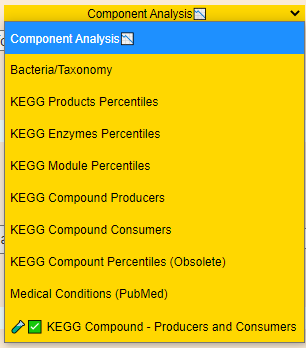
Where do you find this data on Microbiome Prescription?
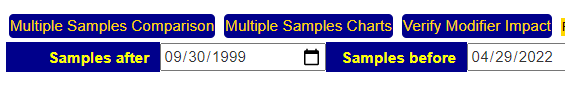
Seeing changes between Samples
When you have multiple samples, this line will appear. Multiple Samples Comparison is the button
These reports are the same as above – except you have numbers from different samples side by side
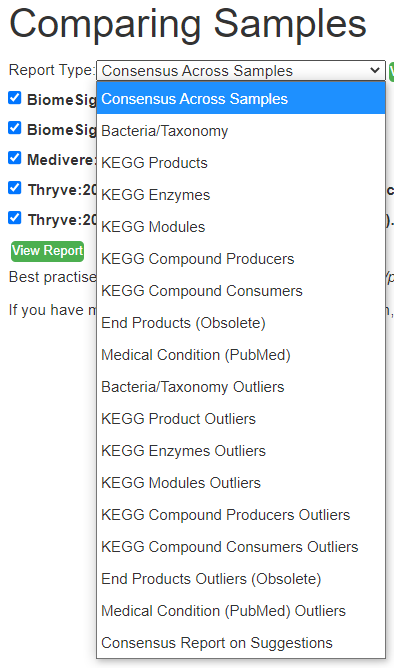
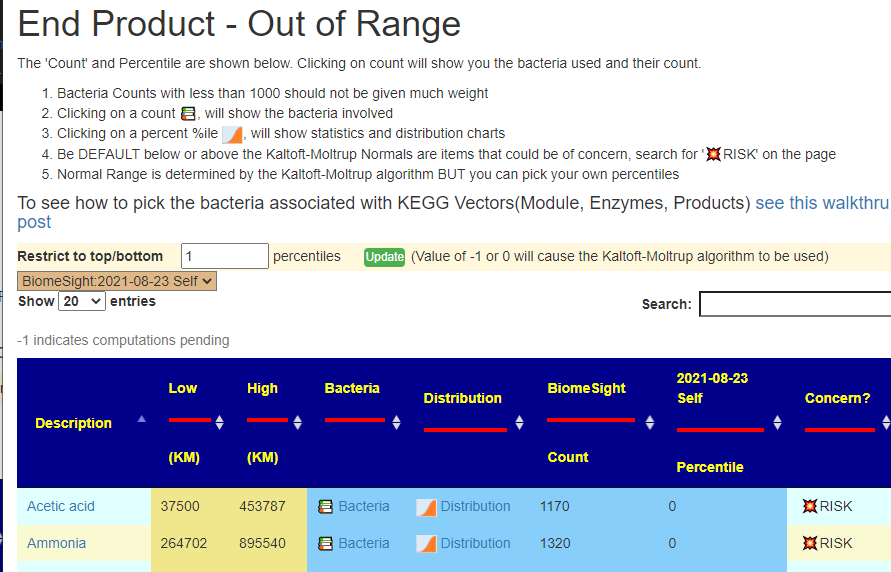
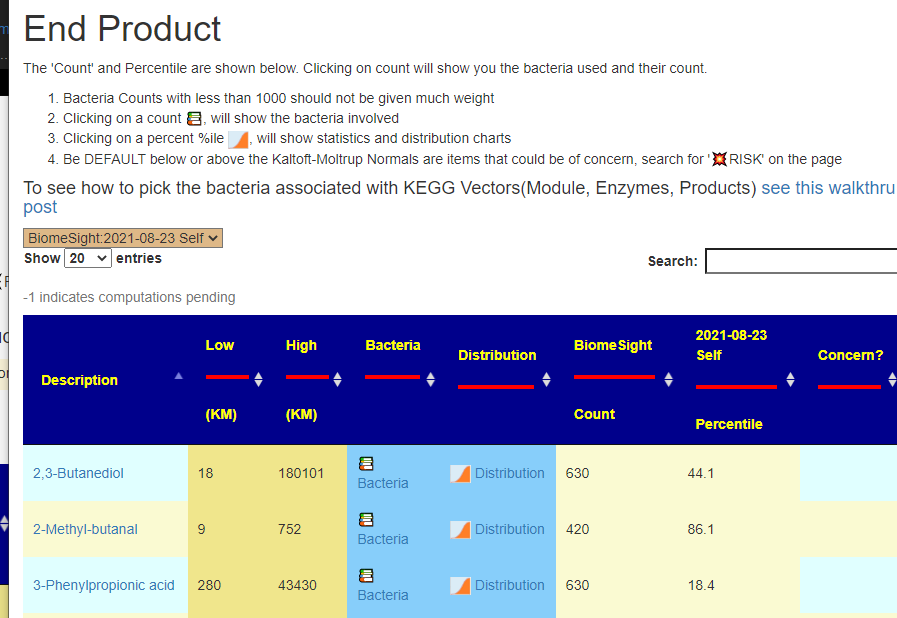
What is the difference between Outliers and Full Report?
Outliers ( AKA out of range) gives you the ability to filter by percentile OR use the Kaltoft-Møldrup Limits
The full range gives a much larger list (often hundreds) with filtering limited to the Search box on the page.
Above is for an individual sample — so you are given a list of your samples and the page will automatically update when you change samples.
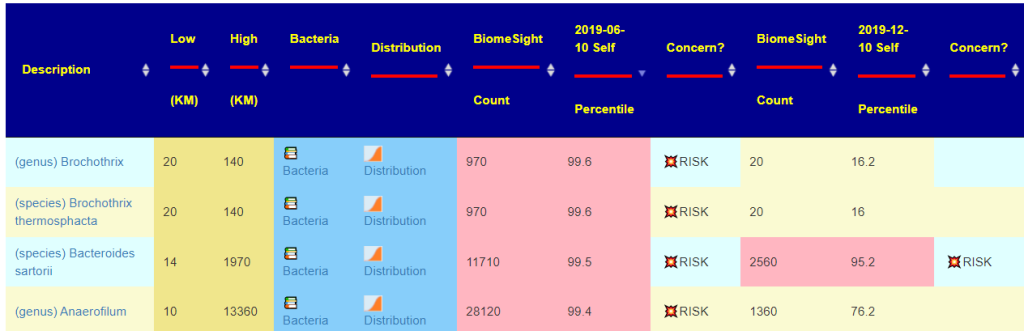
For the multiple sample compare, you have already selected the samples and cannot change them from the page. You can go back to the selection page and pick different samples.
For multiple sample outliers — if one sample has an outlier, then the values of other samples will also be shown. The outliers are color coded:
VIDEOS COMING
Recent Comments