Jason Hawrelak Criteria for Healthy Gut – Revisited

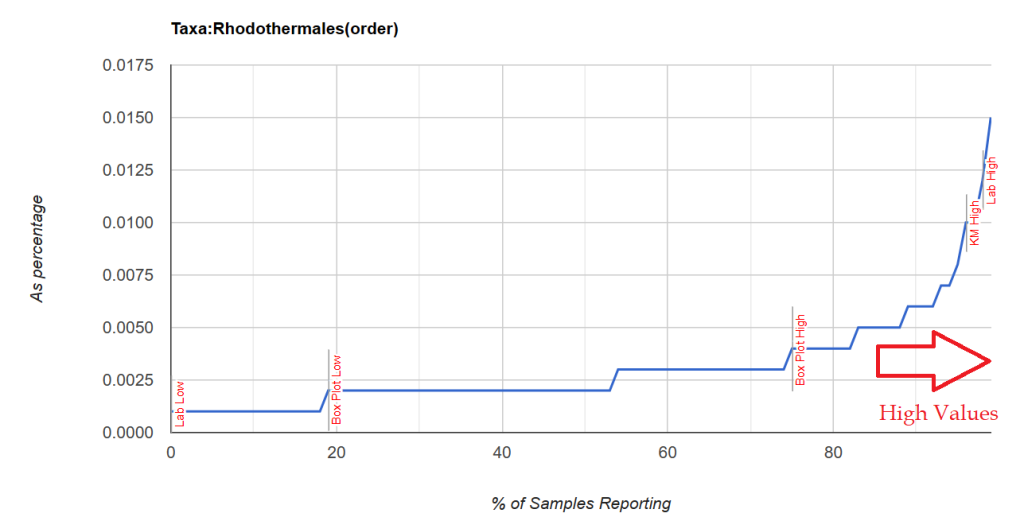
This is an update Jason Hawrelak Criteria for Healthy Gut. His criteria is based on percentages and used by medical practitioners around the world. I have three significant collections of samples and decided to find out how these percentages translate to percentile for each lab.

They are similar and not similar. For example 50% of people will have low Akkermansia using uBiome while Biomesight increases it to 77%. Alistipes — are never out of range for Biomesight while 90% of people using uBiome would be too high.

Taxa NameTaxa RankPercentageuBiome PercentileOmbre PercentileBiomesight Percentile
Akkermansiagenus1 – 548 – 8071 – 9177 – 93
Alistipesgenus0 – 0.30 – 100 – 330 – 100
Bacteroidesgenus0 – 200 – 320 – 480 – 45
Bacteroidiaclass0 – 350 – 240 – 400 – 45
Bifidobacteriumgenus2.5 – 578 – 9178 – 8790 – 95
Bilophila wadsworthiaspecies0 – 0.150 – 320 – 430 – 44
Blautiagenus5 – 1015 – 6032 – 7224 – 69
Desulfovibriogenus0 – 0.150 – 460 – 420 – 72
Escherichia colispecies0 – 0.10 – 1000 – 750 – 88
Eubacteriumgenus0 – 150 – 1000 – 990 – 100
Faecalibacterium prausnitziispecies10 – 1580 – 9550 – 6946 – 69
Fusobacteriumgenus0 – 0.010 – 400 – 660 – 72
Lactobacillusgenus0.01 – 123 – 939 – 7546 – 99
Methanobrevibactergenus0 – 0.010 – 70 – 330 – 33
Oxalobactergenus0.01 – 10 – 10038 – 10035 – 100
Prevotellagenus0 – 250 – 1000 – 890 – 88
Pseudomonadotaphylum0 – 40 – 520 – 760 – 54
Roseburiagenus5 – 1051 – 8685 – 9681 – 95
Ruminococcusgenus0 – 150 – 1000 – 9810- 95

This post is intended to illustrate that percentages cannot be determined by one lab and applied to another. Percentile appears to be more robust.

Evolution of Addressing Microbiome/Gut issues

There are generations of approaches. Often limited to the knowledge available at the time

Generation #1: Eat Fermented Foods as a Cure All

This dates back millennium in the east and the west. It helps some, and thus is validated as working (for some at least). For example, Garum in ancient Greece

Generation #2: Yogurt and Probiotics

In western culture, The Russian biologist and Nobel laureate Ilya Mechnikov, from the Institut Pasteur in Paris, was influenced by Grigorov’s work and hypothesized that regular consumption of yogurt was responsible for the unusually long lifespans of Bulgarian peasants.[25] Believing Lactobacillus to be essential for good health, Mechnikov worked to popularize yogurt as a foodstuff throughout Europe. [Wikipedia]

Generation #3: Bacteria Shifts

This arose out of the new technologies to identify bacteria in better detail. This was in the 1950’s and later [Experience with antibiotics. II. Shifts in bacterial flora in man].

There are several generation of technology involved here.

“A significant difference in gut microbial composition between SARS-CoV-2 positive and negative samples was observed, with Klebsiella and Agathobacter being enriched in the positive cohort.”

The gut microbiome of COVID-19 recovered patients returns to uninfected status in a minority-dominated United States cohort [2021]

These studies indicates an increase or decrease in the average for populations. There is no thresholds where the odds change nor relative magnitude. This is further complicated by non-replication by other researchers — the reason is often because on non-standardization of microbiome analysis

Generation #4: Lab Specific Shifts with critical levels and contributions

Using large dataset and techniques such as those described in Symptoms with Ability to Predict from Microbiome Results. We have the ability to set threshold and determine the relative importance. The table below is for Long COVID based on one lab’s pipeline. We can easy see the pattern — often, it is a relatively rare bacteria(low prevalence) that is seen in significant levels in Long COVID patients

This allows identification of the genus (or other ranks) that may be ascribe to the condition if over the 84%ile. It also allows the relative importance of each to be evaluated since there may be multiple targeted bacteria. Chi2 value is a reasonable proxy for importance.

Moving up the taxonomical rank, we see at the ORDER level that one order is really significant.

Bottom Line

IMHO, this last method allows superior identification of bacteria involved with conditions and symptoms using two simple cutoff points: <= 16%ile and >=84%ile. Other cutoff points are possible,
We can then look at a patient’s microbiome (assuming suitable lab-pipeline) and identify with statistical accuracy which bacteria are involved. Not only can we identify the bacteria — we can determine the relative importance of each bacteria.

Strong Genus association to many conditions

This week I refactor the genus association algorithm resulting in clearer results. I also change it so the common person can understand what is being reported.

The core is that once we convert percentage to percentiles, we end up with a “flat” or uniform distribution. For any genus, we have the same number in 0-10%ile, 50-60%ile and 90-100%. If there is no association, we should see the same number in the 0-16%ile and 84-100%ile. If there are not, we can compute the statistical significance (I picked p < 0.01 or one chance in 100 of not being a true association).

Below, we will cover 2 pages and a FYI:

Extreme Associations

Processing without considering genus (i.e. all tax ranks) The following association occurs with extremely high statistical associations to many conditions.

This does not mean that it is a cause, but may indicate these bacteria prosper with the disruption associated with the condition. An example is below

Note that these are almost always present, it is when the percentile ranking exceeds 84%ile that we have a strong indicator which is illustrated below with two distributions. Note that the amount is small.

Unfortunately, restricting to genus level resulted in nothing.

Overview by symptom

This lists all of the symptoms found significant in various lab processing pipeline. The number depends on the number of samples contributed and the number of samples annotated with symptoms. This page is recomputed and updated on the 2nd of each month; more data means more associations.

Note Taxa identification is fuzzy and should never be assumed to be “correct”. The same FASTQ file processed thru ubiome, Ombre, Biomesight and Sequentia biotech; resulted in different genus being reported with different amounts. Clearly, the associations is processing pipeline dependent.

Genus identification

Looking at Immune Manifestations: Constipation we can compare results across different tests

We see the 3 are in consensus for Butyricimonas being increased and one is silent. We see 2 are in consensus for Lachnobacterium being increased, and two are silent (at the moment, waiting for more data). Two are in consensus for Desulfosporosinus being decreased with two silent.

The lab processing pipeline is very significant for detection rate (for Butyricimonas , one detects it 57% or the time and another lab 77% of the time) and the amount reported.