KEGG Supplement Suggestions Updated

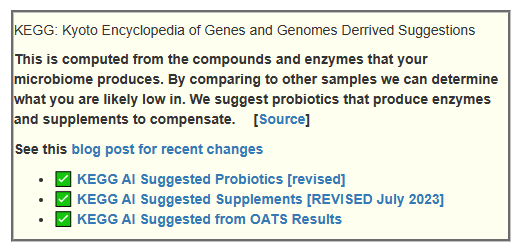
The KEGG: Kyoto Encyclopedia of Genes and Genomes provides detail information on the enzymes by strains. These enzymes determine what is produced and consumed. Not 100% guaranteed (enzyme activation depends on multiple item), but sufficient to use Fuzzy Logic on it.

I had taken a first crack at using this information a few years ago without outstanding results, and had marked the option as being deprecated.

This last week, I got this email from a reader

Another experiment , taking 500mg of tyrosine. Old test showed low dopamine and noriepinephrine . Man I feel so much better. My ADD symptoms went away and i can lock in and get so much done. Energy is better. The question is, why does that work so well , I eat meat all the time and protein powder? Why was my dopamine/noriepinephrine low to begin with , what is the cause and how do I fix it so I don’t need to supplement 🤔🤔🤔

Open to ideas, thanks!!

My first step was to find the old menu item where estimates for compound produced and consumed are calculated. His level for tyrosine net was very very low. Hence, connecting the dots — we see why the supplement improved things for him.

The second part was more interesting. How to avoid a need to supplement? His levels being very low means looking at the bacteria that consumes and produces it with a goal of changing them.
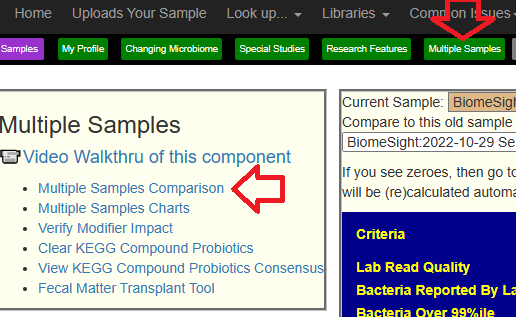
Update Menu Item

This is on the Changing Microbiome Tab

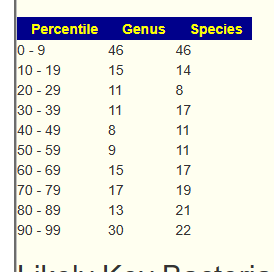
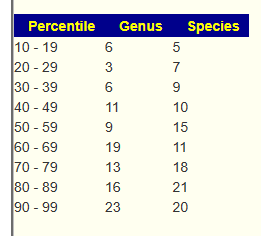
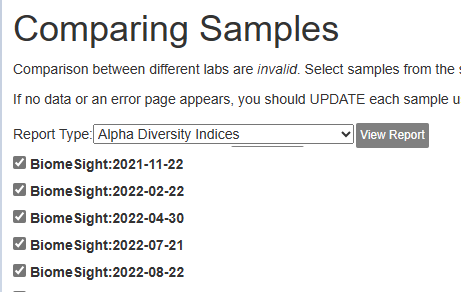
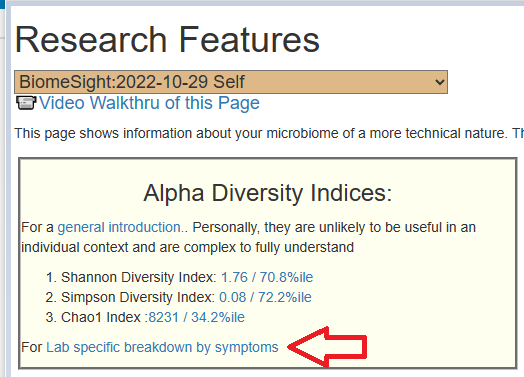
Clicking it will show the estimates for your microbiome.

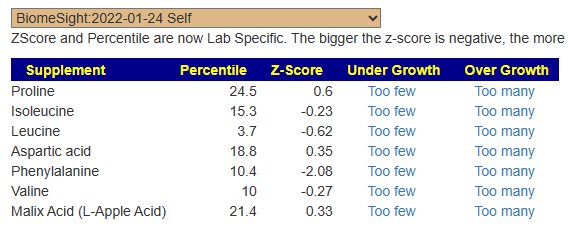
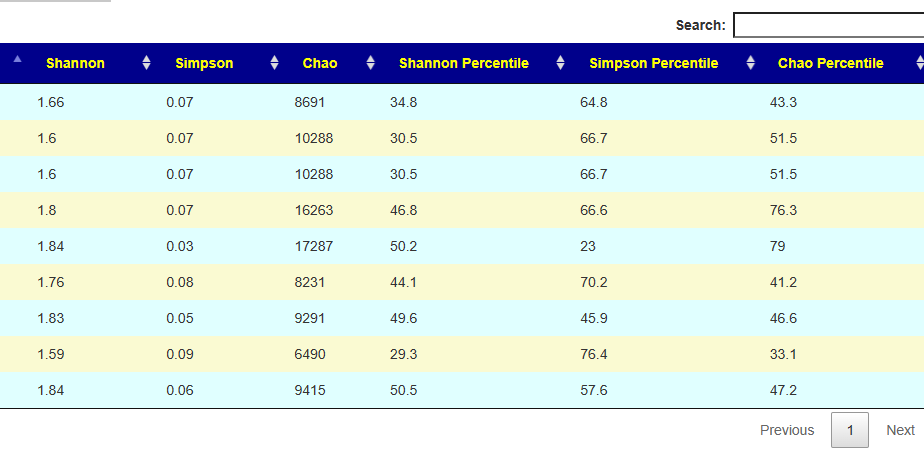
As with most things microbiome, the distributions are never normal. To facilitate picking the best items to focus on for experiments. You want a low percentile and a large negative z-score. A positive z-score indicates that the number is above the average (mean) and likely not to be concerned above.

There are 4 items listed that I would suggest experimenting with — by experiment I mean, try taking supplements (one at a time) for 2 weeks each and see if there are any subjective changes. For me the items are:

  • Phenylalanine
  • Leucine
  • Valine
  • Isoleucine

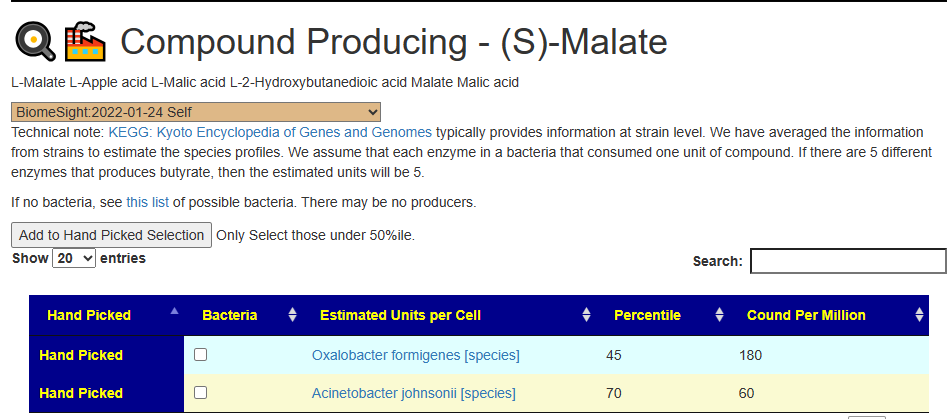
Clicking on too few will show which bacteria. This may be a blank table.

Clicking too many will show the consumers

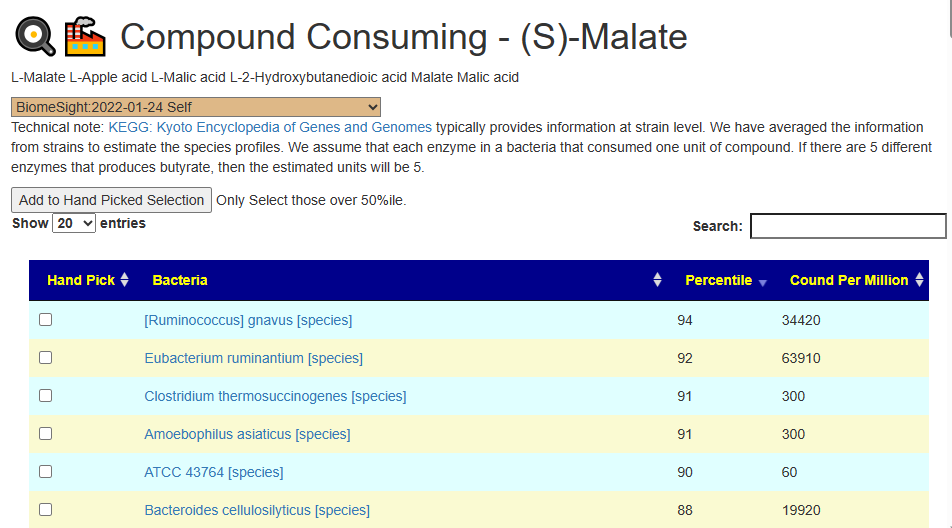
You can then hand-picked bacteria that you are interested in altering.

Bottom Line

This is intended to be used experimentally — that is, the suggested supplements should be tested. Ideally with objective measurement, but with the reality of time delays and costs, subjective measurements may be the best that is practical.

If the supplement helps, then (and only then), you should try to alter your microbiome to correct the microbiome imbalance.

Identifying Supplements you may need from KEGG data and your microbiome. – YouTube

What is looked for:

  • Alanine
  • Arginine
  • Asparagine
  • Aspartic acid
  • Biotin (Vitamin H)
  • Carnitine
  • Cysteine
  • Folate (Vitamin B9)
  • Glutamic Acid
  • Glutamine
  • Glycine
  • Histidine
  • Isoleucine
  • Leucine
  • Lysine
  • Malic Acid (L-Apple Acid)
  • Methionine
  • NAC (N-Acetyl-L-cysteine)
  • NADH (Nicotinamide adenine dinucleotide)
  • Phenylalanine
  • Proline
  • Riboflavin (Vitamin B2)
  • Serine
  • Thiamine (Vitamin B1)
  • Threonine
  • Tryptophan
  • Tyrosine
  • Valine
  • Vitamin B12(Cobalamin (III) Cob(III)alamin )
  • Vitamin C (Ascorbate)
  • Vitamin D2(Ergocalciferol )
  • Vitamin D3(Cholecalciferol Calciol )
  • Vitamin E (alpha-Tocopherol)
  • Vitamin K
  • Vitamin K2 (Menaquinone)

My ME/CFS Recovery in Objective Microbiome Measurements

For more analysis of ME/CFS and Long COVID see this list.

Percentile’s Percentage

Below are my numbers during a flare — I had the typical over-representation of 0-9%ile seen in most ME/CFS and Long-COVID samples.

After going into Remission, the low percentile counts dropped massively

Alpha Diversity

During Flare

After going into Remission, the two Diversity Index increases significantly. Common belief is that the higher the diversity indices, the better it is for a person. Diversity index typically decreases with age as age related conditions increase.

Dr. Jason Hawrelak Recommendations did not reflect the change. At 98.8%ile during the flare and dropping to 89%ile with remission.

In the Bacteria Deem Unhealthy, Rickettsia was at 77%ile, Legionella was 100% and our anti-inflammation bacteria Faecalibacterium prausnitzii was done to 16%ile [Human CD4+CD8α+ Tregs induced by Faecalibacterium prausnitzii protect against intestinal inflammation]. With remission the first two bacteria disappeared and Faecalibacterium prausnitzii went up to 87%ile.

Seeing the Rickettsia spike reminds me of Cecile Jadin’s work from the 1990’s where this bacteria was very frequently identified in ME/CFS patients using specialized tests.

Bottom Line

We have some clear patterns associated with ME/CFS and Long COVID. It is my belief that the microbiome is a very significant player in this condition and that by correcting abnormal shifts by diet, supplements, antibiotics, etc, remission is probable for many. How to correct is very specific to an individual’s microbiome. There is no universal protocol.

More on Alpha Diversity Indices

Alpha Diversity Indices are not useful in determining how to improve your microbiome. They can be useful to see if your microbiome is improving. Below, I have a table from on long time user of the site below. There was COVID around Jan 2023 and other issues too.

We can see that all of the three indices are moving towards 50%ile, that is typical, overtime. What is ideal for each index is poorly defined. As you can see below — indices averages changes by age so an goal would be to have an index associated with a age younger than you are.

See Symptoms versus Alpha Diversity Indices for the first pass on this topic.

How do we get to this table? Go to Multiple Samples tab and then select Multiple Samples Comparison as shown below.

Then just pick the desired samples. They must all be from the same lab.

Enhancement

On the Research Features tab, we have our new panel. The numbers are now lab specific. The Diversity numbers can be very dissimilar between labs. We have also added information on diversity seen for different self-reported symptoms.

This page can be very interesting to explore. For example Some indices decreases as you age, and other increases. If you want to slow aging (and thus age related medical conditions), you want to work at changing the indices a bit (how is not clear).

For a condition like Long COVID we see that the Shannon Percentile is at 32%ile, i.e. a drop in different species. This matches what is seen with ME/CFS

The Literature

We find some of the above results reflected in study

Bottom Line

None of these indices lead to treatment suggestions. They will be cited in studies on occasion. The lab breakdown by symptoms is likely better data then what will be found in studies — because the distribution is dependent on the lab, i.e. part of The taxonomy nightmare before Christmas…