This year I have been focusing on a deep review of the code to improve accuracy and to address a variety of issues. The first item was redoing all of the KEGG Derived data (deriving compounds and enzymes at the species level instead of random strains). See KEGG Data being updated
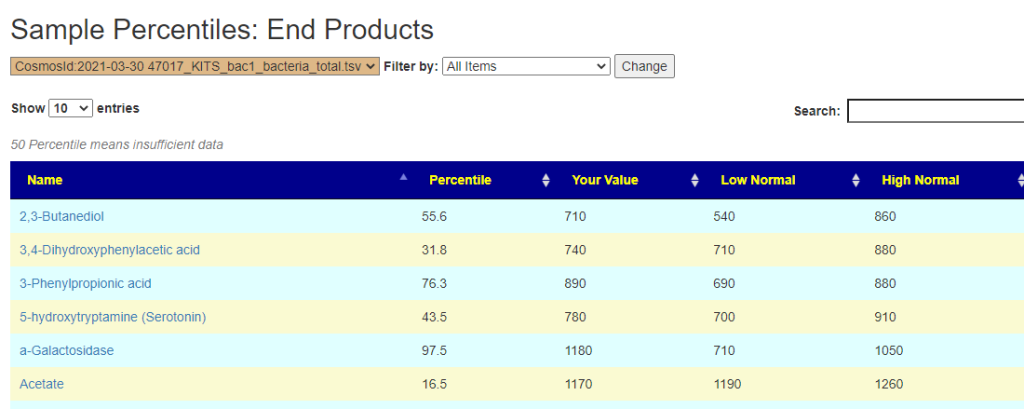
The second item was cleaning up percentile computations on samples for:
- Taxonomy
- End Products
- Compound Produced (KEGG)
- Compound Consumed (KEGG)
- Net Compound (Produced – Consumed) (KEGG)
- Enzymes (KEGG)
- Medical Conditions (US National Library of Medicine)
Combined with this was also implementing Display Levels across menu. See Display Levels.
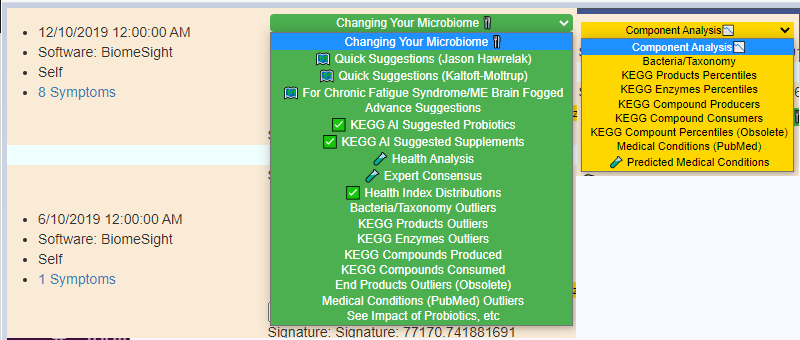
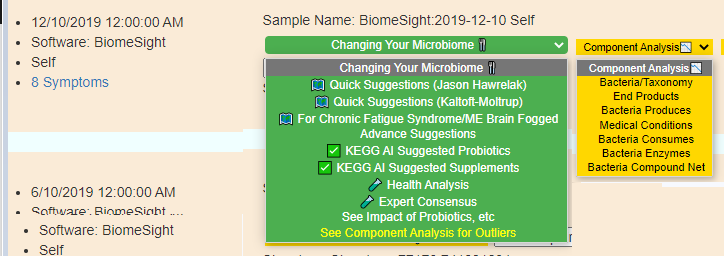
Existing Menu Items
New Menu Items
Display Level: Public
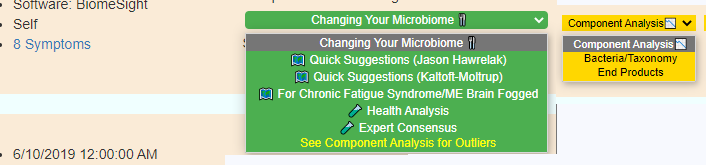
Display Level: Beginner
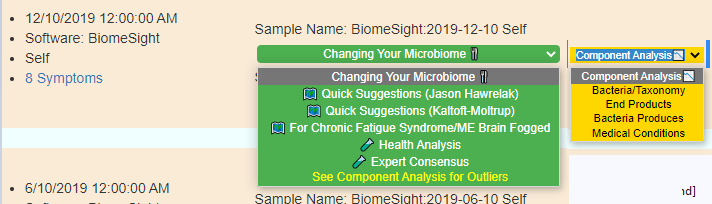
Display Level: Intermediate
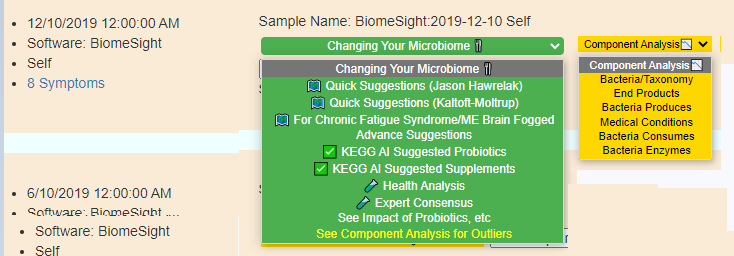
Display Level: Advance
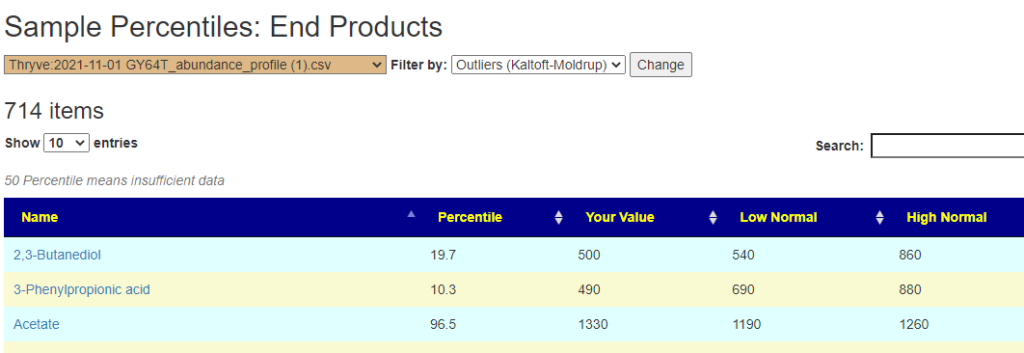
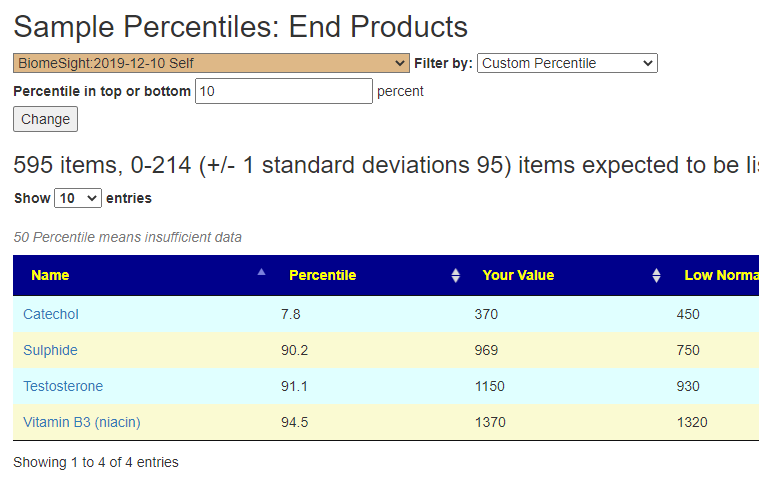
Outliers Improved
In the earlier version, outliers and full data was on two separate pages. These has been combined into a single page with more options.
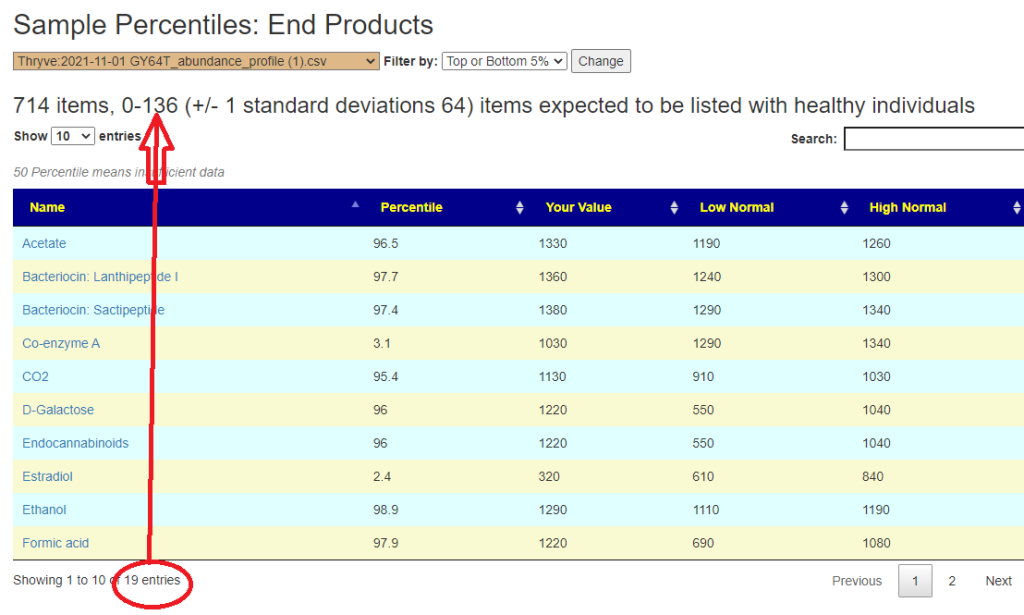
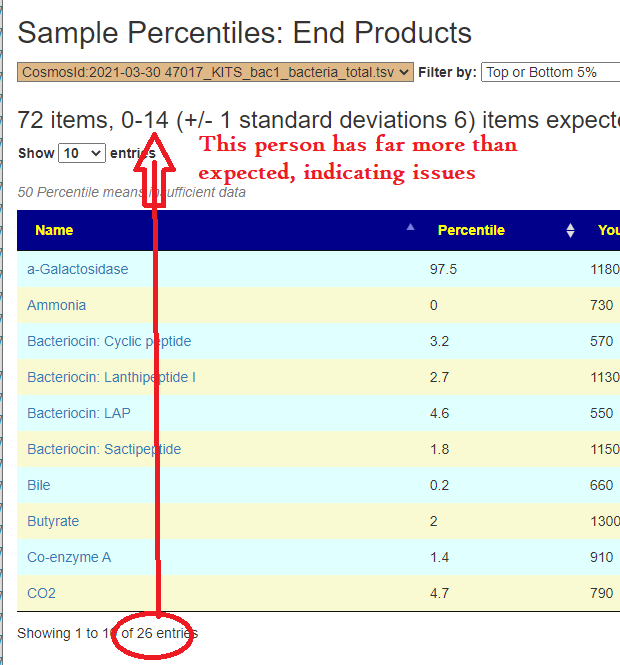
Are your abnormal?
Calculations are done for you to indicate the level where values may be out of range by random chance. This is illustrated below.
Bottom Line
I am hoping to have testing completed by the end of March and will then deploy
Recent Comments