NCBI
Taxon | name | rank | skewness |
| 291645 | Bacteroides nordii | species | 29.799 |
| 2759 | Eukaryota | superkingdom | 29.558 |
| 333367 | Enterocloster asparagiformis | species | 29.538 |
| 518636 | [Clostridium] asparagiforme DSM 15981 | strain | 29.538 |
| 117743 | Flavobacteriia | class | 29.525 |
| 200644 | Flavobacteriales | order | 29.525 |
| 712633 | Streptococcus sp. oral taxon 431 | species | 28.849 |
| 2759692 | Streptococcus sp. Marseille-Q3533 | species | 28.405 |
| 712623 | Streptococcus sp. oral taxon 061 | species | 28.334 |
| 2972784 | Streptococcus sp. Marseille-Q6470 | species | 28.229 |
| 1386 | Bacillus | genus | 28.215 |
| 2005473 | Muribaculaceae | family | 28.206 |
| 68892 | Streptococcus infantis | species | 27.604 |
| 1736 | Eubacterium limosum | species | 27.486 |
| 2714358 | Pusillibacter faecalis | species | 27.285 |
| 2892397 | Pusillibacter | genus | 27.285 |
| 4751 | Fungi | kingdom | 26.227 |
| 347253 | Streptococcus salivarius JIM8777 | strain | 26.222 |
| 2690837 | Eggerthella guodeyinii | species | 26.159 |
| 2762318 | Weeksellaceae | family | 25.877 |
| 1839799 | Streptococcus sp. FDAARGOS_192 | species | 25.823 |
| 4890 | Ascomycota | phylum | 25.785 |
| 468 | Moraxellaceae | family | 25.736 |
| 2887326 | Moraxellales | order | 25.736 |
| 72274 | Pseudomonadales | order | 25.621 |
| 2682456 | Veillonella nakazawae | species | 25.587 |
| 135621 | Pseudomonadaceae | family | 25.569 |
| 469 | Acinetobacter | genus | 25.496 |
| 1547 | Thomasclavelia ramosa | species | 25.361 |
| 191303 | Turicibacter | genus | 25.108 |
| 2810281 | Turicibacteraceae | family | 25.108 |
| 387661 | Parabacteroides johnsonii | species | 25.06 |
| 2529408 | Schaalia | genus | 24.99 |
| 1918540 | Muribaculum | genus | 24.929 |
| 1683 | Bifidobacterium angulatum | species | 24.806 |
| 4892 | Saccharomycetales | order | 24.79 |
| 4891 | Saccharomycetes | class | 24.79 |
| 1852377 | Actinomyces pacaensis | species | 24.588 |
| 197614 | Streptococcus pasteurianus | species | 24.543 |
| 1297617 | Intestinimonas butyriciproducens | species | 24.533 |
| 1392389 | Intestinimonas | genus | 24.533 |
| 28127 | Hoylesella buccalis | species | 24.515 |
| 2610896 | Streptococcus sp. LPB0220 | species | 24.27 |
| 1689 | Bifidobacterium dentium | species | 24.136 |
| 1871022 | Parolsenella massiliensis | species | 24.122 |
| 286 | Pseudomonas | genus | 23.772 |
| 2974257 | Hoylesella | genus | 23.703 |
| 2735723 | Turicibacter bilis | species | 23.682 |
| 1679 | Bifidobacterium longum subsp. longum | subspecies | 23.208 |
| 1944646 | Phoenicibacter congonensis | species | 23.137 |
| 1981050 | Phoenicibacter | genus | 23.137 |
| 1329 | Streptococcus canis | species | 22.882 |
| 1316408 | Streptococcus sp. HSISM1 | species | 22.835 |
| 726 | Haemophilus haemolyticus | species | 22.752 |
| 1505 | Paraclostridium sordellii | species | 22.63 |
| 1849828 | Paeniclostridium | genus | 22.63 |
| 1981510 | Monoglobus pectinilyticus | species | 22.567 |
| 2039302 | Monoglobus | genus | 22.567 |
| 2834348 | Caproicibacterium | genus | 22.417 |
| 186804 | Peptostreptococcaceae | family | 22.213 |
| 49546 | Flavobacteriaceae | family | 22.14 |
| 186817 | Bacillaceae | family | 22.035 |
| 45634 | Streptococcus cristatus | species | 21.74 |
| 1712675 | Turicibacter sp. H121 | species | 21.688 |
| 838 | Prevotella | genus | 21.625 |
| 86332 | Mogibacterium pumilum | species | 21.611 |
| 1903409 | Erwiniaceae | family | 21.56 |
| 2606626 | Sodaliphilus pleomorphus | species | 21.511 |
| 2815786 | Sodaliphilus | genus | 21.511 |
| 1903414 | Morganellaceae | family | 21.495 |
| 32067 | Leptotrichia | genus | 21.272 |
| 1129771 | Leptotrichiaceae | family | 21.258 |
| 135625 | Pasteurellales | order | 21.187 |
| 712 | Pasteurellaceae | family | 21.187 |
| 1433513 | Streptococcus gwangjuense | species | 21.148 |
| 1812935 | Enterobacter roggenkampii | species | 21.039 |
| 2842531 | Solibaculum | genus | 20.918 |
| 2780922 | Solibaculum mannosilyticum | species | 20.918 |
| 2944914 | Allocoprobacillus halotolerans | species | 20.909 |
| 3059504 | Allocoprobacillus | genus | 20.909 |
| 76860 | Streptococcus constellatus | species | 20.905 |
| 889201 | Streptococcus cristatus ATCC 51100 | strain | 20.893 |
| 206351 | Neisseriales | order | 20.791 |
| 199 | Campylobacter concisus | species | 20.784 |
| 195 | Campylobacter coli | species | 20.759 |
| 724 | Haemophilus | genus | 20.749 |
| 481 | Neisseriaceae | family | 20.706 |
| 43675 | Rothia mucilaginosa | species | 20.655 |
| 482 | Neisseria | genus | 20.599 |
| 2598453 | Streptococcus sp. 116-D4 | species | 20.541 |
| 548 | Klebsiella aerogenes | species | 20.51 |
| 39950 | Dialister pneumosintes | species | 20.383 |
| 59201 | Salmonella enterica subsp. enterica | subspecies | 20.349 |
| 133925 | Olsenella | genus | 20.343 |
| 729 | Haemophilus parainfluenzae | species | 20.246 |
| 518635 | Bifidobacterium angulatum DSM 20098 = JCM 7096 | strain | 20.207 |
| 2948573 | Peptoniphilus sp. SAHP1 | species | 20.133 |
| 1328 | Streptococcus anginosus | species | 20.096 |
| 2767842 | Lactiplantibacillus | genus | 20.094 |
| 1268 | Micrococcaceae | family | 19.951 |
| 32207 | Rothia | genus | 19.951 |
| 3018741 | Cellulosilyticaceae | family | 19.949 |
| 698776 | Cellulosilyticum | genus | 19.949 |
| 85006 | Micrococcales | order | 19.899 |
| 2530390 | Muribaculum gordoncarteri | species | 19.888 |
| 2049 | Actinomycetaceae | family | 19.868 |
| 2037 | Actinomycetales | order | 19.868 |
| 53335 | Pantoea | genus | 19.864 |
| 72294 | Campylobacteraceae | family | 19.835 |
| 194 | Campylobacter | genus | 19.835 |
| 84642 | Aeromonadaceae | family | 19.819 |
| 28037 | Streptococcus mitis | species | 19.786 |
| 642 | Aeromonas | genus | 19.782 |
| 862965 | Haemophilus parainfluenzae T3T1 | strain | 19.769 |
| 158 | Treponema denticola | species | 19.679 |
| 162289 | Peptoniphilus | genus | 19.612 |
| 446660 | Adlercreutzia equolifaciens | species | 19.516 |
| 33958 | Lactobacillaceae | family | 19.511 |
| 28211 | Alphaproteobacteria | class | 19.479 |
| 204441 | Rhodospirillales | order | 19.456 |
| 165779 | Anaerococcus | genus | 19.293 |
| 433 | Acetobacteraceae | family | 19.269 |
| 543314 | Eubacteriales Family XIII. Incertae Sedis | family | 19.231 |
| 1434011 | Komagataeibacter | genus | 19.071 |
| 65958 | Komagataeibacter oboediens | species | 19.071 |
| 1485 | Clostridium | genus | 18.944 |
| 938288 | Fenollaria massiliensis | species | 18.89 |
| 1686313 | Fenollaria | genus | 18.89 |
| 154288 | Turicibacter sanguinis | species | 18.829 |
| 135614 | Lysobacterales | order | 18.784 |
| 1578 | Lactobacillus | genus | 18.769 |
| 29547 | Campylobacterota | phylum | 18.752 |
| 3031852 | Epsilonproteobacteria | class | 18.752 |
| 213849 | Campylobacterales | order | 18.749 |
| 1686 | Bifidobacterium catenulatum | species | 18.656 |
| 2942994 | Buchavirus | genus | 18.627 |
| 573 | Klebsiella pneumoniae | species | 18.592 |
| 1776384 | Emergencia timonensis | species | 18.586 |
| 1926556 | Emergencia | genus | 18.586 |
| 1639133 | Citrobacter portucalensis | species | 18.58 |
| 1648923 | Bacillus paralicheniformis | species | 18.559 |
| 136 | Spirochaetales | order | 18.546 |
| 2845253 | Treponemataceae | family | 18.545 |
| 157 | Treponema | genus | 18.545 |
| 506 | Alcaligenaceae | family | 18.54 |
| 674529 | Bacteroides faecis | species | 18.517 |
| 556259 | Bacteroides sp. D2 | species | 18.427 |
| 31979 | Clostridiaceae | family | 18.413 |
| 365659 | Streptococcus mitis B6 | strain | 18.407 |
| 1266 | Sarcina | genus | 18.393 |
| 2726954 | Sarcina sp. JB2 | species | 18.393 |
| 1522 | [Clostridium] innocuum | species | 18.363 |
| 150055 | Streptococcus lutetiensis | species | 18.303 |
| 1352 | Enterococcus faecium | species | 18.288 |
| 556499 | Propionibacterium acidifaciens | species | 18.151 |
| 78448 | Bifidobacterium pullorum | species | 18.142 |
| 78344 | Bifidobacterium pullorum subsp. gallinarum | subspecies | 18.142 |
| 1903412 | Hafniaceae | family | 18.071 |
| 1796646 | Muribaculum intestinale | species | 18.017 |
| 2864143 | Adlercreutzia equolifaciens subsp. equolifaciens | subspecies | 17.965 |
| 1384484 | Adlercreutzia equolifaciens DSM 19450 | strain | 17.965 |
| 292800 | Flavonifractor plautii | species | 17.91 |
| 946234 | Flavonifractor | genus | 17.91 |
| 32033 | Lysobacteraceae | family | 17.893 |
| 394340 | Adlercreutzia equolifaciens subsp. celatus | subspecies | 17.87 |
| 1649459 | Hungatella | genus | 17.797 |
| 154046 | Hungatella hathewayi | species | 17.79 |
| 2144175 | Megasphaera stantonii | species | 17.749 |
| 39778 | Veillonella dispar | species | 17.73 |
| 2682455 | Veillonella sp. S12025-13 | species | 17.715 |
| 1502 | Clostridium perfringens | species | 17.684 |
| 544 | Citrobacter | genus | 17.656 |
| 735 | Haemophilus parahaemolyticus | species | 17.649 |
| 257758 | Streptococcus pseudopneumoniae | species | 17.644 |
| 208962 | Escherichia albertii | species | 17.64 |
| 1054460 | Streptococcus pseudopneumoniae IS7493 | strain | 17.619 |
| 1903411 | Yersiniaceae | family | 17.596 |
| 680646 | Rothia mucilaginosa DY-18 | strain | 17.513 |
| 546 | Citrobacter freundii | species | 17.495 |
| 2766537 | Caproicibacterium amylolyticum | species | 17.401 |
| 629 | Yersinia | genus | 17.393 |
| 1114965 | Streptococcus parasanguinis FW213 | strain | 17.387 |
| 40323 | Stenotrophomonas | genus | 17.334 |
| 2819619 | Streptococcus toyakuensis | species | 17.312 |
| 1590 | Lactiplantibacillus plantarum | species | 17.249 |
| 1318 | Streptococcus parasanguinis | species | 17.246 |
| 1343 | Streptococcus vestibularis | species | 17.105 |
| 328812 | Parabacteroides goldsteinii | species | 17.067 |
| 204455 | Rhodobacterales | order | 17.018 |
| 1257 | Peptostreptococcus | genus | 16.978 |
| 1385942 | Bifidobacterium breve 689b | strain | 16.943 |
| 760570 | Streptococcus parasanguinis ATCC 15912 | strain | 16.903 |
| 1463165 | Klebsiella quasipneumoniae | species | 16.89 |
| 747 | Pasteurella multocida | species | 16.833 |
| 203691 | Spirochaetota | phylum | 16.832 |
| 203692 | Spirochaetia | class | 16.832 |
| 2005386 | Arabiibacter | genus | 16.719 |
| 1870985 | Arabiibacter massiliensis | species | 16.719 |
| 28901 | Salmonella enterica | species | 16.716 |
| 105841 | Anaerostipes caccae | species | 16.663 |
| 61645 | Enterobacter asburiae | species | 16.658 |
| 1234680 | Streptococcus rubneri | species | 16.63 |
| 827 | Campylobacter ureolyticus | species | 16.573 |
| 85023 | Microbacteriaceae | family | 16.569 |
| 31989 | Paracoccaceae | family | 16.523 |
| 1260 | Finegoldia magna | species | 16.507 |
| 150022 | Finegoldia | genus | 16.507 |
| 54005 | Peptoniphilus harei | species | 16.453 |
| 1303 | Streptococcus oralis | species | 16.443 |
| 1918385 | Acutalibacter | genus | 16.383 |
| 1796620 | Acutalibacter muris | species | 16.383 |
| 2877527 | Blautia parvula | species | 16.379 |
| 1313 | Streptococcus pneumoniae | species | 16.378 |
| 487173 | Dialister succinatiphilus | species | 16.179 |
| 90964 | Staphylococcaceae | family | 16.134 |
| 1847725 | Lawsonella | genus | 16.112 |
| 1528099 | Lawsonella clevelandensis | species | 16.112 |
| 2805586 | Lawsonellaceae | family | 16.112 |
| 438033 | Ruminococcus gauvreauii | species | 16.111 |
| 1385 | Bacillales | order | 16.095 |
| 1314 | Streptococcus pyogenes | species | 16.081 |
| 590 | Salmonella | genus | 16.055 |
| 203490 | Fusobacteriia | class | 16.054 |
| 32066 | Fusobacteriota | phylum | 16.054 |
| 203491 | Fusobacteriales | order | 16.054 |
| 2743582 | Peptacetobacter | genus | 16.025 |
| 89152 | Peptacetobacter hiranonis | species | 16.025 |
| 447020 | Adlercreutzia | genus | 15.996 |
| 28126 | Segatella buccae | species | 15.942 |
| 583 | Proteus | genus | 15.938 |
| 137591 | Weissella cibaria | species | 15.924 |
| 1279 | Staphylococcus | genus | 15.923 |
| 1491 | Clostridium botulinum | species | 15.889 |
| 1357 | Lactococcus | genus | 15.888 |
| 135624 | Aeromonadales | order | 15.838 |
| 1358 | Lactococcus lactis | species | 15.828 |
| 739 | Aggregatibacter segnis | species | 15.766 |
| 862962 | Bacteroides fragilis 638R | strain | 15.764 |
| 2058152 | Klebsiella grimontii | species | 15.755 |
| 203492 | Fusobacteriaceae | family | 15.747 |
| 44008 | Enterococcus cecorum | species | 15.738 |
| 613 | Serratia | genus | 15.733 |
| 848 | Fusobacterium | genus | 15.669 |
| 221027 | Treponema putidum | species | 15.655 |
| 59732 | Chryseobacterium | genus | 15.65 |
| 626932 | Alistipes indistinctus | species | 15.619 |
| 564 | Escherichia fergusonii | species | 15.553 |
| 712122 | Actinomyces sp. oral taxon 414 | species | 15.55 |
| 158787 | Bifidobacterium scardovii | species | 15.539 |
| 1150461 | Bifidobacterium scardovii JCM 12489 = DSM 13734 | strain | 15.539 |
| 742737 | Hungatella hathewayi WAL-18680 | strain | 15.511 |
| 766764 | Debaryomycetaceae | family | 15.464 |
| 839 | Xylanibacter ruminicola | species | 15.445 |
| 2806443 | Turicibacter sp. TJ11 | species | 15.413 |
| 1762 | Mycobacteriaceae | family | 15.41 |
| 858619 | Corynebacterium variabile DSM 44702 | strain | 15.399 |
| 1727 | Corynebacterium variabile | species | 15.399 |
| 727 | Haemophilus influenzae | species | 15.393 |
| 538949 | uncultured Alistipes sp. | species | 15.379 |
| 1902136 | Streptococcus sp. NPS 308 | species | 15.327 |
| 1470540 | Jeotgalibaca | genus | 15.236 |
| 376805 | Phocaeicola salanitronis | species | 15.193 |
| 667015 | Phocaeicola salanitronis DSM 18170 | strain | 15.193 |
| 544448 | Mycoplasmatota | phylum | 15.185 |
| 37734 | Enterococcus casseliflavus | species | 15.155 |
| 3025755 | Thomasclavelia | genus | 15.148 |
| 265 | Paracoccus | genus | 15.116 |
| 1737405 | Tissierellales | order | 15.088 |
| 33037 | Anaerococcus vaginalis | species | 15.071 |
| 1570339 | Peptoniphilaceae | family | 15.069 |
| 2763022 | Bacteroides sp. M10 | species | 14.944 |
| 582 | Morganella morganii | species | 14.935 |
| 581 | Morganella | genus | 14.935 |
| 160674 | Raoultella | genus | 14.922 |
| 547 | Enterobacter | genus | 14.904 |
| 499174 | Clostridioides difficile QCD-23m63 | strain | 14.886 |
| 2749267 | Amedibacterium | genus | 14.848 |
| 2583452 | Amedibacterium intestinale | species | 14.848 |
| 287 | Pseudomonas aeruginosa | species | 14.848 |
| 2585117 | Alistipes onderdonkii subsp. vulgaris | subspecies | 14.823 |
| 76859 | Fusobacterium animalis | species | 14.814 |
| 28038 | Latilactobacillus curvatus | species | 14.798 |
| 2816960 | Lactococcus cremoris subsp. cremoris | subspecies | 14.767 |
| 33959 | Lactobacillus johnsonii | species | 14.762 |
| 568 | Hafnia | genus | 14.713 |
| 46867 | Clostridium chauvoei | species | 14.685 |
| 837 | Porphyromonas gingivalis | species | 14.682 |
| 908937 | Prevotella dentalis DSM 3688 | strain | 14.674 |
| 52227 | Prevotella dentalis | species | 14.674 |
| 1104322 | Lactococcus cremoris subsp. cremoris A76 | strain | 14.606 |
| 2810280 | Coprobacillaceae | family | 14.602 |
| 571 | Klebsiella oxytoca | species | 14.567 |
| 1903410 | Pectobacteriaceae | family | 14.528 |
| 712150 | Aggregatibacter sp. oral taxon 513 | species | 14.524 |
| 2497860 | Cellulosilyticum sp. WCF-2 | species | 14.522 |
| 538 | Eikenella | genus | 14.517 |
| 2966552 | Thermocaproicibacter melissae | species | 14.504 |
| 3048127 | Thermocaproicibacter | genus | 14.504 |
| 579 | Kluyvera | genus | 14.489 |
| 76892 | Caulobacteraceae | family | 14.485 |
| 204458 | Caulobacterales | order | 14.485 |
| 85009 | Propionibacteriales | order | 14.472 |
| 31957 | Propionibacteriaceae | family | 14.471 |
| 1335 | Streptococcus equinus | species | 14.462 |
| 745 | Pasteurella | genus | 14.445 |
| 4893 | Saccharomycetaceae | family | 14.398 |
| 97138 | Clostridium sp. MD294 | species | 14.388 |
| 1868794 | Jeotgalibaca arthritidis | species | 14.37 |
| 1504 | Clostridium septicum | species | 14.357 |
| 4930 | Saccharomyces | genus | 14.354 |
| 158847 | Megamonas hypermegale | species | 14.331 |
| 205913 | Bifidobacterium longum DJO10A | strain | 14.315 |
| 72407 | Klebsiella pneumoniae subsp. pneumoniae | subspecies | 14.283 |
| 423211 | Streptococcus suis GZ1 | strain | 14.272 |
| 584 | Proteus mirabilis | species | 14.269 |
| 31969 | Mollicutes | class | 14.254 |
| 1499973 | Escherichia marmotae | species | 14.215 |
| 999416 | Parabacteroides distasonis CL03T12C09 | strain | 14.203 |
| 84162 | Cryptobacterium | genus | 14.188 |
| 469378 | Cryptobacterium curtum DSM 15641 | strain | 14.188 |
| 84163 | Cryptobacterium curtum | species | 14.188 |
| 95818 | Candidatus Saccharibacteria | phylum | 14.17 |
| 208479 | Enterocloster bolteae | species | 14.165 |
| 1229621 | Anaerostipes rhamnosivorans | species | 14.158 |
| 1322 | Blautia hansenii | species | 14.125 |
| 537007 | Blautia hansenii DSM 20583 | strain | 14.125 |
| 981540 | Streptococcus pasteurianus ATCC 43144 | strain | 14.114 |
| 1805478 | Olsenella timonensis | species | 14.114 |
| 28128 | Prevotella corporis | species | 14.058 |
| 135623 | Vibrionales | order | 14.053 |
| 641 | Vibrionaceae | family | 14.053 |
| 475 | Moraxella | genus | 14.035 |
| 410072 | Coprococcus comes | species | 14.022 |
| 1805431 | Enterococcus saigonensis | species | 14.018 |
| 53442 | Eubacterium callanderi | species | 14.007 |
| 762982 | Paraprevotella xylaniphila YIT 11841 | strain | 13.99 |
| 454155 | Paraprevotella xylaniphila | species | 13.99 |
| 411459 | Blautia obeum ATCC 29174 | strain | 13.974 |
| 186827 | Aerococcaceae | family | 13.966 |
| 1508657 | Ruminiclostridium | genus | 13.926 |
| 122277 | Pectobacterium | genus | 13.907 |
| 2942991 | Cohcovirus | genus | 13.901 |
| 5475 | Candida | genus | 13.862 |
| 208224 | Enterobacter kobei | species | 13.837 |
| 171551 | Porphyromonadaceae | family | 13.802 |
| 2093857 | Dysosmobacter welbionis | species | 13.801 |
| 2591381 | Dysosmobacter | genus | 13.801 |
| 836 | Porphyromonas | genus | 13.794 |
| 76857 | Fusobacterium polymorphum | species | 13.755 |
| 1891914 | Streptococcus oralis subsp. oralis | subspecies | 13.751 |
| 1134687 | Klebsiella michiganensis | species | 13.734 |
| 237 | Flavobacterium | genus | 13.709 |
| 1912216 | Cutibacterium | genus | 13.686 |
| 1287640 | Anaerococcus obesiensis | species | 13.685 |
| 539 | Eikenella corrodens | species | 13.674 |
| 305719 | Segatella baroniae | species | 13.643 |
| 46255 | Weissella | genus | 13.628 |
| 34062 | Moraxella osloensis | species | 13.621 |
| 1776379 | Leyella lascolaii | species | 13.605 |
| 1122992 | Hoylesella timonensis 4401737 = DSM 22865 = JCM 15640 | strain | 13.593 |
| 386414 | Hoylesella timonensis | species | 13.593 |
| 1582879 | Ezakiella | genus | 13.574 |
| 2715212 | Bacteroides faecium | species | 13.561 |
| 206389 | Rhodocyclales | order | 13.559 |
| 1529 | Clostridium cadaveris | species | 13.535 |
| 553973 | [Clostridium] hylemonae DSM 15053 | strain | 13.532 |
| 1217282 | Parabacteroides faecis | species | 13.519 |
| 315405 | Streptococcus gallolyticus | species | 13.508 |
| 41275 | Brevundimonas | genus | 13.484 |
| 80865 | Delftia | genus | 13.454 |
| 39777 | Veillonella atypica | species | 13.436 |
| 2942965 | Steigviridae | family | 13.434 |
| 1282 | Staphylococcus epidermidis | species | 13.421 |
| 2942980 | Kehishuvirus | genus | 13.411 |
| 2719313 | Enterocloster | genus | 13.394 |
| 879243 | Porphyromonas asaccharolytica DSM 20707 | strain | 13.371 |
| 28123 | Porphyromonas asaccharolytica | species | 13.371 |
| 2576376 | Streptococcus sp. 1643 | species | 13.366 |
| 1305 | Streptococcus sanguinis | species | 13.345 |
| 2692118 | Winkia | genus | 13.338 |
| 33007 | Winkia neuii | species | 13.338 |
| 2650157 | Bacteroides zhangwenhongii | species | 13.304 |
| 28133 | Prevotella nigrescens | species | 13.268 |
| 46507 | Ezakiella coagulans | species | 13.26 |
| 2899133 | Candidatus Nanosynbacter sp. HMT-352 | species | 13.255 |
| 1283 | Staphylococcus haemolyticus | species | 13.245 |
| 662 | Vibrio | genus | 13.232 |
| 4932 | Saccharomyces cerevisiae | species | 13.218 |
| 1490 | Paraclostridium bifermentans | species | 13.198 |
| 1849822 | Paraclostridium | genus | 13.198 |
| 1309 | Streptococcus mutans | species | 13.179 |
| 2026240 | Klebsiella quasivariicola | species | 13.176 |
| 51288 | Kluyvera ascorbata | species | 13.172 |
| 742725 | Alistipes indistinctus YIT 12060 | strain | 13.169 |
| 1918454 | Flintibacter | genus | 13.156 |
| 2610895 | Flintibacter sp. KGMB00164 | species | 13.156 |
| 5476 | Candida albicans | species | 13.141 |
| 3036302 | Mobiluncus massiliensis | species | 13.091 |
| 33043 | Coprococcus eutactus | species | 13.038 |
| 33208 | Metazoa | kingdom | 13.029 |
| 7711 | Chordata | phylum | 13.029 |
| 9443 | Primates | order | 13.029 |
| 9604 | Hominidae | family | 13.029 |
| 9605 | Homo | genus | 13.029 |
| 9606 | Homo sapiens | species | 13.029 |
| 40674 | Mammalia | class | 13.029 |
| 28025 | Bifidobacterium animalis | species | 13.025 |
| 561 | Escherichia | genus | 13.014 |
| 2584944 | Sutterella faecalis | species | 13.012 |
| 575 | Raoultella planticola | species | 12.997 |
| 2779518 | Blautia liquoris | species | 12.994 |
| 2050 | Mobiluncus | genus | 12.966 |
| 1385939 | Bifidobacterium breve JCM 7017 | strain | 12.917 |
| 1330545 | Lelliottia | genus | 12.91 |
| 204457 | Sphingomonadales | order | 12.863 |
| 2093818 | Candidatus Saccharimonadia | class | 12.854 |
| 2093822 | Candidatus Nanosynbacteraceae | family | 12.853 |
| 2093823 | Candidatus Nanosynbacter | genus | 12.853 |
| 2093819 | Candidatus Nanosynbacterales | order | 12.853 |
| 526525 | Erysipelotrichales | order | 12.849 |
| 526524 | Erysipelotrichia | class | 12.849 |
| 1622 | Ligilactobacillus murinus | species | 12.847 |
| 1737404 | Tissierellia | class | 12.831 |
| 33945 | Enterococcus avium | species | 12.735 |
| 28130 | Prevotella disiens | species | 12.698 |
| 2763669 | Qiania dongpingensis | species | 12.681 |
| 2944195 | Qiania | genus | 12.681 |
| 89153 | [Clostridium] hylemonae | species | 12.679 |
| 400634 | Lysinibacillus | genus | 12.654 |
| 712310 | Haemophilus sp. oral taxon 036 | species | 12.645 |
| 322095 | Porphyromonas somerae | species | 12.621 |
| 28449 | Neisseria subflava | species | 12.616 |
| 423477 | Veillonella rogosae | species | 12.607 |
| 158836 | Enterobacter hormaechei | species | 12.604 |
| 178339 | Pauljensenia hongkongensis | species | 12.598 |
| 2740557 | Pauljensenia | genus | 12.598 |
| 131110 | Schaalia radingae | species | 12.587 |
| 2772059 | uncultured phage cr50_1 | no rank | 12.573 |
| 2955711 | Cohcovirus hiberniae | species | 12.573 |
| 29466 | Veillonella parvula | species | 12.556 |
| 1359 | Lactococcus cremoris | species | 12.521 |
| 824 | Campylobacter gracilis | species | 12.501 |
| 137838 | Clostridium neonatale | species | 12.417 |
| 1046629 | Streptococcus salivarius 57.I | strain | 12.394 |
| 565040 | Bifidobacterium longum subsp. infantis 157F | strain | 12.379 |
| 1647 | Erysipelothrix | genus | 12.37 |
| 43769 | Corynebacterium propinquum | species | 12.369 |
| 1016 | Capnocytophaga | genus | 12.337 |
| 238749 | Diaphorobacter | genus | 12.321 |
| 248744 | Marvinbryantia | genus | 12.311 |
| 168384 | Marvinbryantia formatexigens | species | 12.311 |
| 478749 | Marvinbryantia formatexigens DSM 14469 | strain | 12.311 |
| 1747 | Cutibacterium acnes | species | 12.273 |
| 1531 | Enterocloster clostridioformis | species | 12.266 |
| 411490 | Anaerostipes caccae L1-92 | strain | 12.256 |
| 615 | Serratia marcescens | species | 12.245 |
| 1492 | Clostridium butyricum | species | 12.244 |
| 905 | Acidaminococcus fermentans | species | 12.231 |
| 591001 | Acidaminococcus fermentans DSM 20731 | strain | 12.231 |
| 2702 | Gardnerella vaginalis | species | 12.225 |
| 1200793 | Streptococcus salivarius K12 | strain | 12.194 |
| 2701 | Gardnerella | genus | 12.194 |
| 2901164 | Stutzerimonas | genus | 12.188 |
| 1348 | Streptococcus parauberis | species | 12.187 |
| 1796635 | Longicatena caecimuris | species | 12.186 |
| 1918536 | Longicatena | genus | 12.186 |
| 61646 | Lelliottia amnigena | species | 12.182 |
| 137732 | Granulicatella elegans | species | 12.177 |
| 1769710 | Sellimonas | genus | 12.175 |
| 1653434 | Sellimonas intestinalis | species | 12.175 |
| 2948688 | Delmidovirus | genus | 12.147 |
| 3029088 | Dethiosulfovibrionaceae | family | 12.147 |
| 81852 | Enterococcaceae | family | 12.113 |
| 2093824 | Candidatus Nanosynbacter lyticus | species | 12.113 |
| 1350 | Enterococcus | genus | 12.107 |
| 40324 | Stenotrophomonas maltophilia | species | 12.079 |
| 40520 | Blautia obeum | species | 12.06 |
| 638847 | Pyramidobacter | genus | 12.04 |
| 638849 | Pyramidobacter piscolens | species | 12.04 |
| 1334 | Streptococcus dysgalactiae | species | 12.023 |
| 1316254 | Veillonella parvula HSIVP1 | strain | 12.021 |
| 2905967 | Candidatus Minimicrobia | genus | 11.998 |
| 2841264 | Candidatus Minimicrobia vallesae | species | 11.998 |
| 1643824 | Atopobiaceae | family | 11.997 |
| 1912897 | Blautia argi | species | 11.99 |
| 82115 | Rhizobiaceae | family | 11.981 |
| 657309 | Bacteroides xylanisolvens XB1A | strain | 11.961 |
| 2942966 | Suoliviridae | family | 11.948 |
| 645 | Aeromonas salmonicida | species | 11.931 |
| 1750 | Arachnia propionica | species | 11.924 |
| 1871025 | Ndongobacter massiliensis | species | 11.9 |
| 1930845 | Ndongobacter | genus | 11.9 |
| 2734150 | Toutatisvirus toutatis | species | 11.891 |
| 2733138 | Toutatisvirus | genus | 11.891 |
| 2070187 | Faecalibacterium phage FP_Toutatis | no rank | 11.891 |
| 1351 | Enterococcus faecalis | species | 11.885 |
| 1598 | Limosilactobacillus reuteri | species | 11.871 |
| 1653 | Corynebacteriaceae | family | 11.858 |
| 1716 | Corynebacterium | genus | 11.858 |
| 713 | Actinobacillus | genus | 11.836 |
| 2027293 | Escherichia coli O8:H8 | serotype | 11.82 |
| 1613 | Limosilactobacillus fermentum | species | 11.785 |
| 1035817 | Bifidobacterium longum subsp. longum KACC 91563 | strain | 11.762 |
| 85025 | Nocardiaceae | family | 11.735 |
| 2650158 | Bacteroides luhongzhouii | species | 11.726 |
| 1308 | Streptococcus thermophilus | species | 11.694 |
| 2772085 | crAssphage cr6_1 | RUCEZ877 | 11.691 |
| 419005 | Prevotella amnii | species | 11.667 |
| 2742598 | Limosilactobacillus | genus | 11.652 |
| 1177574 | Prevotella jejuni | species | 11.643 |
| 388919 | Streptococcus sanguinis SK36 | strain | 11.551 |
| 41297 | Sphingomonadaceae | family | 11.516 |
| 53345 | Enterococcus durans | species | 11.511 |
| 1077464 | Streptococcus oralis subsp. tigurinus | subspecies | 11.495 |
| 850 | Fusobacterium mortiferum | species | 11.478 |
| 469616 | Fusobacterium mortiferum ATCC 9817 | strain | 11.478 |
| 626940 | Phascolarctobacterium succinatutens | species | 11.459 |
| 657308 | Gordonibacter pamelaeae 7-10-1-b | strain | 11.445 |
| 471189 | Gordonibacter pamelaeae | species | 11.445 |
| 84566 | Sphingobacteriaceae | family | 11.41 |
| 200666 | Sphingobacteriales | order | 11.41 |
| 117747 | Sphingobacteriia | class | 11.41 |
| 416916 | Aggregatibacter | genus | 11.408 |
| 428126 | Thomasclavelia spiroformis DSM 1552 | strain | 11.407 |
| 29348 | Thomasclavelia spiroformis | species | 11.407 |
| 3047432 | Maliibacteriaceae | family | 11.388 |
| 3047433 | Maliibacterium | genus | 11.388 |
| 2086585 | Maliibacterium massiliense | species | 11.388 |
| 99822 | Streptococcus dysgalactiae subsp. dysgalactiae | subspecies | 11.363 |
| 47678 | Bacteroides caccae | species | 11.339 |
| 2767893 | Lentilactobacillus | genus | 11.314 |
| 1396 | Bacillus cereus | species | 11.311 |
| 1155388 | Clostridium sp. C1 | species | 11.281 |
| 12916 | Acidovorax | genus | 11.279 |
| 2847299 | Bacteroides sp. DH3716P | species | 11.274 |
| 1364 | Lactococcus piscium | species | 11.272 |
| 28135 | Segatella oris | species | 11.258 |
| 1292 | Staphylococcus warneri | species | 11.248 |
| 1827 | Rhodococcus | genus | 11.244 |
| 2767885 | Latilactobacillus | genus | 11.24 |
| 186818 | Planococcaceae | family | 11.231 |
| 630 | Yersinia enterocolitica | species | 11.224 |
| 1624 | Ligilactobacillus salivarius | species | 11.219 |
| 48736 | Ralstonia | genus | 11.206 |
| 2692113 | Gleimia | genus | 11.191 |
| 883062 | Bifidobacterium bifidum S17 | strain | 11.176 |
| 186532 | Ceduovirus | genus | 11.163 |
| 28453 | Sphingobacterium | genus | 11.159 |
| 222 | Achromobacter | genus | 11.156 |
| 927666 | Streptococcus oralis Uo5 | strain | 11.111 |
| 1433288 | Streptococcus thermophilus MTH17CL396 | strain | 11.106 |
| 32257 | Kingella | genus | 11.101 |
| 1074494 | Streptococcus salivarius M18 | strain | 11.053 |
| 876 | Desulfovibrio desulfuricans | species | 11.052 |
| 1363 | Lactococcus garvieae | species | 11.044 |
| 85007 | Mycobacteriales | order | 11.021 |
| 830 | Butyrivibrio | genus | 11.009 |
| 118882 | Brucellaceae | family | 11.004 |
| 66228 | Gleimia europaea | species | 11.003 |
| 45851 | Butyrivibrio crossotus | species | 10.992 |
| 1501662 | Streptococcus parasuis | species | 10.988 |
| 570 | Klebsiella | genus | 10.959 |
| 2801844 | Arachnia | genus | 10.94 |
| 990721 | Christensenella | genus | 10.924 |
| 990719 | Christensenellaceae | family | 10.924 |
| 626937 | Christensenella minuta | species | 10.924 |
| 544580 | Actinomyces oris | species | 10.885 |
| 1156431 | Streptococcus ilei | species | 10.879 |
| 712362 | Leptotrichia sp. oral taxon 221 | species | 10.863 |
| 1643822 | Eggerthellales | order | 10.854 |
| 1643826 | Eggerthellaceae | family | 10.854 |
| 2763062 | Roseburia rectibacter | species | 10.835 |
| 1161942 | Ruminococcus champanellensis | species | 10.82 |
| 234 | Brucella | genus | 10.812 |
| 1623 | Ligilactobacillus ruminis | species | 10.81 |
| 1259973 | Klebsiella electrica | species | 10.807 |
| 2709390 | Bacteroides sp. ZJ-18 | species | 10.755 |
| 712411 | Olsenella sp. oral taxon 807 | species | 10.754 |
| 190721 | Ralstonia insidiosa | species | 10.752 |
| 1353 | Enterococcus gallinarum | species | 10.719 |
| 82135 | Fannyhessea vaginae | species | 10.717 |
| 2767327 | Fannyhessea | genus | 10.717 |
| 29430 | Acinetobacter haemolyticus | species | 10.716 |
| 413496 | Cronobacter | genus | 10.703 |
| 2047 | Rothia dentocariosa | species | 10.7 |
| 1599 | Latilactobacillus sakei | species | 10.697 |
| 1654 | Actinomyces | genus | 10.683 |
| 697329 | Ruminococcus albus 7 = DSM 20455 | strain | 10.675 |
| 1264 | Ruminococcus albus | species | 10.675 |
| 732 | Aggregatibacter aphrophilus | species | 10.667 |
| 29491 | Aeromonas salmonicida subsp. salmonicida | subspecies | 10.665 |
| 182773 | Clostridium isatidis | species | 10.633 |
| 1348911 | Coprobacter | genus | 10.63 |
| 2092 | Mycoplasmataceae | family | 10.607 |
| 2085 | Mycoplasmatales | order | 10.607 |
| 2005519 | Barnesiellaceae | family | 10.606 |
| 1099853 | Coprobacter fastidiosus | species | 10.603 |
| 407 | Methylobacterium | genus | 10.597 |
| 1379 | Gemella haemolysans | species | 10.597 |
| 33034 | Anaerococcus prevotii | species | 10.573 |
| 525919 | Anaerococcus prevotii DSM 20548 | strain | 10.573 |
| 29465 | Veillonella | genus | 10.559 |
| 2820817 | Aggregatibacter sp. 2125159857 | species | 10.549 |
| 5794 | Apicomplexa | phylum | 10.54 |
| 1301 | Streptococcus | genus | 10.522 |
| 2767886 | Levilactobacillus | genus | 10.5 |
| 1675036 | Megasphaera hexanoica | species | 10.495 |
| 2893057 | Shouchella | genus | 10.479 |
| 54291 | Raoultella ornithinolytica | species | 10.475 |
| 1796652 | Turicimonas muris | species | 10.474 |
| 1918598 | Turicimonas | genus | 10.474 |
| 862970 | Streptococcus anginosus C1051 | strain | 10.473 |
| 1032069 | Campylobacter ureolyticus RIGS 9880 | strain | 10.462 |
| 1300 | Streptococcaceae | family | 10.457 |
| 2848145 | Escherichia coli O170:H18 | no rank | 10.428 |
| 577 | Raoultella terrigena | species | 10.426 |
| 1280412 | Conoidasida | class | 10.425 |
| 75739 | Eucoccidiorida | order | 10.425 |
| 861906 | Escherichia coli O44:H18 | serotype | 10.423 |
| 216592 | Escherichia coli 042 | strain | 10.423 |
| 114527 | Mogibacterium diversum | species | 10.421 |
| 360104 | Campylobacter concisus 13826 | strain | 10.418 |
| 5809 | Sarcocystidae | family | 10.407 |
| 255248 | Leuconostoc garlicum | species | 10.401 |
| 29389 | Streptococcus alactolyticus | species | 10.398 |
| 1580 | Levilactobacillus brevis | species | 10.396 |
| 244366 | Klebsiella variicola | species | 10.395 |
| 5811 | Toxoplasma gondii | species | 10.388 |
| 5810 | Toxoplasma | genus | 10.388 |
| 1633 | Limosilactobacillus vaginalis | species | 10.373 |
| 2942990 | Canhaevirus | genus | 10.354 |
| 2488810 | Ruminiclostridium herbifermentans | species | 10.349 |
| 1506577 | Tyzzerella | genus | 10.34 |
| 36835 | [Clostridium] colinum | species | 10.34 |
| 704125 | Clostridium gelidum | species | 10.339 |
| 502 | Kingella denitrificans | species | 10.328 |
| 1637 | Listeria | genus | 10.318 |
| 28216 | Betaproteobacteria | class | 10.312 |
| 80840 | Burkholderiales | order | 10.305 |
| 2603836 | Escherichia coli O10:H32 | serotype | 10.3 |
| 702459 | Bifidobacterium bifidum PRL2010 | strain | 10.286 |
| 58231 | Treponema medium | species | 10.286 |
| 2866570 | Aggregatibacter sp. Marseille-P9115 | species | 10.278 |
| 1252 | Leuconostoc carnosum | species | 10.273 |
| 1243 | Leuconostoc | genus | 10.267 |
| 28129 | Prevotella denticola | species | 10.241 |
| 2382163 | Streptococcus koreensis | species | 10.22 |
| 2572088 | Candidatus Nanosynbacter featherlites | species | 10.208 |
| 160453 | Enterococcus gilvus | species | 10.204 |
| 635 | Edwardsiella | genus | 10.185 |
| 1759399 | Streptococcus sp. A12 | species | 10.178 |
| 2848144 | Escherichia coli O158:H23 | no rank | 10.177 |
| 133448 | Citrobacter youngae | species | 10.175 |
| 2082587 | Parolsenella | genus | 10.175 |
| 617123 | Lachnoanaerobaculum umeaense | species | 10.152 |
| 119045 | Methylobacteriaceae | family | 10.152 |
| 76517 | Campylobacter hominis | species | 10.142 |
| 684066 | Streptococcus lactarius | species | 10.132 |
| 2778655 | Escherichia coli O167:H26 | serotype | 10.108 |
| 831 | Butyrivibrio fibrisolvens | species | 10.099 |
| 2929492 | Faecalibacterium sp. I3-3-33 | species | 10.095 |
| 702439 | Prevotella nigrescens F0103 | strain | 10.082 |
| 1520 | Clostridium beijerinckii | species | 10.078 |
| 995019 | Sutterellaceae | family | 10.075 |
| 1563222 | Citrobacter pasteurii | species | 10.071 |
| 1433289 | Streptococcus thermophilus M17PTZA496 | strain | 10.059 |
| 1632 | Limosilactobacillus oris | species | 10.049 |
| 47770 | Lactobacillus crispatus | species | 10.036 |
| 2020965 | Bifidobacterium imperatoris | species | 10.034 |
| 569 | Hafnia alvei | species | 10.024 |
| 906 | Megasphaera | genus | 10.023 |
| 33039 | [Ruminococcus] torques | species | 10.02 |
| 657313 | [Ruminococcus] torques L2-14 | strain | 10.02 |
| 1304 | Streptococcus salivarius | species | 10.01 |
| 1667327 | Klebsiella quasipneumoniae subsp. quasipneumoniae | subspecies | 10.001 |
| 869209 | Treponema succinifaciens DSM 2489 | strain | 9.9992 |
| 167 | Treponema succinifaciens | species | 9.9992 |
| 1253 | Pediococcus | genus | 9.9913 |
| 1246 | Leuconostoc lactis | species | 9.9872 |
| 299766 | Enterobacter hormaechei subsp. steigerwaltii | subspecies | 9.984 |
| 1415775 | Clostridium baratii str. Sullivan | strain | 9.9732 |
| 2133944 | Pseudoprevotella muciniphila | species | 9.9676 |
| 2884814 | Pseudoprevotella | genus | 9.9676 |
| 201 | Campylobacter lari | species | 9.9633 |
| 1354 | Enterococcus hirae | species | 9.9626 |
| 100886 | Catenibacterium mitsuokai | species | 9.9443 |
| 507 | Alcaligenes | genus | 9.9429 |
| 45972 | Staphylococcus pasteuri | species | 9.9336 |
| 1280 | Staphylococcus aureus | species | 9.915 |
| 1453988 | Campylobacter lari RM16712 | strain | 9.9141 |
| 35703 | Citrobacter amalonaticus | species | 9.9078 |
| 1340 | Streptococcus porcinus | species | 9.9071 |
| 40544 | Sutterella | genus | 9.8886 |
| 244127 | Anaerotruncus | genus | 9.8579 |
| 169435 | Anaerotruncus colihominis | species | 9.8579 |
| 985008 | Aggregatibacter aphrophilus ATCC 33389 | strain | 9.849 |
| 297352 | Lactococcus piscium MKFS47 | strain | 9.8328 |
| 80864 | Comamonadaceae | family | 9.8266 |
| 2585119 | Alistipes dispar | species | 9.8242 |
| 86331 | Mogibacterium | genus | 9.8192 |
| 713030 | Selenomonas sp. oral taxon 136 | species | 9.812 |
| 483 | Neisseria cinerea | species | 9.7938 |
| 604330 | Parafannyhessea umbonata | species | 9.7778 |
| 2847312 | Parafannyhessea | genus | 9.7778 |
| 2929493 | Faecalibacterium sp. I3-3-89 | species | 9.7764 |
| 585397 | Escherichia coli ED1a | strain | 9.7746 |
| 40545 | Sutterella wadsworthensis | species | 9.774 |
| 1244 | Leuconostoc gelidum | species | 9.763 |
| 29375 | Lacrimispora xylanolytica | species | 9.7548 |
| 2005520 | Dysgonomonadaceae | family | 9.7493 |
| 2767890 | Paucilactobacillus | genus | 9.7489 |
| 1587 | Lactobacillus helveticus | species | 9.7475 |
| 33035 | Blautia producta | species | 9.7472 |
| 2955579 | Canhaevirus hiberniae | species | 9.7076 |
| 2772066 | uncultured phage cr10_1 | no rank | 9.7076 |
| 649776 | Synergistales | order | 9.6987 |
| 649775 | Synergistia | class | 9.6987 |
| 508458 | Synergistota | phylum | 9.6987 |
| 2107999 | Lactobacillus paragasseri | species | 9.6854 |
| 1458253 | Streptococcus oralis subsp. dentisani | subspecies | 9.6652 |
| 470 | Acinetobacter baumannii | species | 9.6416 |
| 644652 | Gordonibacter | genus | 9.6373 |
| 2546350 | Citrobacter arsenatis | species | 9.6244 |
| 28132 | Prevotella melaninogenica | species | 9.6058 |
| 1870884 | Clostridioides | genus | 9.5655 |
| 539813 | Enterobacter mori | species | 9.5614 |
| 1446746 | Escherichia coli O6:H16 | serotype | 9.5527 |
| 1903434 | Atlantibacter | genus | 9.5526 |
| 131111 | Schaalia turicensis | species | 9.5432 |
| 631220 | Desulfovibrio sp. G11 | species | 9.5416 |
| 2027919 | Enterobacter cloacae complex sp. | species | 9.5295 |
| 2772067 | uncultured phage cr11_1 | no rank | 9.5276 |
| 2955741 | Delmidovirus splanchnicus | species | 9.5276 |
| 3022127 | Lancefieldella sp. Marseille-Q7238 | species | 9.5229 |
| 546367 | Hafnia paralvei | species | 9.5145 |
| 2767887 | Ligilactobacillus | genus | 9.5127 |
| 970 | Selenomonas | genus | 9.4953 |
| 1069494 | Trueperella | genus | 9.4832 |
| 155493 | Gallibacterium | genus | 9.4761 |
| 32008 | Burkholderia | genus | 9.476 |
| 1290 | Staphylococcus hominis | species | 9.467 |
| 1685 | Bifidobacterium breve | species | 9.4339 |
| 1326 | Streptococcus acidominimus | species | 9.4198 |
| 1300227 | Bifidobacterium longum subsp. longum GT15 | strain | 9.4145 |
| 2003188 | Parolsenella catena | species | 9.4127 |
| 907 | Megasphaera elsdenii | species | 9.3998 |
| 505341 | Gallibacterium salpingitidis | species | 9.398 |
| 565 | Atlantibacter hermannii | species | 9.3863 |
| 1305849 | Enterococcus faecium Aus0085 | strain | 9.3746 |
| 1232659 | Haemophilus influenzae 2019 | strain | 9.3629 |
| 331111 | Escherichia coli O139:H28 str. E24377A | strain | 9.357 |
| 1603259 | Escherichia coli O139:H28 | serotype | 9.357 |
| 1871021 | Lachnoclostridium phocaeense | species | 9.3261 |
| 1661 | Trueperella pyogenes | species | 9.2778 |
| 2109686 | Butyricicoccus sp. GAM44 | species | 9.2646 |
| 580596 | Butyricicoccus | genus | 9.2646 |
| 67827 | Citrobacter werkmanii | species | 9.2591 |
| 525282 | Finegoldia magna ATCC 53516 | strain | 9.2375 |
| 2598457 | Streptococcus sp. KS 6 | species | 9.2263 |
| 1335613 | Gordonibacter urolithinfaciens | species | 9.2162 |
| 301301 | Roseburia hominis | species | 9.2112 |
| 249188 | Haemophilus pittmaniae | species | 9.2072 |
| 712538 | Selenomonas sp. oral taxon 478 | species | 9.1851 |
| 2841037 | Eubacterium sp. c-25 | species | 9.1726 |
| 547043 | Bifidobacterium pseudocatenulatum DSM 20438 = JCM 1200 = LMG 10505 | strain | 9.161 |
| 2811390 | Sporofaciens | genus | 9.1239 |
| 2681861 | Sporofaciens musculi | species | 9.1239 |
| 32003 | Nitrosomonadales | order | 9.1194 |
| 1310 | Streptococcus sobrinus | species | 9.1181 |
| 1302 | Streptococcus gordonii | species | 9.0986 |
| 71452 | Enterococcus raffinosus | species | 9.0831 |
| 1743 | Propionibacterium | genus | 9.0806 |
| 13687 | Sphingomonas | genus | 9.0761 |
| 1245 | Leuconostoc mesenteroides | species | 9.0668 |
| 2051 | Mobiluncus curtisii | species | 9.0624 |
| 28144 | Salmonella enterica subsp. enterica serovar Derby | no rank | 9.0361 |
| 1655 | Actinomyces naeslundii | species | 9.0272 |
| 83655 | Leclercia adecarboxylata | species | 9.0215 |
| 447792 | Phytobacter | genus | 9.0141 |
| 1375 | Aerococcus | genus | 9.0125 |
| 69218 | Enterobacter cancerogenus | species | 9.0021 |
| 33905 | Bifidobacterium thermophilum | species | 9.0007 |
| 2937909 | Desulfitobacteriaceae | family | 8.9984 |
| 47714 | Lacticaseibacillus paracasei subsp. paracasei | subspecies | 8.9954 |
| 1682 | Bifidobacterium longum subsp. infantis | subspecies | 8.975 |
| 162 | Treponema phagedenis | species | 8.9692 |
| 85011 | Kitasatosporales | order | 8.9615 |
| 2062 | Streptomycetaceae | family | 8.9615 |
| 1338 | Streptococcus intermedius | species | 8.9432 |
| 190146 | Actinotignum urinale | species | 8.9392 |
| 2490633 | Streptococcus periodonticum | species | 8.9175 |
| 1311 | Streptococcus agalactiae | species | 8.9139 |
| 28119 | Bacteroides zoogleoformans | species | 8.8714 |
| 1470347 | Alistipes ihumii | species | 8.8466 |
| 1211813 | Alistipes ihumii AP11 | strain | 8.8466 |
| 866777 | Bifidobacterium breve ACS-071-V-Sch8b | strain | 8.8371 |
| 67824 | Citrobacter farmeri | species | 8.8369 |
| 1642646 | Petrimonas mucosa | species | 8.8241 |
| 307628 | Petrimonas | genus | 8.8241 |
| 47670 | Lautropia | genus | 8.823 |
| 47671 | Lautropia mirabilis | species | 8.823 |
| 2041044 | Eubacterium maltosivorans | species | 8.8028 |
| 2913614 | Prevotella communis | species | 8.8008 |
| 1589 | Lactiplantibacillus pentosus | species | 8.7922 |
| 248315 | Veillonella rodentium | species | 8.7846 |
| 33033 | Parvimonas micra | species | 8.7761 |
| 543311 | Parvimonas | genus | 8.7761 |
| 115778 | Leuconostoc gasicomitatum | species | 8.7657 |
| 488 | Neisseria mucosa | species | 8.7539 |
| 1883 | Streptomyces | genus | 8.7351 |
| 2919589 | Vaginimicrobium | genus | 8.7251 |
| 1871034 | Vaginimicrobium propionicum | species | 8.7251 |
| 1561 | Clostridium baratii | species | 8.7189 |
| 1583 | Weissella confusa | species | 8.7086 |
| 2479767 | Blautia sp. SC05B48 | species | 8.6993 |
| 87541 | Aerococcus christensenii | species | 8.6984 |
| 328813 | Alistipes onderdonkii | species | 8.6973 |
| 1547448 | Arachnia rubra | species | 8.6843 |
| 2663009 | Fusobacterium pseudoperiodonticum | species | 8.6832 |
| 38304 | Corynebacterium tuberculostearicum | species | 8.6822 |
| 1852381 | Duodenibacillus massiliensis | species | 8.671 |
| 1980697 | Duodenibacillus | genus | 8.671 |
| 2787628 | Treponema peruense | species | 8.6617 |
| 1296540 | Paucilactobacillus nenjiangensis | species | 8.6465 |
| 890402 | Bifidobacterium longum subsp. longum BBMN68 | strain | 8.6424 |
| 181487 | Schaalia cardiffensis | species | 8.6333 |
| 888050 | Schaalia cardiffensis F0333 | strain | 8.6333 |
| 1970189 | Marinilabiliales | order | 8.605 |
| 2714353 | Vescimonas fastidiosa | species | 8.585 |
| 1496 | Clostridioides difficile | species | 8.5787 |
| 2742601 | Limosilactobacillus portuensis | species | 8.5672 |
| 1597 | Lacticaseibacillus paracasei | species | 8.5651 |
| 1330547 | Kosakonia | genus | 8.5484 |
| 363265 | Leyella stercorea | species | 8.543 |
| 1122981 | Prevotella corporis DSM 18810 = JCM 8529 | strain | 8.5289 |
| 214856 | Alistipes finegoldii | species | 8.5266 |
| 1255 | Pediococcus pentosaceus | species | 8.5236 |
| 470146 | Coprococcus comes ATCC 27758 | strain | 8.508 |
| 2974265 | Leyella | genus | 8.5057 |
| 868129 | Prevotella bivia DSM 20514 | strain | 8.4966 |
| 186820 | Listeriaceae | family | 8.4905 |
| 90371 | Salmonella enterica subsp. enterica serovar Typhimurium | no rank | 8.4744 |
| 679935 | Alistipes finegoldii DSM 17242 | strain | 8.4679 |
| 2086584 | Massilistercora timonensis | species | 8.4675 |
| 2717089 | Massilistercora | genus | 8.4675 |
| 2773707 | Escherichia coli O19:H7 | no rank | 8.4458 |
| 2763104 | Escherichia coli O150:H6 | serotype | 8.4447 |
| 2803850 | Mammaliicoccus | genus | 8.4413 |
| 873513 | Segatella buccae ATCC 33574 | strain | 8.4355 |
| 186826 | Lactobacillales | order | 8.4177 |
| 490 | Neisseria sicca | species | 8.4171 |
| 1048332 | Streptococcus salivarius CCHSS3 | strain | 8.4076 |
| 1288121 | Alistipes senegalensis | species | 8.3998 |
| 196081 | Scardovia | genus | 8.3914 |
| 78259 | Scardovia inopinata | species | 8.3914 |
| 1150468 | Scardovia inopinata JCM 12537 | strain | 8.3914 |
| 1796616 | Blautia pseudococcoides | species | 8.3643 |
| 730 | [Haemophilus] ducreyi | species | 8.3473 |
| 706438 | Actinomyces sp. oral taxon 171 | species | 8.3329 |
| 706439 | Actinomyces sp. oral taxon 171 str. F0337 | strain | 8.3329 |
| 69965 | Macrococcus | genus | 8.309 |
| 85020 | Dermabacteraceae | family | 8.2955 |
| 91061 | Bacilli | class | 8.2911 |
| 37637 | Corynebacterium pseudodiphtheriticum | species | 8.2794 |
| 147802 | Lactobacillus iners | species | 8.2667 |
| 632 | Yersinia pestis | species | 8.2177 |
| 2714355 | Vescimonas coprocola | species | 8.2067 |
| 2494234 | Sutterella megalosphaeroides | species | 8.1807 |
| 113107 | Streptococcus australis | species | 8.1803 |
| 411903 | Collinsella aerofaciens ATCC 25986 | strain | 8.1347 |
| 722911 | Bifidobacterium longum subsp. longum F8 | strain | 8.1118 |
| 57493 | Kocuria | genus | 8.1073 |
| 1436725 | Streptococcus thermophilus TH1477 | strain | 8.101 |
| 1926677 | Raoultibacter | genus | 8.1003 |
| 1907662 | Raoultibacter timonensis | species | 8.1003 |
| 379 | Rhizobium | genus | 8.095 |
| 203275 | Tannerella forsythia 92A2 | strain | 8.0864 |
| 28134 | Hoylesella oralis | species | 8.0598 |
| 1643686 | Brachyspirales | order | 8.0537 |
| 29521 | Brachyspira | genus | 8.0537 |
| 143786 | Brachyspiraceae | family | 8.0537 |
| 1336 | Streptococcus equi | species | 8.0488 |
| 1843490 | Sporomusaceae | family | 8.0442 |
| 997873 | Bacteroides caccae CL03T12C61 | strain | 8.0427 |
| 693979 | Bacteroides helcogenes P 36-108 | strain | 8.0376 |
| 290053 | Bacteroides helcogenes | species | 8.0376 |
| 1155385 | Proteiniclasticum | genus | 8.0255 |
| 3036945 | Proteiniclasticum sp. QWL-01 | species | 8.0255 |
| 33040 | Streptococcus milleri | species | 8.0219 |
| 2815775 | Berryella | genus | 7.9936 |
| 823 | Parabacteroides distasonis | species | 7.9932 |
| 2478954 | Catenibacterium sp. co_0103 | species | 7.9864 |
| 157687 | Leptotrichia wadei | species | 7.9769 |
| 119060 | Burkholderiaceae | family | 7.973 |
| 29391 | Gemella morbillorum | species | 7.9635 |
| 2060094 | Aminipila | genus | 7.9504 |
| 34105 | Streptobacillus moniliformis | species | 7.9161 |
| 34104 | Streptobacillus | genus | 7.9161 |
| 1046624 | Lactococcus lactis subsp. lactis IO-1 | strain | 7.8953 |
| 2169621 | Limdunavirus | genus | 7.8846 |
| 2870563 | Methanobrevibacter sp. TLL-48-HuF1 | species | 7.8845 |
| 861 | Fusobacterium ulcerans | species | 7.88 |
| 1931217 | Bifidobacterium longum subsp. suillum | subspecies | 7.8691 |
| 83231 | Xylanibacter brevis | species | 7.8565 |
| 299767 | Enterobacter ludwigii | species | 7.847 |
| 135858 | Catenibacterium | genus | 7.83 |
| 856 | Fusobacterium varium | species | 7.798 |
| 40041 | Streptococcus equi subsp. zooepidemicus | subspecies | 7.7883 |
| 1623305 | Skunavirus | genus | 7.7779 |
| 74426 | Collinsella aerofaciens | species | 7.7776 |
| 356 | Hyphomicrobiales | order | 7.7774 |
| 1584 | Lactobacillus delbrueckii | species | 7.7761 |
| 102106 | Collinsella | genus | 7.7633 |
| 84107 | Coriobacteriaceae | family | 7.7624 |
| 2666138 | Caproicibacterium lactatifermentans | species | 7.7593 |
| 2815358 | Leclercia pneumoniae | species | 7.7471 |
| 1905344 | Ruthenibacterium | genus | 7.746 |
| 1550024 | Ruthenibacterium lactatiformans | species | 7.746 |
| 33011 | Cutibacterium granulosum | species | 7.744 |
| 94869 | Clostridium gasigenes | species | 7.7341 |
| 1330546 | Pluralibacter | genus | 7.7283 |
| 283 | Comamonas | genus | 7.7169 |
| 2785531 | Bacteroides sp. HF-162 | species | 7.7131 |
| 84999 | Coriobacteriales | order | 7.7122 |
| 941322 | Escherichia coli O25b:H4-ST131 | no rank | 7.7036 |
| 1504576 | Pseudocitrobacter | genus | 7.7031 |
| 2891570 | Pseudocitrobacter corydidari | species | 7.7031 |
| 61592 | Corynebacterium durum | species | 7.7013 |
| 338 | Xanthomonas | genus | 7.6781 |
| 186814 | Thermoanaerobacteraceae | family | 7.6745 |
| 762210 | Bifidobacterium saguini | species | 7.6737 |
| 1360 | Lactococcus lactis subsp. lactis | subspecies | 7.6651 |
| 515620 | [Eubacterium] eligens ATCC 27750 | strain | 7.6619 |
| 1623304 | Moineauvirus | genus | 7.6609 |
| 671267 | Phocaeicola sartorii | species | 7.6568 |
| 1150460 | Bifidobacterium catenulatum subsp. kashiwanohense JCM 15439 = DSM 21854 | strain | 7.6556 |
| 106589 | Cupriavidus | genus | 7.6486 |
| 2696063 | Anaerocolumna sedimenticola | species | 7.646 |
| 881260 | Enterobacter bugandensis | species | 7.6448 |
| 375288 | Parabacteroides | genus | 7.6353 |
| 2005525 | Tannerellaceae | family | 7.6349 |
| 204 | Campylobacter showae | species | 7.6239 |
| 1531429 | Berryella intestinalis | species | 7.6229 |
| 2731643 | Autographiviridae | family | 7.5822 |
| 1681 | Bifidobacterium bifidum | species | 7.5668 |
| 195950 | Tannerella | genus | 7.561 |
| 253239 | Ethanoligenens harbinense | species | 7.5595 |
| 253238 | Ethanoligenens | genus | 7.5595 |
| 186828 | Carnobacteriaceae | family | 7.5478 |
| 445974 | Thomasclavelia ramosa DSM 1402 | strain | 7.5476 |
| 28026 | Bifidobacterium pseudocatenulatum | species | 7.5419 |
| 930406 | Escherichia coli O157:H16 | strain | 7.5377 |
| 2854732 | Escherichia coli O78:H4 | serotype | 7.5209 |
| 2748 | Carnobacterium divergens | species | 7.5192 |
| 79603 | Denitrobacterium | genus | 7.5137 |
| 79604 | Denitrobacterium detoxificans | species | 7.5137 |
| 83654 | Leclercia | genus | 7.5007 |
| 2994078 | Caproicibacterium sp. BJN0003 | species | 7.4953 |
| 57706 | Citrobacter braakii | species | 7.4818 |
| 72293 | Helicobacteraceae | family | 7.4558 |
| 1505652 | Terrisporobacter | genus | 7.449 |
| 2813371 | Terrisporobacter hibernicus | species | 7.449 |
| 209 | Helicobacter | genus | 7.4295 |
| 1408428 | Bilophila wadsworthia ATCC 49260 | strain | 7.4156 |
| 1385940 | Bifidobacterium breve JCM 7019 | strain | 7.4014 |
| 371601 | Bacteroides xylanisolvens | species | 7.3943 |
| 546269 | Filifactor alocis ATCC 35896 | strain | 7.3853 |
| 143361 | Filifactor alocis | species | 7.3853 |
| 44259 | Filifactor | genus | 7.3853 |
| 43768 | Corynebacterium matruchotii | species | 7.3703 |
| 1296 | Mammaliicoccus sciuri | species | 7.3674 |
| 225991 | Comamonas aquatica | species | 7.3652 |
| 2304687 | Petroclostridium | genus | 7.3651 |
| 2068655 | Novisyntrophococcus fermenticellae | species | 7.3633 |
| 2888809 | Novisyntrophococcus | genus | 7.3633 |
| 28131 | Prevotella intermedia | species | 7.3572 |
| 1118202 | Cruoricaptor ignavus | species | 7.3522 |
| 1433995 | Cruoricaptor | genus | 7.3522 |
| 649777 | Synergistaceae | family | 7.352 |
| 1197717 | Cloacibacillus porcorum | species | 7.3467 |
| 508459 | Cloacibacillus | genus | 7.3467 |
| 33968 | Leuconostoc pseudomesenteroides | species | 7.3374 |
| 904 | Acidaminococcus | genus | 7.3273 |
| 5204 | Basidiomycota | phylum | 7.3243 |
| 47715 | Lacticaseibacillus rhamnosus | species | 7.324 |
| 329854 | Bacteroides intestinalis | species | 7.318 |
| 2507160 | Aminipila luticellarii | species | 7.3171 |
| 28111 | Bacteroides eggerthii | species | 7.3138 |
| 2044467 | Escherichia sp. E4742 | species | 7.3061 |
| 2747 | Carnobacterium | genus | 7.3044 |
| 1296536 | Enterobacter hormaechei subsp. xiangfangensis | subspecies | 7.3022 |
| 165695 | Sphingobium | genus | 7.2626 |
| 246787 | Bacteroides cellulosilyticus | species | 7.251 |
| 46124 | Granulicatella adiacens | species | 7.2148 |
| 244320 | Escherichia coli O55:H7 | no rank | 7.2102 |
| 186807 | Peptococcaceae | family | 7.1915 |
| 3016343 | Peptoniphilus equinus | species | 7.1807 |
| 1852374 | Ezakiella massiliensis | species | 7.1398 |
| 33010 | Cutibacterium avidum | species | 7.1351 |
| 871541 | Actinomyces oris K20 | strain | 7.1305 |
| 563008 | Segatella oris C735 | strain | 7.1223 |
| 1269 | Micrococcus | genus | 7.1209 |
| 2942964 | Intestiviridae | family | 7.1129 |
| 28112 | Tannerella forsythia | species | 7.104 |
| 864564 | Parascardovia denticolens DSM 10105 = JCM 12538 | strain | 7.0854 |
| 196082 | Parascardovia | genus | 7.0854 |
| 78258 | Parascardovia denticolens | species | 7.0854 |
| 909929 | Selenomonadales | order | 7.0844 |
| 129337 | Geobacillus | genus | 7.0763 |
| 545 | Citrobacter koseri | species | 7.0745 |
| 1680 | Bifidobacterium adolescentis | species | 7.0698 |
| 1579 | Lactobacillus acidophilus | species | 7.0498 |
| 712116 | Actinomyces sp. oral taxon 169 | species | 7.0411 |
| 1843491 | Selenomonadaceae | family | 7.0396 |
| 501783 | Cloacibacterium | genus | 7.0337 |
| 1298 | Deinococcus | genus | 7.0322 |
| 118964 | Deinococcales | order | 7.0322 |
| 183710 | Deinococcaceae | family | 7.0322 |
| 502558 | Eggerthella sp. YY7918 | species | 7.0314 |
| 1281486 | Lactococcus formosensis | species | 7.0247 |
| 1069534 | Ligilactobacillus ruminis ATCC 27782 | strain | 7.0092 |
| 1659 | Actinomyces israelii | species | 7.0028 |
| 33682 | Euglenozoa | phylum | 6.9992 |
| 2704949 | Trypanosomatida | order | 6.9992 |
| 5654 | Trypanosomatidae | family | 6.9992 |
| 5653 | Kinetoplastea | class | 6.9992 |
| 435591 | Parabacteroides distasonis ATCC 8503 | strain | 6.98 |
| 68933 | Thermales | order | 6.964 |
| 188786 | Thermaceae | family | 6.964 |
| 521095 | Lancefieldella parvula DSM 20469 | strain | 6.9621 |
| 1382 | Lancefieldella parvula | species | 6.9621 |
| 172042 | Rothia aeria | species | 6.9552 |
| 5658 | Leishmania | genus | 6.9546 |
| 1596 | Lactobacillus gasseri | species | 6.9527 |
| 1501 | Clostridium pasteurianum | species | 6.9374 |
| 29385 | Staphylococcus saprophyticus | species | 6.925 |
| 718252 | Faecalibacterium prausnitzii L2-6 | strain | 6.9208 |
| 1064535 | Megasphaera elsdenii DSM 20460 | strain | 6.9198 |
| 2772089 | uncultured phage cr115_1 | no rank | 6.9105 |
| 2955498 | Birpovirus hiberniae | species | 6.9105 |
| 84998 | Coriobacteriia | class | 6.9096 |
| 151276 | Bacteroides coprosuis | species | 6.905 |
| 679937 | Bacteroides coprosuis DSM 18011 | strain | 6.905 |
| 61647 | Pluralibacter gergoviae | species | 6.9039 |
| 633147 | Olsenella uli DSM 7084 | strain | 6.8991 |
| 133926 | Olsenella uli | species | 6.8991 |
| 2778656 | Escherichia coli O20:H12 | no rank | 6.8893 |
| 622 | Shigella dysenteriae | species | 6.8791 |
| 712710 | Tannerella serpentiformis | species | 6.873 |
| 147206 | Collinsella stercoris | species | 6.8677 |
| 28035 | Staphylococcus lugdunensis | species | 6.8665 |
| 2751 | Carnobacterium maltaromaticum | species | 6.865 |
| 97478 | Limosilactobacillus mucosae | species | 6.8606 |
| 2848143 | Escherichia coli O85:H1 | no rank | 6.8604 |
| 2823317 | Phascolarctobacterium sp. Marseille-Q4147 | species | 6.8584 |
| 34037 | Rahnella | genus | 6.8453 |
| 1297793 | Lacrimispora sphenoides JCM 1415 | strain | 6.845 |
| 29370 | Lacrimispora sphenoides | species | 6.845 |
| 2507162 | Caproiciproducens sp. NJN-50 | species | 6.8446 |
| 1738645 | Caproiciproducens | genus | 6.8446 |
| 634176 | Aggregatibacter aphrophilus NJ8700 | strain | 6.8286 |
| 69710 | Treponema vincentii | species | 6.8193 |
| 1380 | Atopobium | genus | 6.8137 |
| 712157 | Atopobium sp. oral taxon 416 | species | 6.8137 |
| 496 | Neisseria macacae | species | 6.7759 |
| 84112 | Eggerthella lenta | species | 6.7669 |
| 2678885 | Faecalibacillus | genus | 6.7549 |
| 1982626 | Faecalibacillus intestinalis | species | 6.7549 |
| 2564099 | Ruminococcus bovis | species | 6.7505 |
| 69966 | Macrococcoides caseolyticum | species | 6.7491 |
| 33038 | Mediterraneibacter gnavus | species | 6.7395 |
| 2759736 | Lacticaseibacillus | genus | 6.7368 |
| 1307 | Streptococcus suis | species | 6.7281 |
| 31977 | Veillonellaceae | family | 6.7226 |
| 1843489 | Veillonellales | order | 6.7226 |
| 102684 | Streptococcus infantarius | species | 6.7157 |
| 46123 | Abiotrophia | genus | 6.7149 |
| 46125 | Abiotrophia defectiva | species | 6.7149 |
| 10239 | Viruses | superkingdom | 6.7143 |
| 2731360 | Heunggongvirae | kingdom | 6.7048 |
| 2731618 | Uroviricota | phylum | 6.7048 |
| 2731619 | Caudoviricetes | class | 6.7048 |
| 84111 | Eggerthella | genus | 6.7039 |
| 1866885 | Mycolicibacterium | genus | 6.7014 |
| 2789425 | Actinomyces sp. HMT 175 | species | 6.6931 |
| 1297 | Deinococcota | phylum | 6.6774 |
| 188787 | Deinococci | class | 6.6774 |
| 187327 | Acidaminococcus intestini | species | 6.6718 |
| 2569097 | Anaerobutyricum | genus | 6.6708 |
| 39488 | Anaerobutyricum hallii | species | 6.6708 |
| 712624 | Streptococcus sp. oral taxon 064 | species | 6.6649 |
| 2767353 | Lancefieldella | genus | 6.6614 |
| 649757 | Anaerostipes hadrus ATCC 29173 = JCM 17467 | strain | 6.6558 |
| 2767881 | Fructilactobacillus | genus | 6.6508 |
| 1978007 | Crassvirales | order | 6.6435 |
| 75984 | Mannheimia | genus | 6.643 |
| 1694 | Bifidobacterium pseudolongum | species | 6.6391 |
| 1161918 | Brachyspira pilosicoli WesB | strain | 6.6058 |
| 2070 | Pseudonocardiaceae | family | 6.6023 |
| 85010 | Pseudonocardiales | order | 6.6023 |
| 586 | Providencia | genus | 6.574 |
| 577309 | Paraprevotella | genus | 6.5725 |
| 28113 | Bacteroides heparinolyticus | species | 6.5688 |
| 2955997 | Jahgtovirus intestinihominis | species | 6.5634 |
| 2772061 | uncultured phage cr107_1 | no rank | 6.5634 |
| 1447716 | Bifidobacterium catenulatum PV20-2 | strain | 6.5632 |
| 28125 | Prevotella bivia | species | 6.5578 |
| 117563 | Granulicatella | genus | 6.5547 |
| 2364787 | Alistipes megaguti | species | 6.5427 |
| 357 | Agrobacterium | genus | 6.5327 |
| 409322 | Treponema pedis | species | 6.5216 |
| 550 | Enterobacter cloacae | species | 6.5156 |
| 69823 | Selenomonas sputigena | species | 6.5146 |
| 479437 | Eggerthella lenta DSM 2243 | strain | 6.5079 |
| 29388 | Staphylococcus capitis | species | 6.4974 |
| 225992 | Comamonas kerstersii | species | 6.4867 |
| 1002367 | Leyella stercorea DSM 18206 | strain | 6.4853 |
| 76123 | Hoylesella enoeca | species | 6.4814 |
| 295405 | Bacteroides fragilis YCH46 | strain | 6.4692 |
| 2995122 | Leptogranulimonas | genus | 6.469 |
| 2894156 | Leptogranulimonas caecicola | species | 6.469 |
| 2608867 | Escherichia ruysiae | species | 6.4602 |
| 282402 | Prevotella multiformis | species | 6.4572 |
| 454154 | Paraprevotella clara | species | 6.4555 |
| 387090 | Phocaeicola coprophilus | species | 6.4459 |
| 1232428 | Megasphaera massiliensis | species | 6.4433 |
| 2948767 | Jahgtovirus | genus | 6.4375 |
| 862967 | Streptococcus intermedius B196 | strain | 6.4322 |
| 679191 | Prevotella amnii CRIS 21A-A | strain | 6.4208 |
| 28141 | Cronobacter sakazakii | species | 6.4014 |
| 77635 | Bifidobacterium subtile | species | 6.3808 |
| 2035811 | Pseudodesulfovibrio | genus | 6.3616 |
| 200795 | Chloroflexota | phylum | 6.3564 |
| 29347 | [Clostridium] scindens | species | 6.3545 |
| 166486 | Roseburia intestinalis | species | 6.3404 |
| 361101 | Streptococcus pseudoporcinus | species | 6.3338 |
| 2707299 | Adlercreutzia hattorii | species | 6.3315 |
| 39948 | Dialister | genus | 6.3261 |
| 536231 | Roseburia intestinalis L1-82 | strain | 6.3257 |
| 2691580 | Prevotella sp. Rep29 | species | 6.3242 |
| 52584 | Brachyspira pilosicoli | species | 6.2966 |
| 2946830 | Birpovirus | genus | 6.276 |
| 186822 | Paenibacillaceae | family | 6.2575 |
| 1216932 | Clostridium bornimense | species | 6.249 |
| 83334 | Escherichia coli O157:H7 | serotype | 6.2455 |
| 44249 | Paenibacillus | genus | 6.2446 |
| 33964 | Leuconostoc citreum | species | 6.2316 |
| 1458465 | Megasphaera elsdenii 14-14 | strain | 6.2267 |
| 384636 | Lacrimispora xylanisolvens | species | 6.2198 |
| 1051631 | Streptococcus phage YMC-2011 | species | 6.2196 |
| 270 | Thermus | genus | 6.1948 |
| 2093856 | Butyricimonas faecalis | species | 6.1941 |
| 2679910 | Intestinibaculum | genus | 6.1884 |
| 2487118 | Intestinibaculum porci | species | 6.1884 |
| 84135 | Gemella sanguinis | species | 6.1868 |
| 85019 | Brevibacteriaceae | family | 6.1839 |
| 1696 | Brevibacterium | genus | 6.1839 |
| 2718 | Cardiobacterium hominis | species | 6.1641 |
| 1231072 | Clostridium tetani 12124569 | strain | 6.1618 |
| 2892396 | Vescimonas | genus | 6.1578 |
| 52773 | Schaalia meyeri | species | 6.1559 |
| 2081702 | Actinomyces sp. oral taxon 897 | species | 6.1547 |
| 818 | Bacteroides thetaiotaomicron | species | 6.1537 |
| 1625 | Fructilactobacillus sanfranciscensis | species | 6.1495 |
| 420247 | Methanobrevibacter smithii ATCC 35061 | strain | 6.1307 |
| 2929491 | Faecalibacterium sp. HTF-F | species | 6.1091 |
| 68295 | Thermoanaerobacterales | order | 6.1008 |
| 291644 | Bacteroides salyersiae | species | 6.0944 |
| 1507512 | Romboutsia hominis | species | 6.0655 |
| 515622 | Butyrivibrio proteoclasticus B316 | strain | 6.0578 |
| 43305 | Butyrivibrio proteoclasticus | species | 6.0578 |
| 69277 | Phyllobacteriaceae | family | 6.0402 |
| 2767879 | Companilactobacillus | genus | 6.0245 |
| 161879 | Corynebacterium kroppenstedtii | species | 6.0242 |
| 1042156 | Clostridium sp. SY8519 | species | 6.0184 |
| 2841528 | Eubacterium sp. MSJ-33 | species | 6.0089 |
| 1506553 | Lachnoclostridium | genus | 6.0082 |
| 1660 | Schaalia odontolytica | species | 6.0077 |
| 216816 | Bifidobacterium longum | species | 6.0001 |
| 1573534 | Faecalitalea | genus | 5.9918 |
| 717960 | Faecalitalea cylindroides T2-87 | strain | 5.9918 |
| 39483 | Faecalitalea cylindroides | species | 5.9918 |
| 59310 | Streptococcus macedonicus | species | 5.9885 |
| 33967 | Leuconostoc mesenteroides subsp. mesenteroides | subspecies | 5.9866 |
| 5042 | Eurotiales | order | 5.977 |
| 147545 | Eurotiomycetes | class | 5.977 |
| 714 | Aggregatibacter actinomycetemcomitans | species | 5.9456 |
| 301297 | Dehalococcoidia | class | 5.9432 |
| 1378 | Gemella | genus | 5.9309 |
| 243164 | Dehalococcoides mccartyi 195 | strain | 5.9267 |
| 61434 | Dehalococcoides | genus | 5.9031 |
| 1202464 | Dehalococcoidaceae | family | 5.9031 |
| 1202465 | Dehalococcoidales | order | 5.9031 |
| 61435 | Dehalococcoides mccartyi | species | 5.881 |
| 31983 | Helcococcus | genus | 5.8788 |
| 40091 | Helcococcus kunzii | species | 5.8788 |
| 3029087 | Aminobacteriaceae | family | 5.855 |
| 651822 | Fretibacterium fastidiosum | species | 5.855 |
| 1434006 | Fretibacterium | genus | 5.855 |
| 2316020 | Mediterraneibacter | genus | 5.8469 |
| 1366 | Lactococcus raffinolactis | species | 5.8243 |
| 762948 | Rothia dentocariosa ATCC 17931 | strain | 5.8122 |
| 470565 | Prevotella histicola | species | 5.8068 |
| 2737 | Vagococcus | genus | 5.8051 |
| 2733199 | Oengusvirus | genus | 5.8011 |
| 2734262 | Oengusvirus oengus | species | 5.8011 |
| 2070188 | Faecalibacterium phage FP_oengus | no rank | 5.8011 |
| 128827 | Erysipelotrichaceae | family | 5.7976 |
| 862966 | Streptococcus intermedius C270 | strain | 5.7869 |
| 119602 | Streptococcus dysgalactiae subsp. equisimilis | subspecies | 5.7807 |
| 84108 | Slackia | genus | 5.7723 |
| 84110 | Slackia heliotrinireducens | species | 5.7723 |
| 469617 | Fusobacterium ulcerans ATCC 49185 | strain | 5.7705 |
| 624 | Shigella sonnei | species | 5.7682 |
| 1501226 | Romboutsia | genus | 5.7627 |
| 1449093 | Lactococcus cremoris subsp. cremoris IBB477 | strain | 5.7419 |
| 158846 | Megamonas | genus | 5.7268 |
| 44742 | Desulfovibrio fairfieldensis | species | 5.7252 |
| 768503 | Cytophagia | class | 5.7247 |
| 768507 | Cytophagales | order | 5.7247 |
| 997879 | Bacteroides fragilis CL03T12C07 | strain | 5.7183 |
| 2489014 | Klebsiella variicola subsp. tropica | subspecies | 5.6997 |
| 187101 | Sneathia vaginalis | species | 5.6958 |
| 168808 | Sneathia | genus | 5.6958 |
| 2724150 | Romboutsia sp. CE17 | species | 5.6846 |
| 197 | Campylobacter jejuni | species | 5.6711 |
| 551 | Erwinia | genus | 5.6707 |
| 437897 | Megamonas funiformis | species | 5.6624 |
| 2806552 | Bulleidia sp. zg-1006 | species | 5.6621 |
| 118747 | Bulleidia | genus | 5.6621 |
| 1744 | Propionibacterium freudenreichii | species | 5.6534 |
| 1601 | Ligilactobacillus agilis | species | 5.6514 |
| 2764325 | [Eubacterium] hominis | species | 5.6479 |
| 89966 | Hymenobacter | genus | 5.6449 |
| 1131492 | Aspergillaceae | family | 5.6363 |
| 1852373 | Murdochiella vaginalis | species | 5.6353 |
| 1161127 | Murdochiella | genus | 5.6353 |
| 186329 | Acholeplasmatales | order | 5.6347 |
| 2146 | Acholeplasmataceae | family | 5.6347 |
| 868 | Cardiobacteriaceae | family | 5.6326 |
| 135615 | Cardiobacteriales | order | 5.6316 |
| 589437 | Prevotella scopos | species | 5.6177 |
| 1236518 | Prevotella scopos JCM 17725 | strain | 5.6177 |
| 77095 | Segatella bryantii | species | 5.5925 |
| 2717 | Cardiobacterium | genus | 5.5818 |
| 1160721 | Ruminococcus bicirculans (ex Wegman et al. 2014) | species | 5.5818 |
| 859 | Fusobacterium necrophorum | species | 5.575 |
| 2025876 | Parabacteroides sp. CT06 | species | 5.5687 |
| 1585 | Lactobacillus delbrueckii subsp. bulgaricus | subspecies | 5.5675 |
| 40214 | Acinetobacter johnsonii | species | 5.5605 |
| 1115758 | Romboutsia ilealis | species | 5.5565 |
| 751585 | Coprococcus sp. ART55/1 | species | 5.5551 |
| 2709410 | Chordicoccus furentiruminis | species | 5.5376 |
| 3031933 | Chordicoccus | genus | 5.5376 |
| 495 | Neisseria elongata | species | 5.5305 |
| 623 | Shigella flexneri | species | 5.5099 |
| 851 | Fusobacterium nucleatum | species | 5.5022 |
| 1853232 | Hymenobacteraceae | family | 5.4842 |
| 433286 | Anaerocolumna cellulosilytica | species | 5.4546 |
| 549 | Pantoea agglomerans | species | 5.4521 |
| 971 | Selenomonas ruminantium | species | 5.4355 |
| 114197 | Selenomonas ruminantium subsp. lactilytica | subspecies | 5.4355 |
| 927704 | Selenomonas ruminantium subsp. lactilytica TAM6421 | strain | 5.4355 |
| 46503 | Parabacteroides merdae | species | 5.4332 |
| 2763670 | Wujia chipingensis | species | 5.4314 |
| 2944152 | Wujia | genus | 5.4314 |
| 2490855 | Lachnoanaerobaculum gingivalis | species | 5.3855 |
| 2528203 | Bacteroides sp. A1C1 | species | 5.3817 |
| 2582419 | Dialister hominis | species | 5.3716 |
| 2662363 | Alistipes sp. dk3624 | species | 5.3691 |
| 1703250 | Citrobacter sp. CRE-46 | species | 5.3544 |
| 302911 | Bifidobacterium animalis subsp. lactis | subspecies | 5.3507 |
| 41294 | Nitrobacteraceae | family | 5.3501 |
| 1871109 | Neisseria sp. RH3002v2g | species | 5.3386 |
| 66219 | Lachnoclostridium phytofermentans | species | 5.3383 |
| 357809 | Lachnoclostridium phytofermentans ISDg | strain | 5.3383 |
| 40215 | Acinetobacter junii | species | 5.3372 |
| 2161821 | Dialister massiliensis | species | 5.3275 |
| 46205 | Pseudobutyrivibrio | genus | 5.3271 |
| 185007 | Pseudobutyrivibrio xylanivorans | species | 5.3271 |
| 1183380 | Campylobacter coli RM5611 | strain | 5.3228 |
| 1249 | Weissella paramesenteroides | species | 5.3221 |
| 484 | Neisseria flavescens | species | 5.3157 |
| 2585118 | Alistipes communis | species | 5.2944 |
| 649756 | Anaerostipes hadrus | species | 5.2889 |
| 1649 | Kurthia | genus | 5.2799 |
| 2732414 | Petitvirales | order | 5.2753 |
| 2732412 | Phixviricota | phylum | 5.2753 |
| 2732091 | Sangervirae | kingdom | 5.2753 |
| 2732413 | Malgrandaviricetes | class | 5.2753 |
| 10841 | Microviridae | family | 5.2753 |
| 841 | Roseburia | genus | 5.2685 |
| 1843210 | Anaerocolumna | genus | 5.2599 |
| 817 | Bacteroides fragilis | species | 5.2242 |
| 294702 | Proteiniphilum | genus | 5.2238 |
| 847 | Oxalobacter formigenes | species | 5.2219 |
| 479831 | Clostridioides difficile QCD-63q42 | strain | 5.1847 |
| 29393 | Dolosigranulum | genus | 5.1813 |
| 29394 | Dolosigranulum pigrum | species | 5.1813 |
| 1513 | Clostridium tetani | species | 5.1794 |
| 79880 | Shouchella clausii | species | 5.1644 |
| 143387 | Fusobacterium necrophorum subsp. funduliforme | subspecies | 5.1549 |
| 872 | Desulfovibrio | genus | 5.1511 |
| 135622 | Alteromonadales | order | 5.1463 |
| 2733190 | Lughvirus | genus | 5.1334 |
| 2734248 | Lughvirus lugh | species | 5.1334 |
| 2070184 | Faecalibacterium phage FP_Lugh | no rank | 5.1334 |
| 207244 | Anaerostipes | genus | 5.1222 |
| 374 | Bradyrhizobium | genus | 5.044 |
| 2942993 | Blohavirus | genus | 5.0409 |
| 901 | Desulfovibrio piger | species | 5.0326 |
| 712361 | Leptotrichia sp. oral taxon 218 | species | 5.0265 |
| 2708053 | Romboutsia sp. 13368 | species | 5.0245 |
| 1263 | Ruminococcus | genus | 5.0125 |
| 2956053 | Kehishuvirus primarius | species | 5.0117 |
| 2301731 | Bacteroides phage crAss001 | no rank | 5.0117 |
| 884684 | Mageeibacillus indolicus | species | 4.9975 |
| 699246 | Mageeibacillus indolicus UPII9-5 | strain | 4.9975 |
| 1637257 | Mageeibacillus | genus | 4.9975 |
| 1647988 | Akkermansiaceae | family | 4.9733 |
| 239934 | Akkermansia | genus | 4.9733 |
| 48461 | Verrucomicrobiales | order | 4.9731 |
| 203494 | Verrucomicrobiia | class | 4.9731 |
| 74201 | Verrucomicrobiota | phylum | 4.973 |
| 2709317 | Bacteroides phage crAss002 | no rank | 4.9597 |
| 2955998 | Jahgtovirus secundus | species | 4.9597 |
| 2913621 | Prevotella sp. E9-3 | species | 4.9552 |
| 941323 | Escherichia coli VR50 | strain | 4.9255 |
| 562 | Escherichia coli | species | 4.923 |
| 568816 | Acidaminococcus intestini RyC-MR95 | strain | 4.9002 |
| 411470 | Mediterraneibacter gnavus ATCC 29149 | strain | 4.8944 |
| 28890 | Euryarchaeota | phylum | 4.8866 |
| 2734096 | Brigitvirus brigit | species | 4.8861 |
| 2070181 | Faecalibacterium phage FP_Brigit | no rank | 4.8861 |
| 2733097 | Brigitvirus | genus | 4.8861 |
| 1653174 | Actinotignum | genus | 4.8813 |
| 239935 | Akkermansia muciniphila | species | 4.8803 |
| 2157 | Archaea | superkingdom | 4.8576 |
| 1583098 | Fusobacterium hwasookii | species | 4.8541 |
| 2789424 | Actinomyces sp. HMT897 | species | 4.8316 |
| 38284 | Corynebacterium accolens | species | 4.8257 |
| 85015 | Nocardioidaceae | family | 4.8191 |
| 1796613 | Bacteroides caecimuris | species | 4.8184 |
| 2576755 | Caproicibacter | genus | 4.8161 |
| 2576756 | Caproicibacter fermentans | species | 4.8161 |
| 630129 | Bifidobacterium catenulatum subsp. kashiwanohense | subspecies | 4.8136 |
| 589436 | Prevotella fusca | species | 4.8083 |
| 1236517 | Prevotella fusca JCM 17724 | strain | 4.8083 |
| 936351 | Bifidobacterium breve S27 | strain | 4.8057 |
| 2845437 | Skunavirus P656 | species | 4.7933 |
| 2662298 | Lactococcus phage P656 | no rank | 4.7933 |
| 2874051 | Escherichia coli O99:H6 | serotype | 4.7887 |
| 208223 | Kosakonia cowanii | species | 4.7698 |
| 204037 | Dickeya | genus | 4.7678 |
| 2792859 | Bacteroides humanifaecis | species | 4.7329 |
| 84030 | Lacrimispora saccharolytica | species | 4.7099 |
| 2719231 | Lacrimispora | genus | 4.6978 |
| 1655645 | Parabacteroides phage YZ-2015b | species | 4.6918 |
| 657314 | Blautia obeum A2-162 | strain | 4.6831 |
| 1117 | Cyanobacteriota | phylum | 4.68 |
| 1051074 | Streptococcus thermophilus JIM 8232 | strain | 4.6739 |
| 2773705 | Escherichia coli O18ac:H14 | no rank | 4.6698 |
| 2751153 | Coprobacter secundus subsp. similis | subspecies | 4.6668 |
| 1501392 | Coprobacter secundus | species | 4.6668 |
| 3031451 | Desulfobulbia | class | 4.6547 |
| 3024411 | Desulfobulbales | order | 4.6547 |
| 33882 | Microbacterium | genus | 4.6498 |
| 459786 | Oscillibacter | genus | 4.5986 |
| 2763056 | Oscillibacter hominis | species | 4.5986 |
| 411486 | Clostridium sp. M62/1 | species | 4.5983 |
| 185008 | Butyrivibrio hungatei | species | 4.5971 |
| 997877 | Phocaeicola dorei CL03T12C01 | strain | 4.5875 |
| 33042 | Coprococcus | genus | 4.5745 |
| 1727145 | Anaerocolumna chitinilytica | species | 4.5703 |
| 3028117 | Cyanophyceae | class | 4.5658 |
| 28116 | Bacteroides ovatus | species | 4.5602 |
| 1122979 | Prevotella amnii DSM 23384 = JCM 14753 | strain | 4.5417 |
| 203682 | Planctomycetota | phylum | 4.5364 |
| 411474 | Coprococcus eutactus ATCC 27759 | strain | 4.5352 |
| 2944198 | Wansuia | genus | 4.5336 |
| 2763667 | Wansuia hejianensis | species | 4.5336 |
| 28137 | Prevotella veroralis | species | 4.53 |
| 267890 | Shewanellaceae | family | 4.5142 |
| 42817 | Corynebacterium argentoratense | species | 4.5132 |
| 1348662 | Corynebacterium argentoratense DSM 44202 | strain | 4.5132 |
| 2173 | Methanobrevibacter smithii | species | 4.5082 |
| 2159 | Methanobacteriaceae | family | 4.5036 |
| 183925 | Methanobacteria | class | 4.5035 |
| 2158 | Methanobacteriales | order | 4.5035 |
| 22 | Shewanella | genus | 4.4975 |
| 75682 | Oxalobacteraceae | family | 4.4902 |
| 2944193 | Simiaoa | genus | 4.4833 |
| 2763672 | Simiaoa sunii | species | 4.4833 |
| 718255 | Roseburia intestinalis XB6B4 | strain | 4.4785 |
| 2837504 | Heyndrickxia | genus | 4.4783 |
| 61648 | Kluyvera intermedia | species | 4.4707 |
| 239759 | Alistipes | genus | 4.4593 |
| 171550 | Rikenellaceae | family | 4.4593 |
| 909932 | Negativicutes | class | 4.4521 |
| 213121 | Desulfobulbaceae | family | 4.4201 |
| 226186 | Bacteroides thetaiotaomicron VPI-5482 | strain | 4.4156 |
| 2172 | Methanobrevibacter | genus | 4.415 |
| 2779519 | Thermophilibacter immobilis | species | 4.3952 |
| 2847307 | Thermophilibacter | genus | 4.3952 |
| 1822464 | Paraburkholderia | genus | 4.3847 |
| 236753 | Fastidiosipila sanguinis | species | 4.3749 |
| 236752 | Fastidiosipila | genus | 4.3749 |
| 1656 | Actinomyces viscosus | species | 4.3346 |
| 846 | Oxalobacter | genus | 4.3282 |
| 46228 | [Ruminococcus] lactaris | species | 4.3105 |
| 471875 | [Ruminococcus] lactaris ATCC 29176 | strain | 4.3105 |
| 2070186 | Faecalibacterium phage FP_Taranis | no rank | 4.3072 |
| 2733134 | Taranisvirus | genus | 4.3072 |
| 2734146 | Taranisvirus taranis | species | 4.3072 |
| 1729679 | Faecalibaculum | genus | 4.274 |
| 1702221 | Faecalibaculum rodentium | species | 4.274 |
| 46506 | Bacteroides stercoris | species | 4.2581 |
| 620 | Shigella | genus | 4.2577 |
| 39486 | Dorea formicigenerans | species | 4.2514 |
| 2583584 | Streptococcus sp. NCTC 11567 | species | 4.248 |
| 2316 | Methanosphaera | genus | 4.2035 |
| 657315 | Roseburia intestinalis M50/1 | strain | 4.2022 |
| 2108523 | Lawsonibacter asaccharolyticus | species | 4.1622 |
| 2172004 | Lawsonibacter | genus | 4.1622 |
| 1385938 | Bifidobacterium breve 12L | strain | 4.1593 |
| 310298 | Phocaeicola coprocola | species | 4.142 |
| 470145 | Phocaeicola coprocola DSM 17136 | strain | 4.142 |
| 328814 | Alistipes shahii | species | 4.1124 |
| 717959 | Alistipes shahii WAL 8301 | strain | 4.1124 |
| 2070182 | Faecalibacterium phage FP_Epona | no rank | 4.1016 |
| 2734105 | Eponavirus epona | species | 4.1016 |
| 2733103 | Eponavirus | genus | 4.1016 |
| 397864 | Barnesiella | genus | 4.0951 |
| 397865 | Barnesiella viscericola | species | 4.0951 |
| 880074 | Barnesiella viscericola DSM 18177 | strain | 4.0951 |
| 2317 | Methanosphaera stadtmanae | species | 4.091 |
| 39496 | Eubacterium ventriosum | species | 4.0826 |
| 2899121 | Tannockella kyphosi | species | 4.0805 |
| 2943184 | Tannockella | genus | 4.0805 |
| 1398 | Heyndrickxia coagulans | species | 4.0793 |
| 2866573 | Cardiobacterium sp. Marseille-Q4385 | species | 4.0783 |
| 196 | Campylobacter fetus | species | 4.07 |
| 997890 | Bacteroides uniformis CL03T12C37 | strain | 4.0546 |
| 116085 | Coprococcus catus | species | 4.032 |
| 2929490 | Faecalibacterium sp. I2-3-92 | species | 4.02 |
| 39485 | Lachnospira eligens | species | 4.0161 |
| 28050 | Lachnospira | genus | 4.0161 |
| 393921 | Porphyromonas crevioricanis | species | 4.0144 |
| 37923 | Rothia kristinae | species | 4.0086 |
| 572511 | Blautia | genus | 3.9996 |
| 155615 | Fusobacterium vincentii | species | 3.979 |
| 32020 | Campylobacter fetus subsp. venerealis | subspecies | 3.9746 |
| 418240 | Blautia wexlerae | species | 3.9542 |
| 1121115 | Blautia wexlerae DSM 19850 | strain | 3.9542 |
| 2948680 | Diorhovirus | genus | 3.9512 |
| 2929494 | Faecalibacterium sp. I4-1-79 | species | 3.918 |
| 138851 | Treponema parvum | species | 3.8965 |
| 2929488 | Faecalibacterium sp. IP-1-18 | species | 3.8962 |
| 657322 | Faecalibacterium prausnitzii SL3/3 | strain | 3.8736 |
| 1164882 | Lachnoanaerobaculum | genus | 3.8719 |
| 88431 | Dorea longicatena | species | 3.8655 |
| 2489010 | Klebsiella africana | species | 3.8568 |
| 1870984 | Anaerococcus mediterraneensis | species | 3.856 |
| 853 | Faecalibacterium prausnitzii | species | 3.8524 |
| 449673 | Bacteroides stercoris ATCC 43183 | strain | 3.8297 |
| 1643513 | Treponema sp. OMZ 857 | species | 3.7909 |
| 2603322 | Vallitaleaceae | family | 3.764 |
| 357276 | Phocaeicola dorei | species | 3.7613 |
| 2946593 | Oxalobacter aliiformigenes | species | 3.7341 |
| 34084 | Riemerella | genus | 3.7314 |
| 2518495 | Duncaniella | genus | 3.7118 |
| 203 | Campylobacter rectus | species | 3.6624 |
| 2029659 | Lactococcus phage 16802 | no rank | 3.6177 |
| 2845153 | Skunavirus sv16802 | species | 3.6177 |
| 28124 | Porphyromonas endodontalis | species | 3.6127 |
| 2755405 | Bacteroides sp. CACC 737 | species | 3.6041 |
| 2772080 | uncultured phage cr53_1 | no rank | 3.6009 |
| 2955510 | Blohavirus americanus | species | 3.6009 |
| 44283 | Pasteurella multocida subsp. multocida | subspecies | 3.5988 |
| 543 | Enterobacteriaceae | family | 3.5941 |
| 1730 | Eubacterium | genus | 3.5859 |
| 186806 | Eubacteriaceae | family | 3.5857 |
| 91347 | Enterobacterales | order | 3.5611 |
| 85004 | Bifidobacteriales | order | 3.5348 |
| 31953 | Bifidobacteriaceae | family | 3.5348 |
| 1678 | Bifidobacterium | genus | 3.5344 |
| 189330 | Dorea | genus | 3.5324 |
| 1760 | Actinomycetes | class | 3.5314 |
| 1236 | Gammaproteobacteria | class | 3.4912 |
| 35832 | Bilophila | genus | 3.4836 |
| 35833 | Bilophila wadsworthia | species | 3.4836 |
| 1224 | Pseudomonadota | phylum | 3.4676 |
| 3024823 | Anaeromicropila | genus | 3.4646 |
| 2785025 | Anaeromicropila herbilytica | species | 3.4646 |
| 2845434 | Skunavirus P4565 | species | 3.4294 |
| 2662297 | Lactococcus phage P4565 | no rank | 3.4294 |
| 228603 | Hoylesella shahii | species | 3.4198 |
| 2981344 | Xiamenia | genus | 3.4192 |
| 2682776 | Xiamenia xianingshaonis | species | 3.4192 |
| 28256 | Halomonadaceae | family | 3.4033 |
| 575614 | Prevotella sp. oral taxon 299 str. F0039 | strain | 3.3998 |
| 652716 | Prevotella sp. oral taxon 299 | species | 3.3998 |
| 574697 | Butyricimonas | genus | 3.3966 |
| 420952 | Paraburkholderia bryophila | species | 3.358 |
| 28264 | Arcanobacterium haemolyticum | species | 3.3414 |
| 544645 | Butyricimonas virosa | species | 3.3361 |
| 2162637 | Bacteroides sp. PHL 2737 | species | 3.3095 |
| 1534 | Clostridium kluyveri | species | 3.3081 |
| 2763068 | Streptococcus sp. NSJ-72 | species | 3.2893 |
| 201174 | Actinomycetota | phylum | 3.2891 |
| 13076 | Globicatella sanguinis | species | 3.2685 |
| 13075 | Globicatella | genus | 3.2685 |
| 186823 | Alicyclobacillaceae | family | 3.2346 |
| 2518971 | Duncaniella dubosii | species | 3.2306 |
| 183963 | Halobacteria | class | 3.2226 |
| 1737424 | Blautia massiliensis (ex Durand et al. 2017) | species | 3.1839 |
| 717605 | Thermobacillus composti KWC4 | strain | 3.1738 |
| 377615 | Thermobacillus composti | species | 3.1738 |
| 76632 | Thermobacillus | genus | 3.1738 |
| 292632 | Subdoligranulum | genus | 3.1698 |
| 214851 | Subdoligranulum variabile | species | 3.1698 |
| 33024 | Phascolarctobacterium | genus | 3.1137 |
| 135619 | Oceanospirillales | order | 3.0941 |
| 165179 | Segatella copri | species | 3.006 |
| 2974251 | Segatella | genus | 3.006 |
| 194924 | Desulfovibrionaceae | family | 3.0022 |
| 213115 | Desulfovibrionales | order | 3.0017 |
| 3031449 | Desulfovibrionia | class | 3.0017 |
| 200940 | Thermodesulfobacteriota | phylum | 2.999 |
| 28263 | Arcanobacterium | genus | 2.9903 |
| 2375 | Sporomusa | genus | 2.9612 |
| 411483 | Faecalibacterium duncaniae | species | 2.96 |
| 171552 | Prevotellaceae | family | 2.9365 |
| 394503 | Ruminiclostridium cellulolyticum H10 | strain | 2.9305 |
| 1521 | Ruminiclostridium cellulolyticum | species | 2.9305 |
| 33926 | Candidatus Phytoplasma | genus | 2.9252 |
| 1843488 | Acidaminococcales | order | 2.9156 |
| 909930 | Acidaminococcaceae | family | 2.9156 |
| 1853229 | Chitinophagales | order | 2.9063 |
| 563835 | Chitinophagaceae | family | 2.9063 |
| 1853228 | Chitinophagia | class | 2.9063 |
| 3031651 | Desulfuromonadia | class | 2.9025 |
| 33025 | Phascolarctobacterium faecium | species | 2.8972 |
| 2377 | Sporomusa termitida | species | 2.8942 |
| 3039116 | Anaerocolumna sp. AGMB13025 | species | 2.8324 |
| 3031668 | Geobacterales | order | 2.8267 |
| 213422 | Geobacteraceae | family | 2.8267 |
| 621 | Shigella boydii | species | 2.8033 |
| 537011 | Segatella copri DSM 18205 | strain | 2.7553 |
| 1538075 | Malasseziomycetes | class | 2.7053 |
| 742845 | Malasseziaceae | family | 2.7053 |
| 55193 | Malassezia | genus | 2.7053 |
| 162474 | Malasseziales | order | 2.7053 |
| 2734634 | Berryella wangjianweii | species | 2.6998 |
| 76775 | Malassezia restricta | species | 2.6771 |
| 2929495 | Faecalibacterium sp. I4-3-84 | species | 2.6632 |
| 109328 | Leptotrichia trevisanii | species | 2.6442 |
| 359110 | Pseudomonas extremaustralis | species | 2.6212 |
| 2929489 | Faecalibacterium sp. IP-3-29 | species | 2.6134 |
| 213118 | Desulfobacterales | order | 2.566 |
| 3024418 | Desulfobacteria | class | 2.566 |
| 28118 | Odoribacter splanchnicus | species | 2.5061 |
| 283168 | Odoribacter | genus | 2.5061 |
| 820 | Bacteroides uniformis | species | 2.4089 |
| 709991 | Odoribacter splanchnicus DSM 20712 | strain | 2.3887 |
| 2913616 | Prevotella sp. E13-17 | species | 2.3359 |
| 28446 | Anaerotignum propionicum | species | 2.3254 |
| 2039240 | Anaerotignum | genus | 2.3254 |
| 991789 | Anaerotignum propionicum DSM 1682 | strain | 2.3254 |
| 1853231 | Odoribacteraceae | family | 2.276 |
| 821 | Phocaeicola vulgatus | species | 2.1936 |
| 2725997 | Escherichia sp. SCLE84 | species | 2.1911 |
| 611 | Salmonella enterica subsp. enterica serovar Heidelberg | no rank | 2.1785 |
| 2818505 | Myxococcota | phylum | 2.0115 |
| 1124936 | Salmonella enterica subsp. enterica serovar Heidelberg str. 41578 | strain | 1.9976 |
| 216851 | Faecalibacterium | genus | 1.9532 |
| 909656 | Phocaeicola | genus | 1.7058 |
| 592316 | Pantoea sp. At-9b | species | 1.6002 |
| 216572 | Oscillospiraceae | family | 1.5468 |
| 186803 | Lachnospiraceae | family | 1.5367 |
| 1239 | Bacillota | phylum | 0.9549 |
| 816 | Bacteroides | genus | 0.9515 |
| 186801 | Clostridia | class | 0.9074 |
| 186802 | Eubacteriales | order | 0.9074 |
| 815 | Bacteroidaceae | family | 0.2148 |
| 171549 | Bacteroidales | order | -0.482 |
| 200643 | Bacteroidia | class | -0.482 |
| 976 | Bacteroidota | phylum | -0.498 |


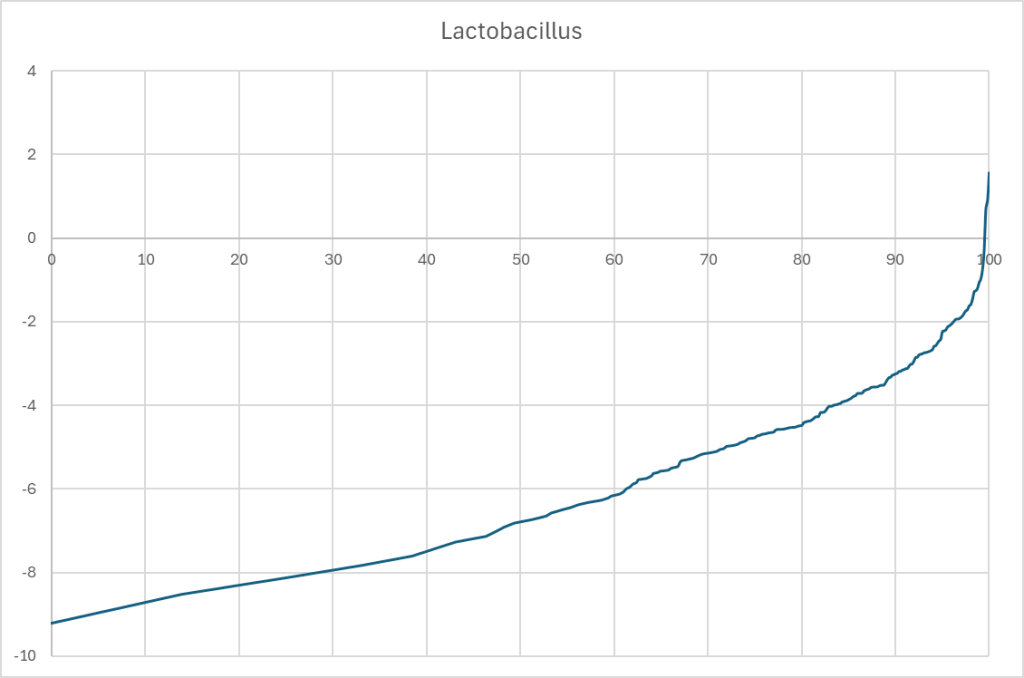

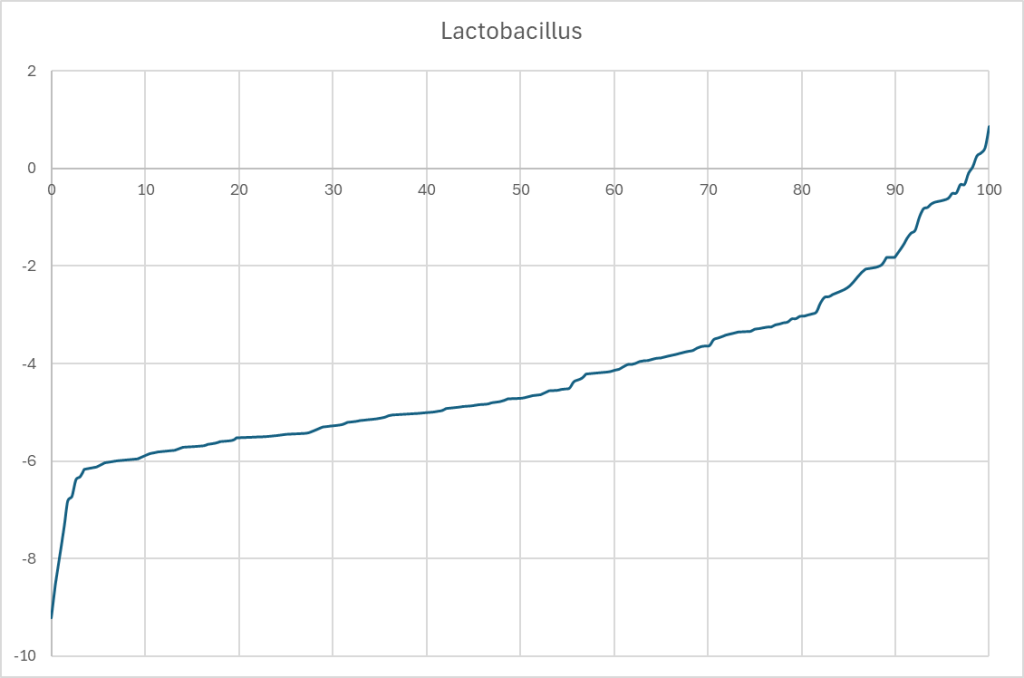
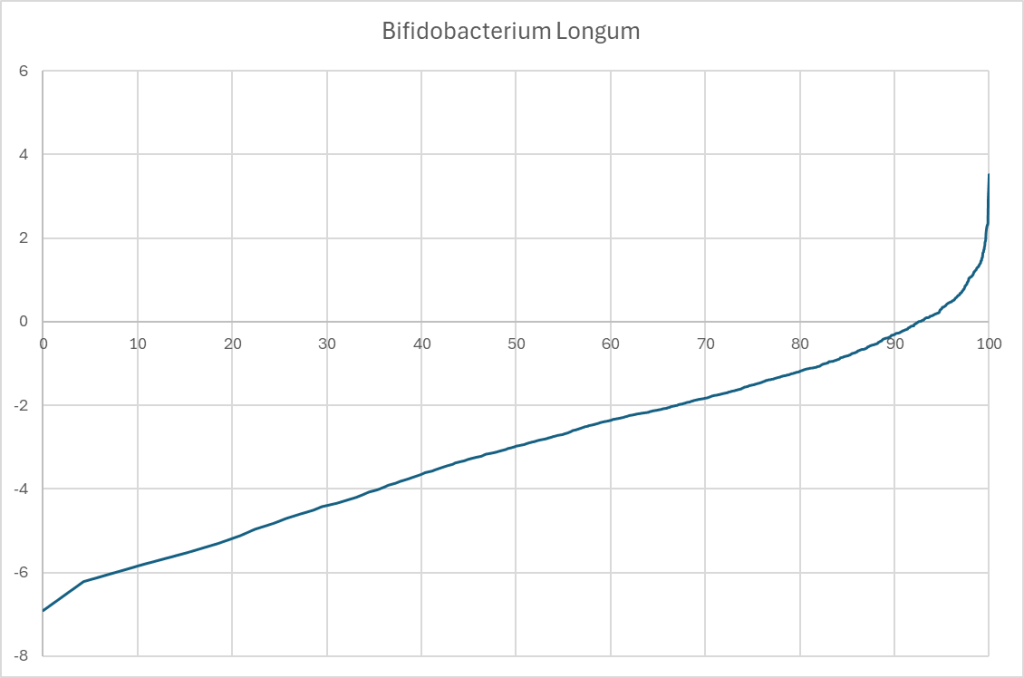
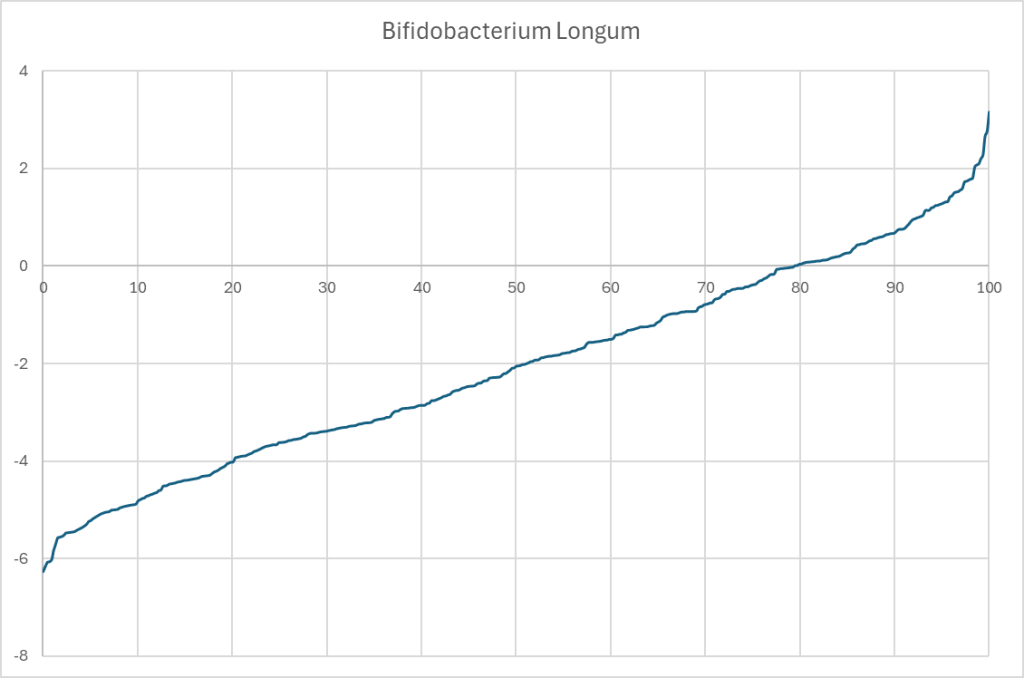
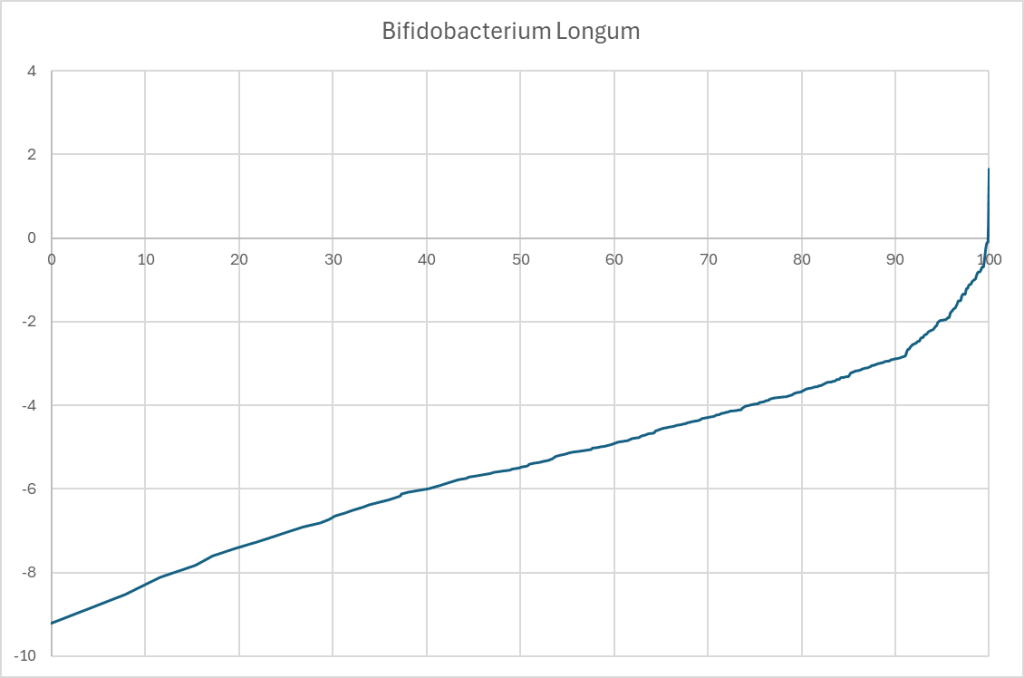


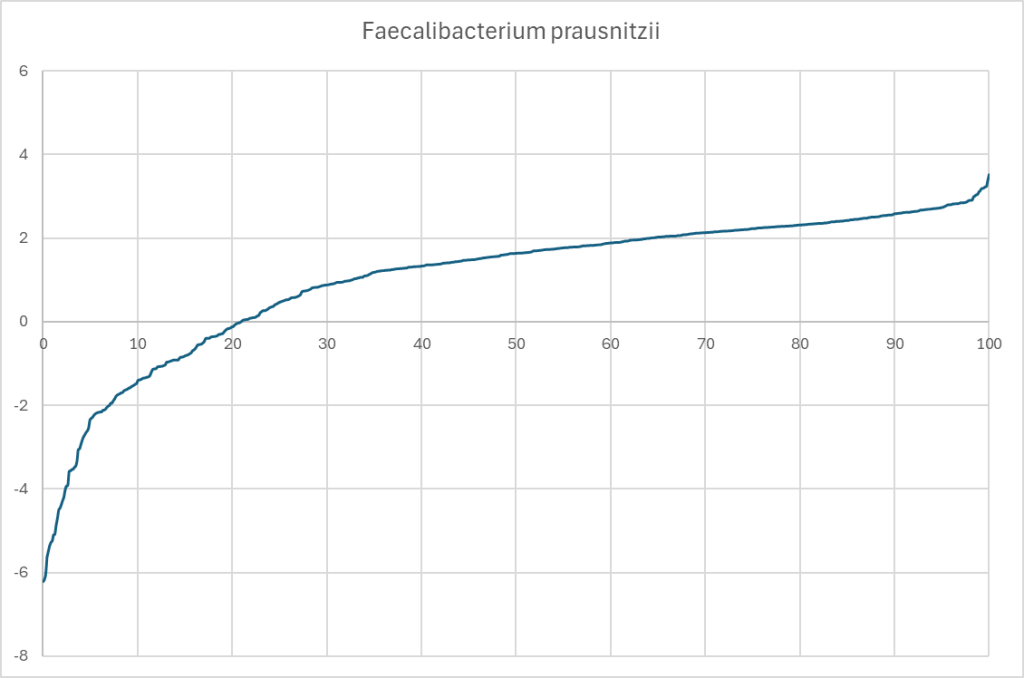
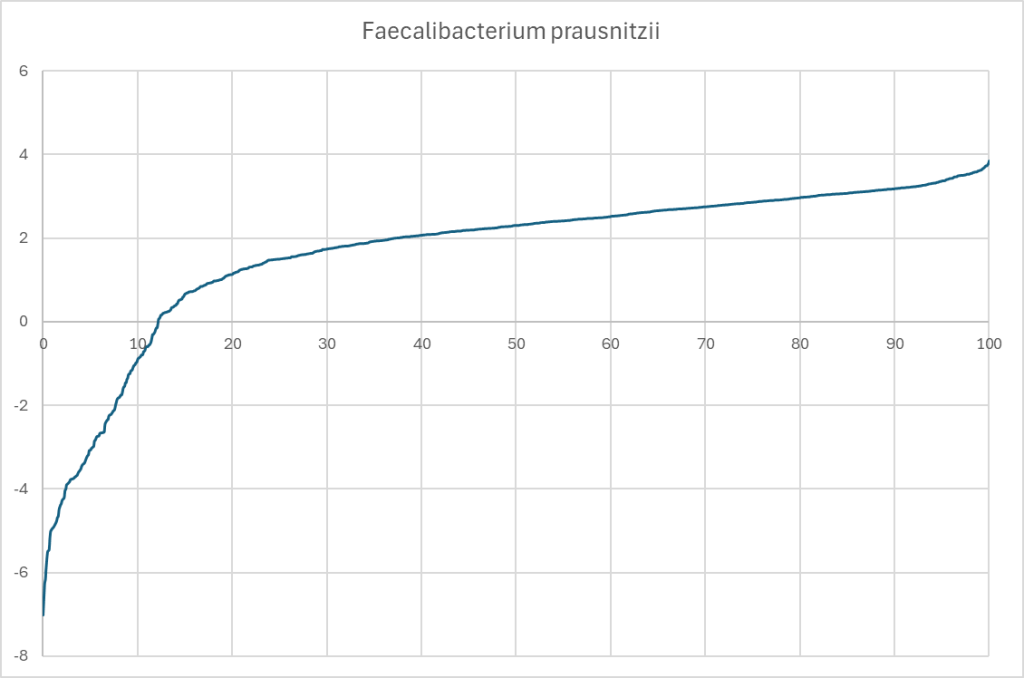
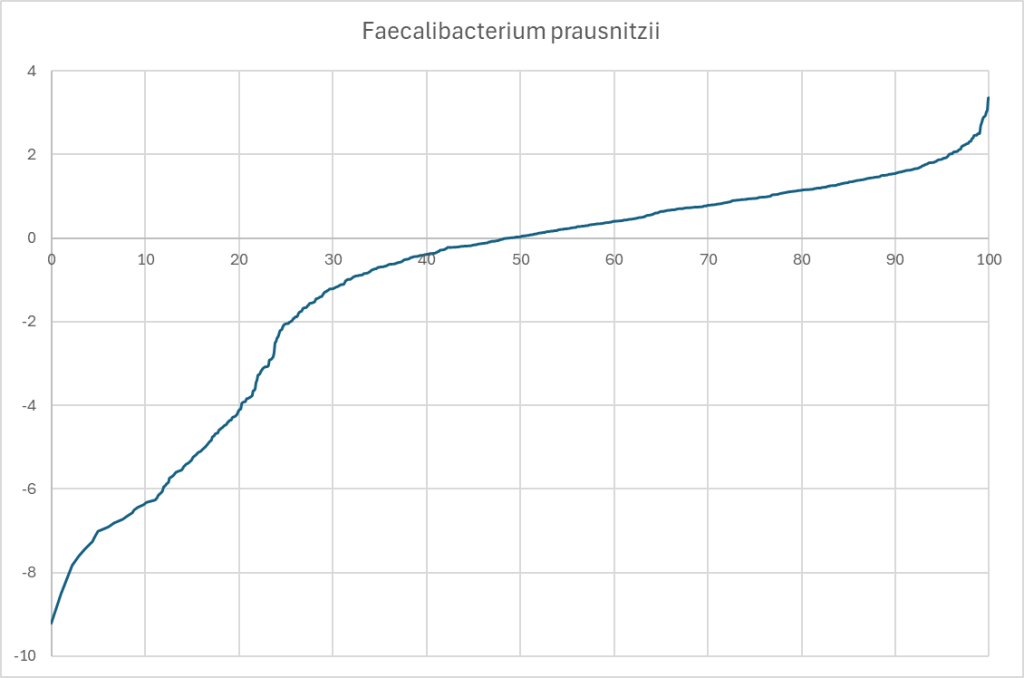
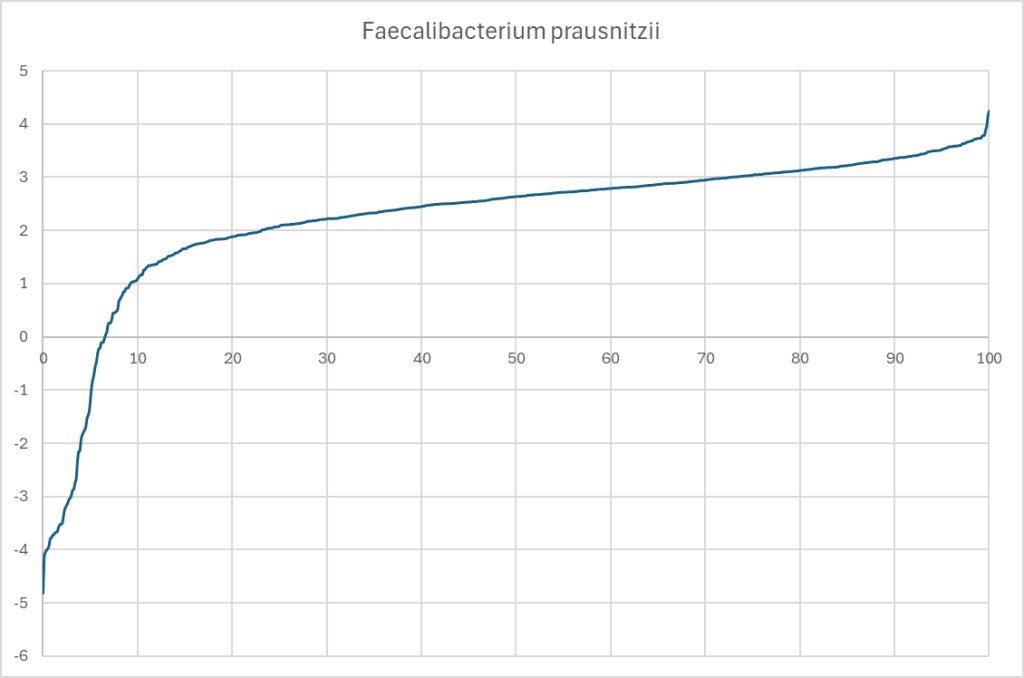

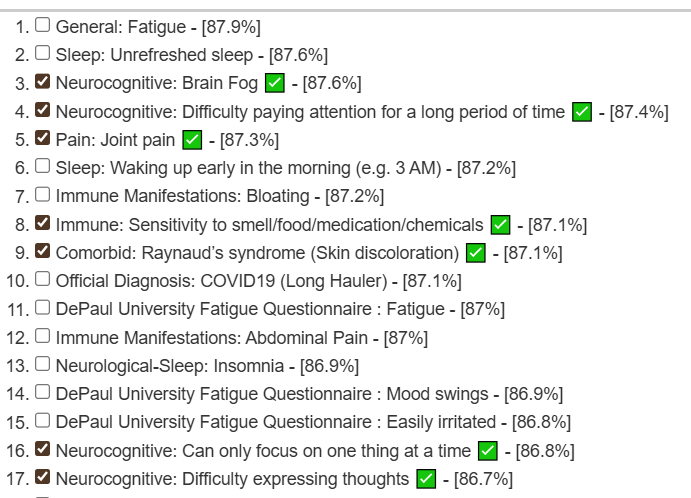
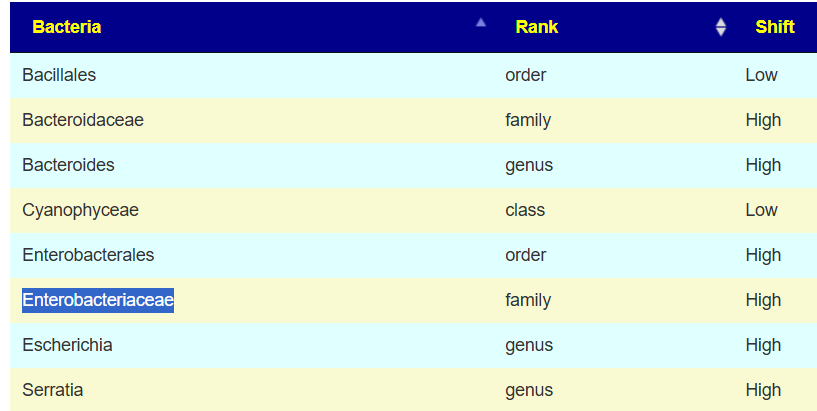
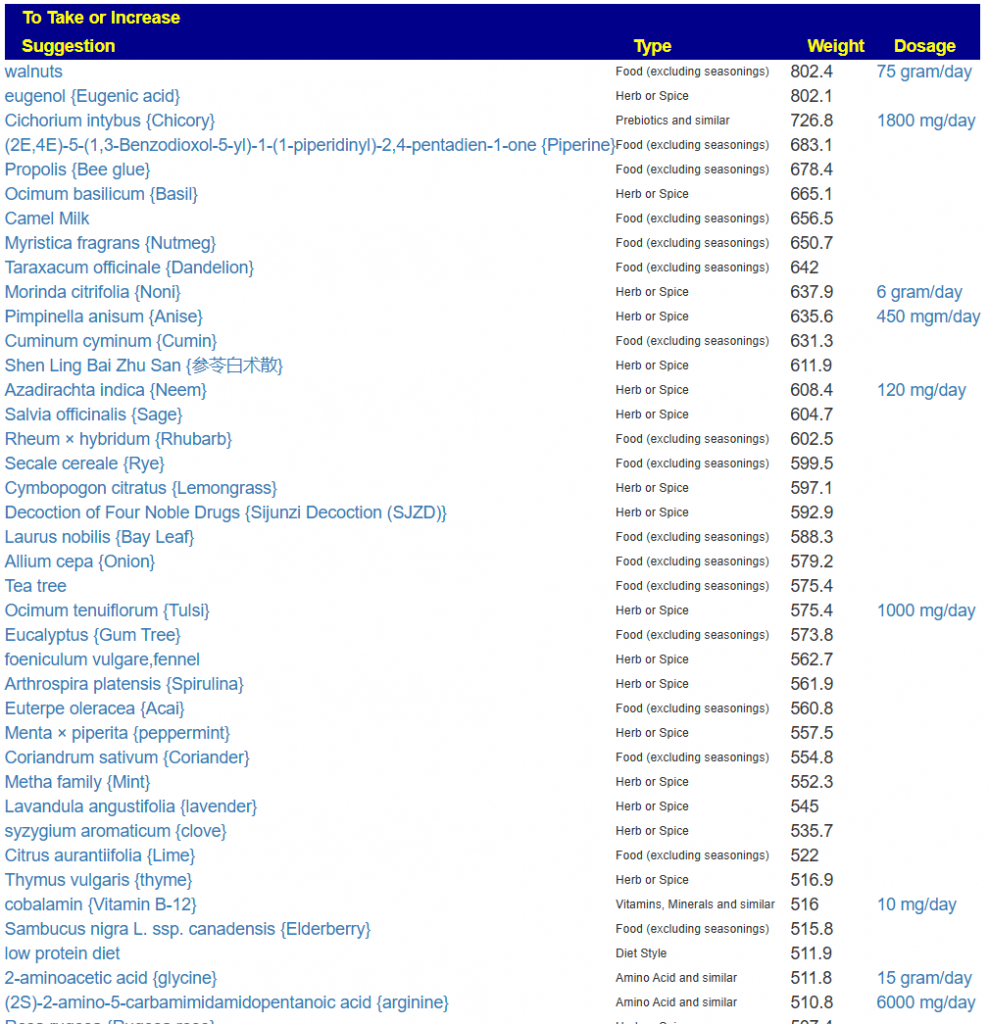

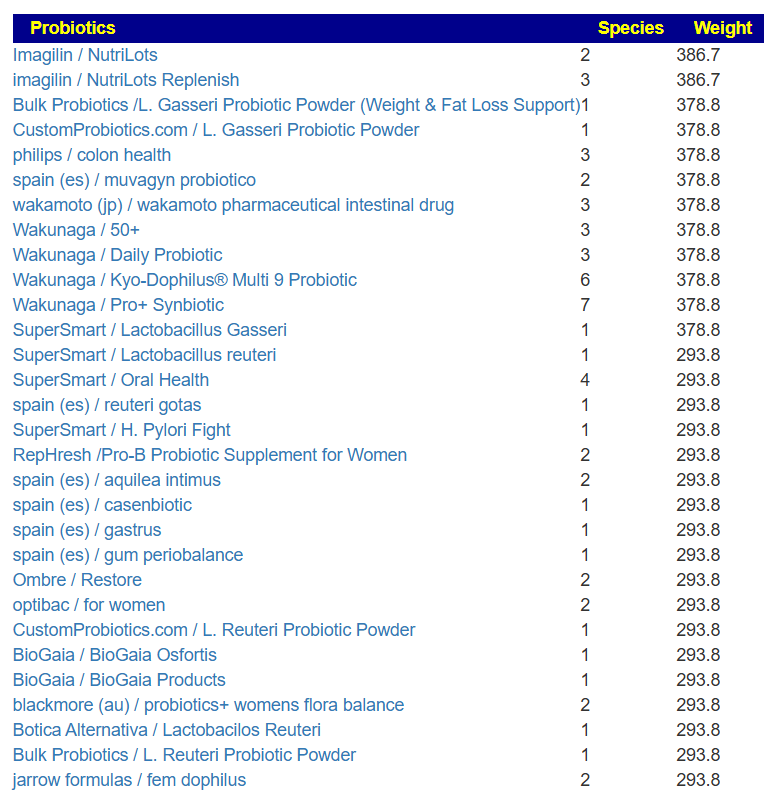
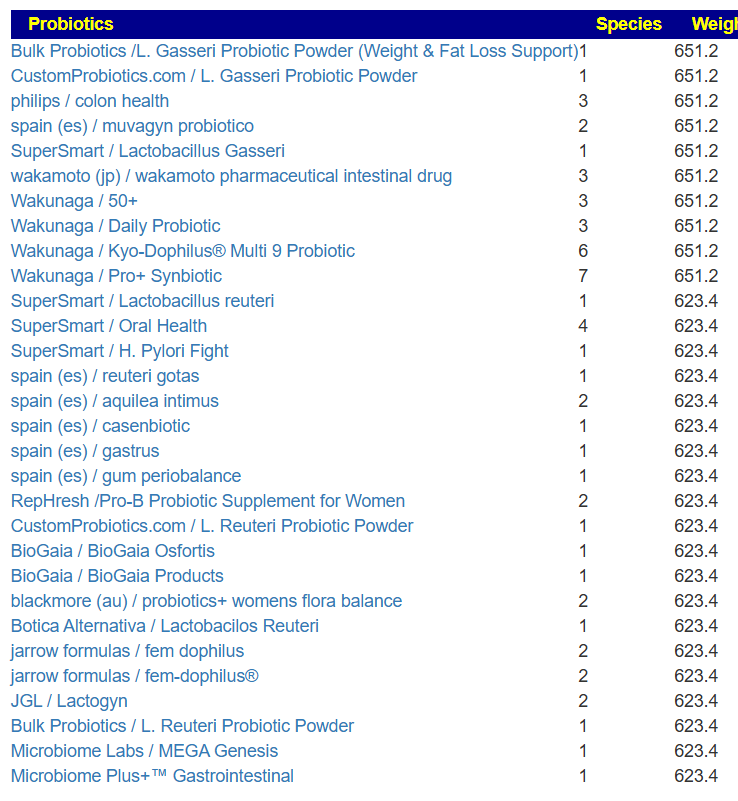
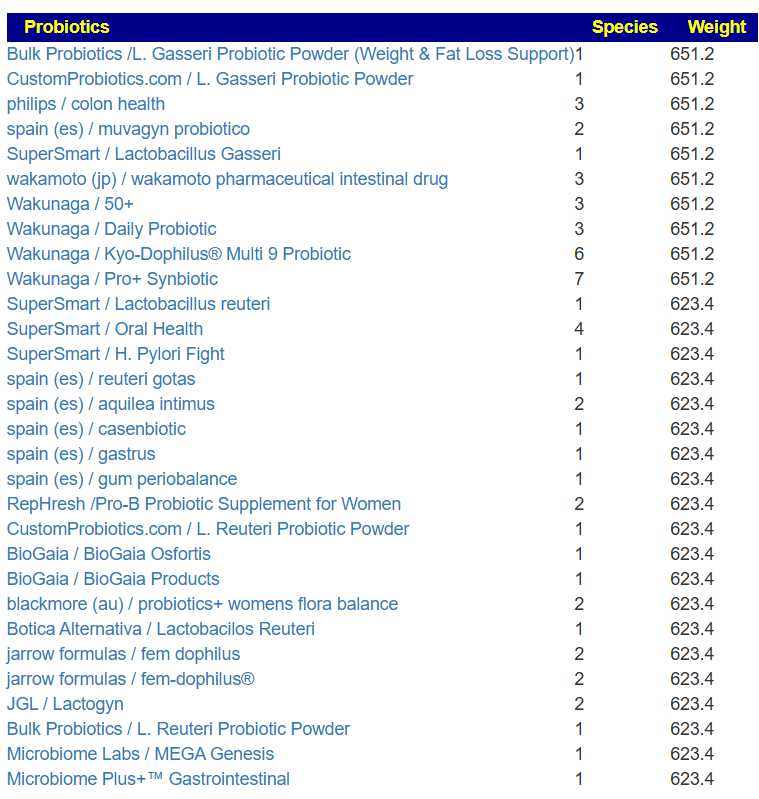
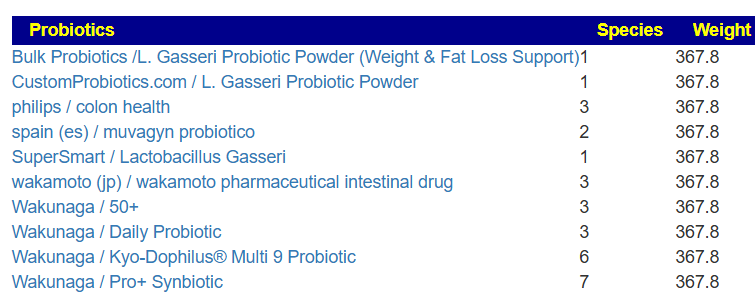
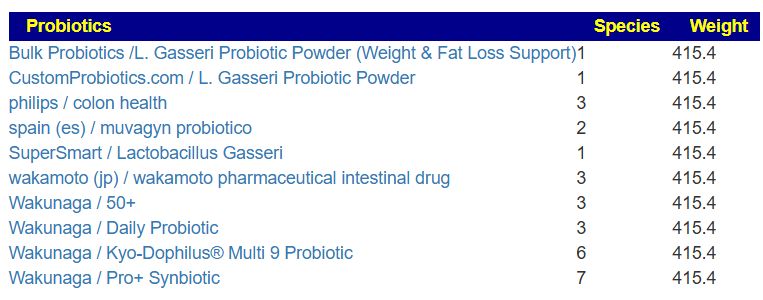
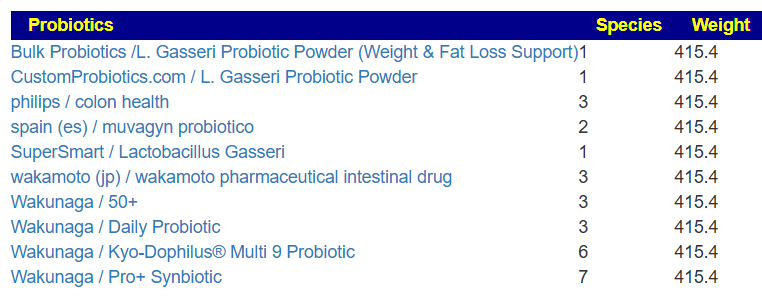
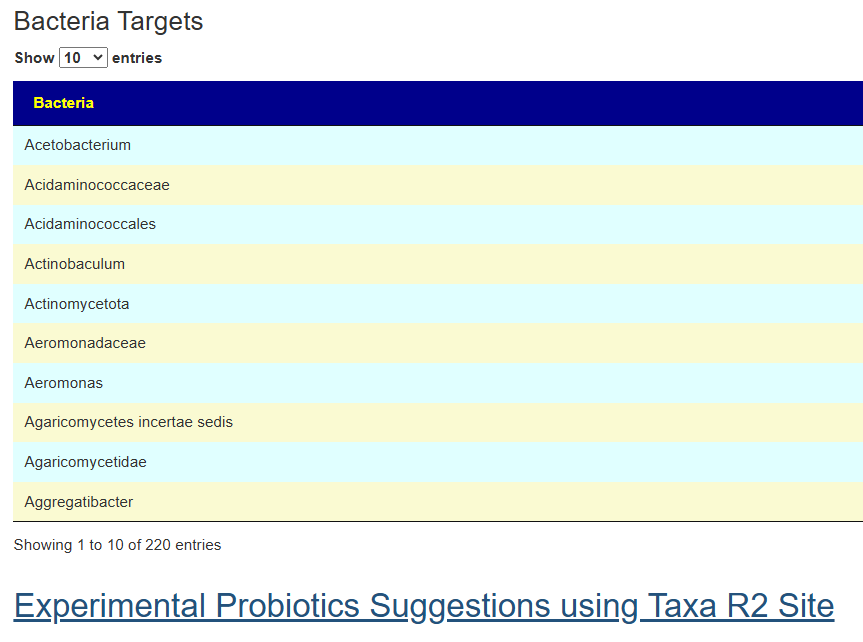

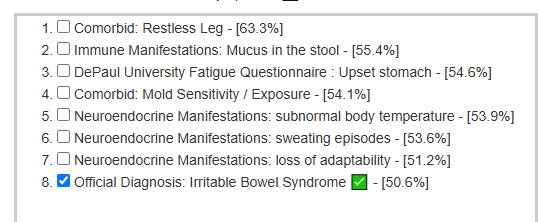
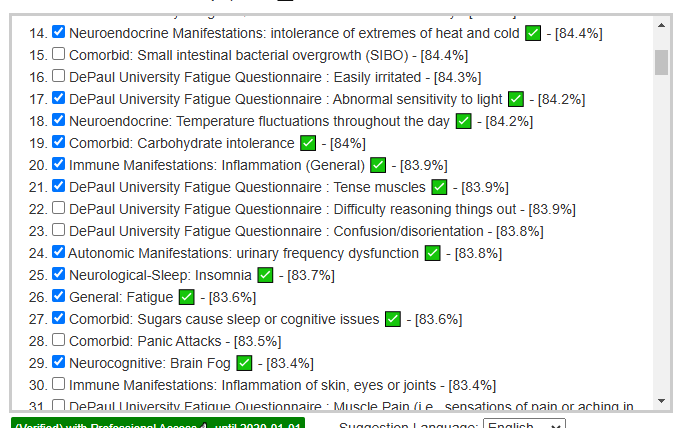
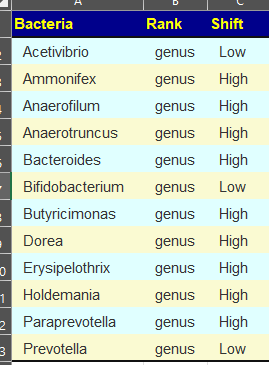
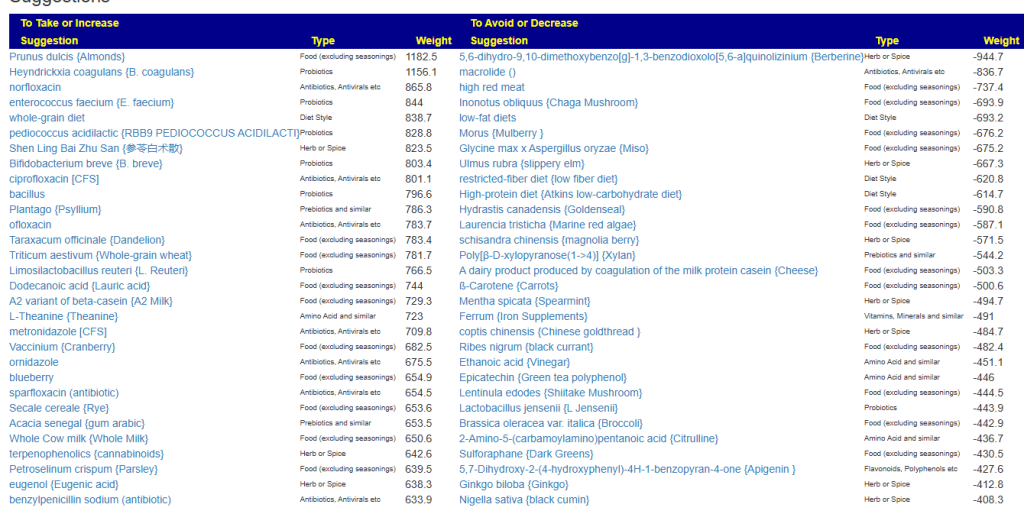
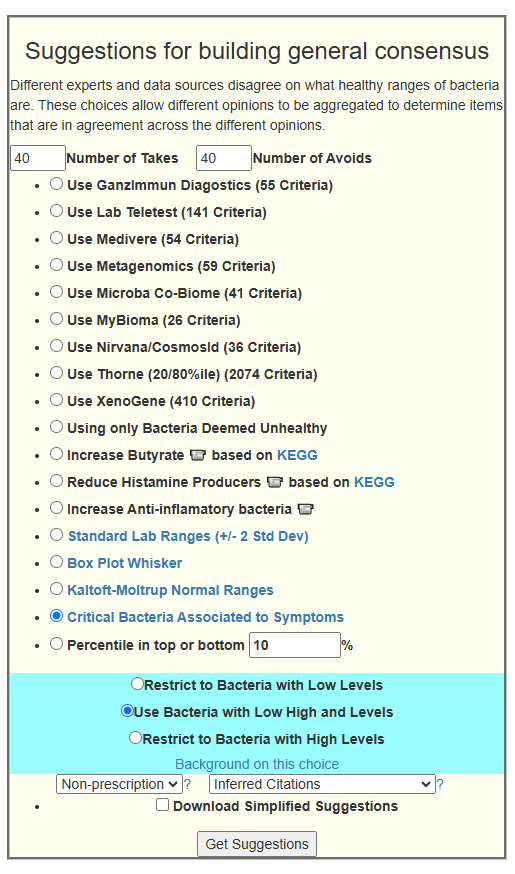
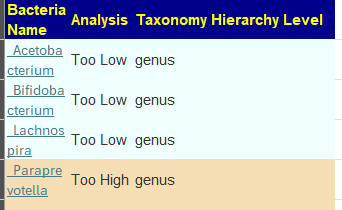
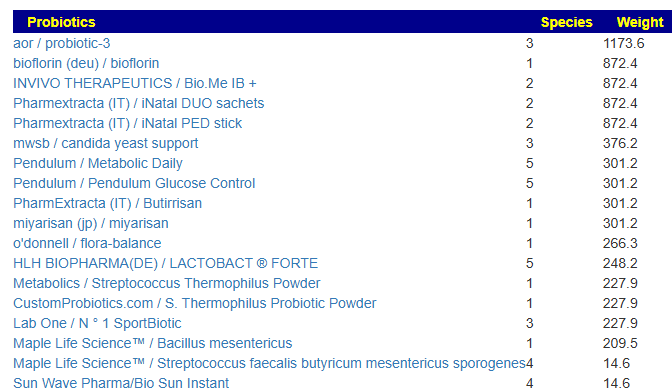
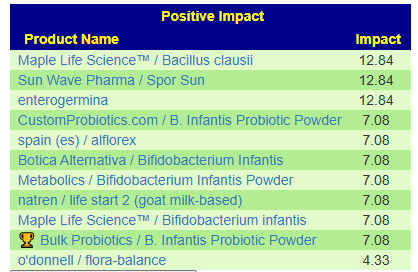
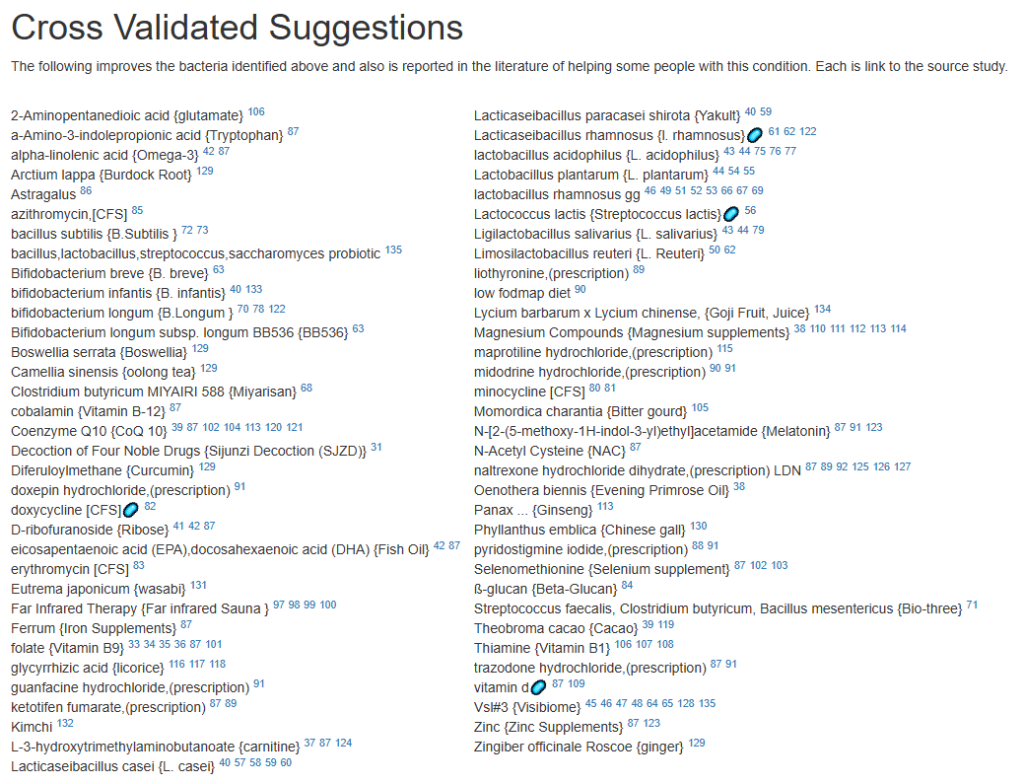

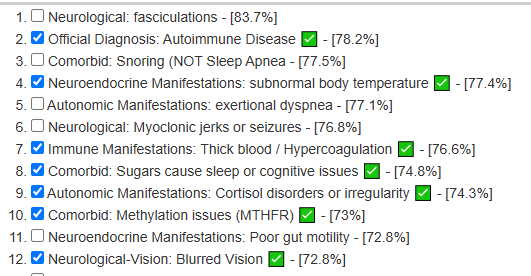
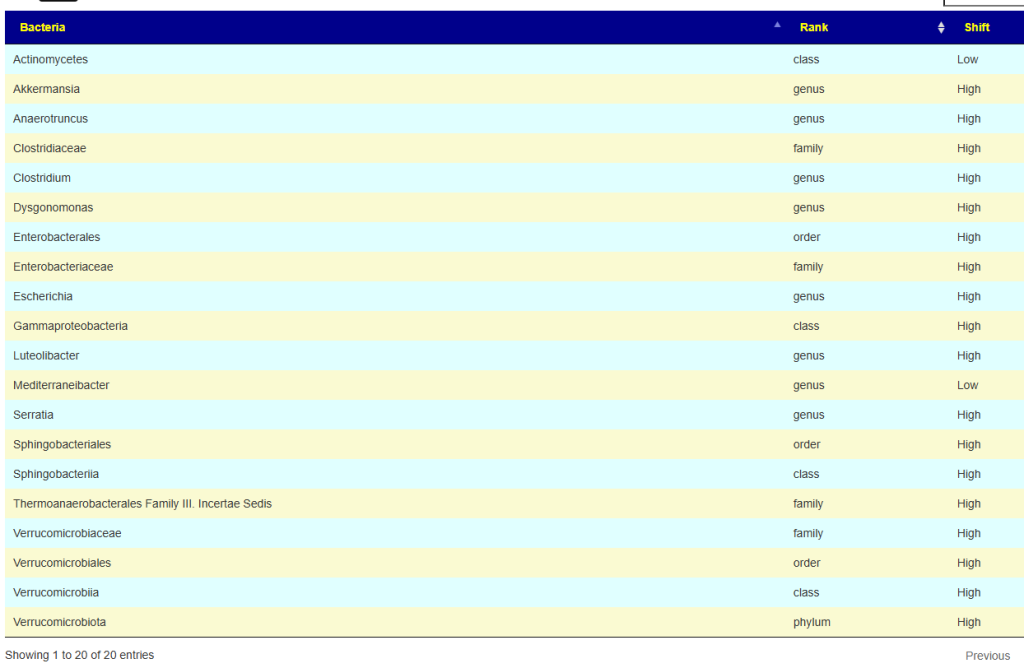
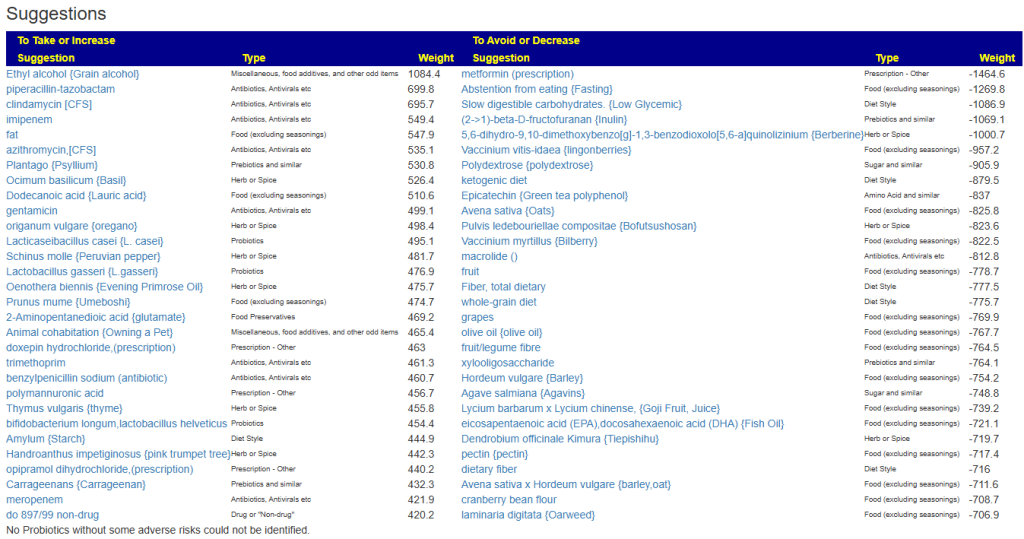
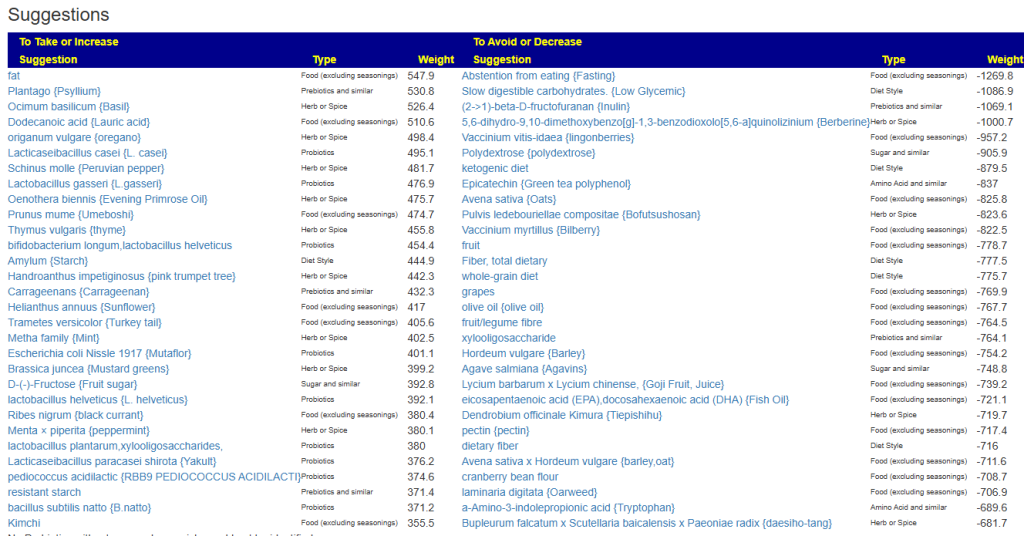
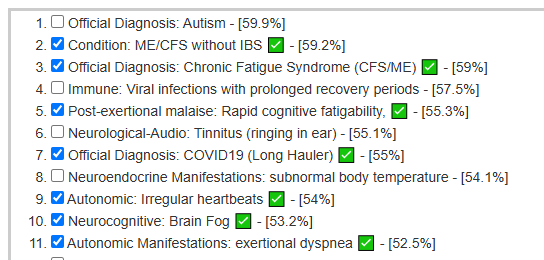
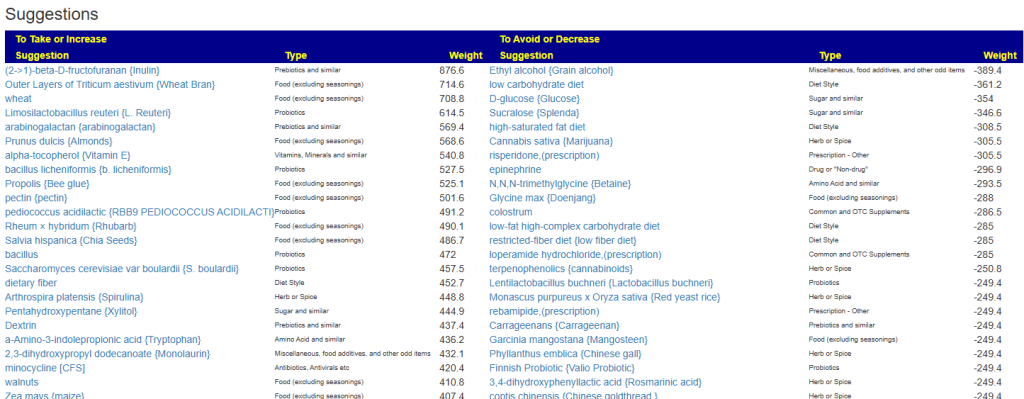
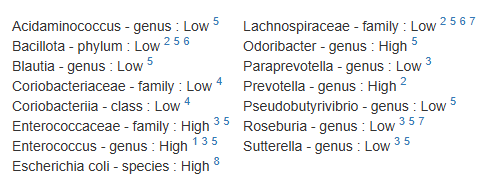
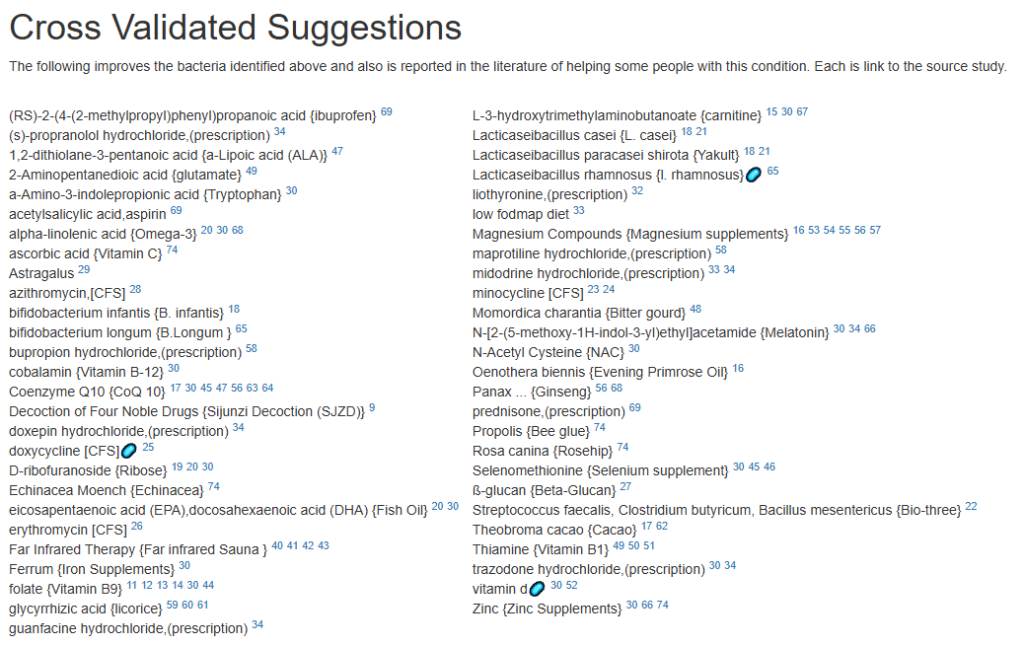
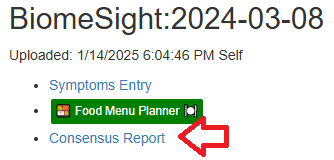
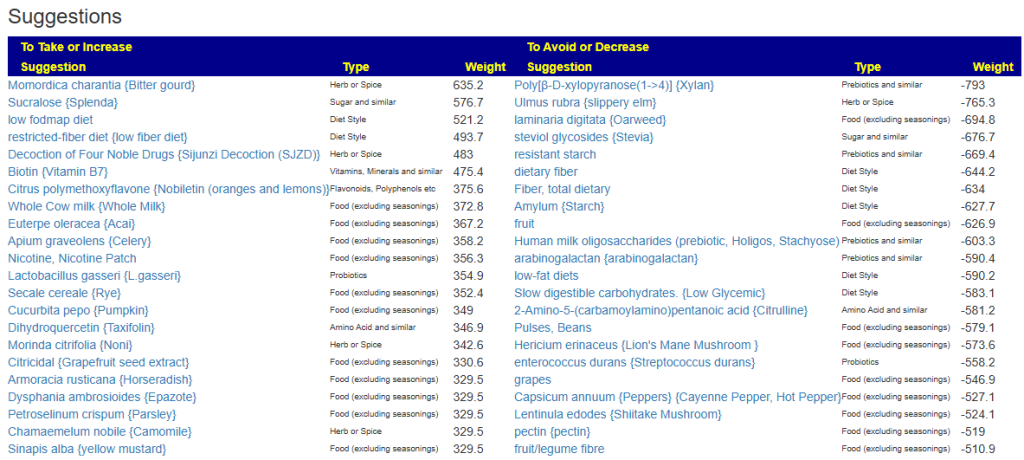
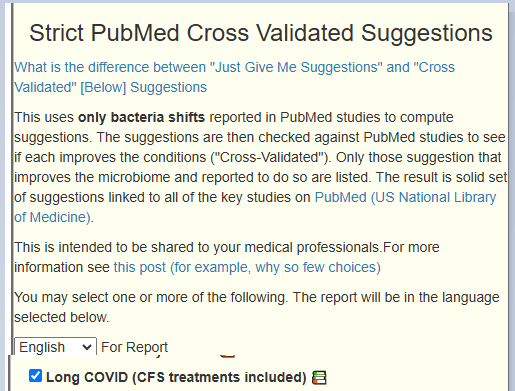
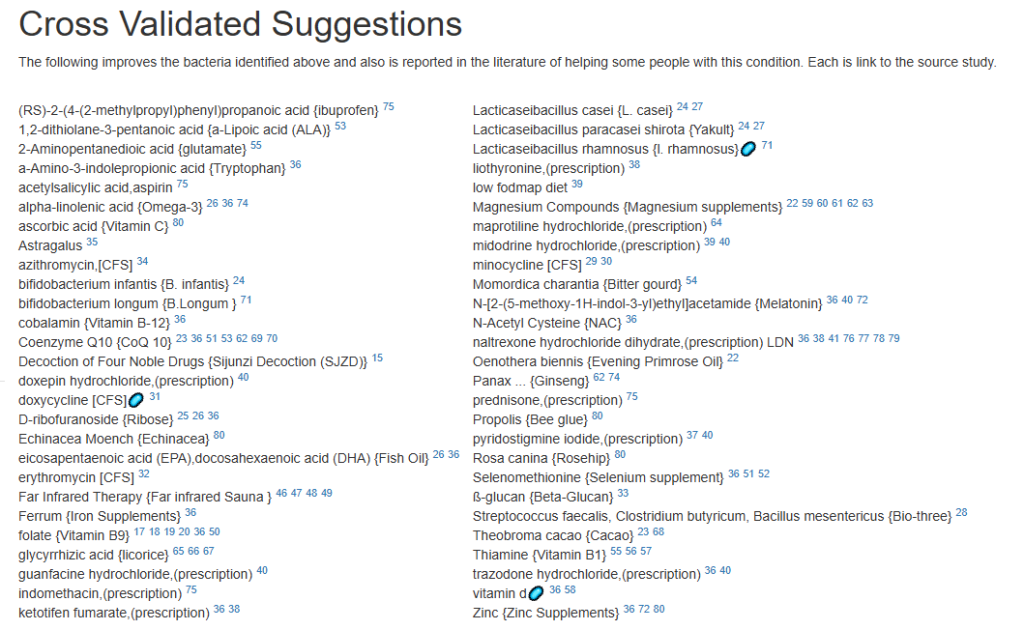
Recent Comments