This person has limited experience with the microbiome, so the video provides an enriched commentary on this blog post.
Person’s Back Story
- August 30th, 2016 I was in the post office and I got vey light headed and almost fainted. I was never the same. I was very dizzy and extremely lethargic. A brain MRI found a pituitary adenoma which MDs and neurosurgeons said had nothing to do with my symptoms.
- Symptoms were getting worse; head pressure, head tightness, extremely sensitive to sound, sensitive to light, low body temp and resting heart rate of 112. I went on a 25 day course of doxycycline to treat what some thought could have been Lyme disease.
- This destroyed my already compromised gut. I had my gallbladder out in 2006, h pylori in 2007 and have since had stomach issues.
- All kinds of additional testing and they could find nothing.
- Every doctor recommended anti depressants which I refused.
- November of 2016, I started ozone injections directly into the vein.
- I was put on hundreds of supplements for Leaky gut.
- Feb 2017, Neurologist found the brain SPECT scan was not normal. Poor blood flow to certain parts of the brain due to systemic inflammation.
- I had changed my diet and eliminated gluten entirely.
- Started coffee enemas a week prior to having these tests done
- New medical professional after reading my labs, she believed 100% I had celiac.
- I had eliminated all gluten and was also sugar, dairy, soy, grain and nightshade free.
- Started hyperbaric oxygen therapy and completed 45 dives in a hard chamber. I purchased a chamber for home use in August and received in October. I was doing daily dives until I got a sinus infection and got fluid in my ears do I have not dove in weeks.
- I’m scared because I have done so much for my health I don’t understand how I have a fatty liver.
- I am 5’2″ 114 lbs and eat and live so healthy.
- I have a whole house filtration system
- Purchased an infrared sauna in December and use that a couple of times a week.
- Diagnosed with SIBO in Feb 2018 after breath test at gastroenterologist.
- I kept going to doctors and they were telling me nothing was wrong.
- I had my gallbladder out in 2006, umbilical hernia in 2007 and h pylori in 2007 treated with triple antibiotic therapy.
And this is the very edited version, lots of specialists (many of whom have written books or have articles published on peer-review journals).
My Blinkered View
I am not a medical professional, I am a data scientist, statistician and software developer (see my Linked In for details). I am also very high function ASD — which gives me the ability to handle massive amounts of data with unbroken focus. The limits of my expertise is with building tools and designing artificial intelligence systems for the microbiome.
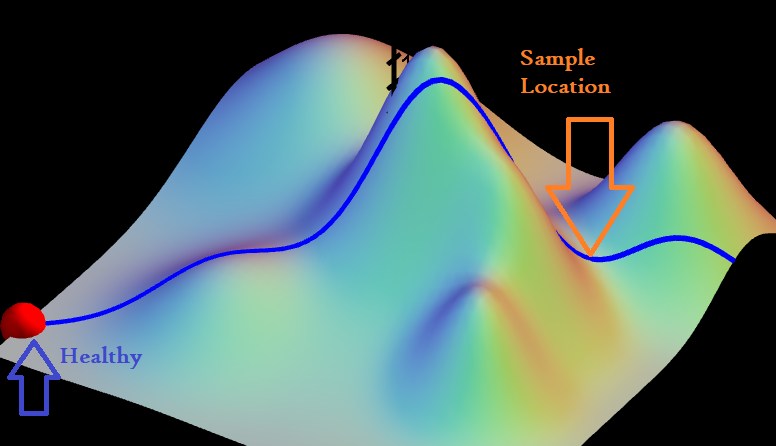
I work off the hypothesis that many symptoms and their severity are the results of microbiome dysfunction.
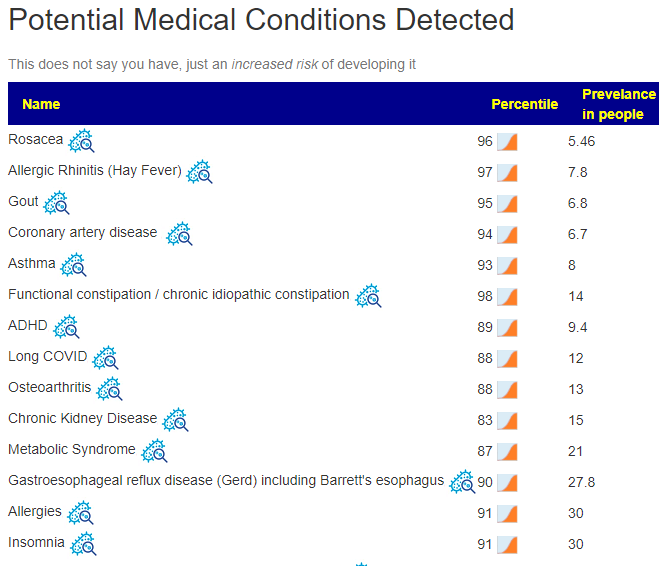
Looking a Potential Medical Conditions — there are definitely major issues, there are mountains of concerning shifts.
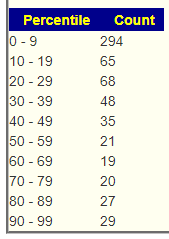
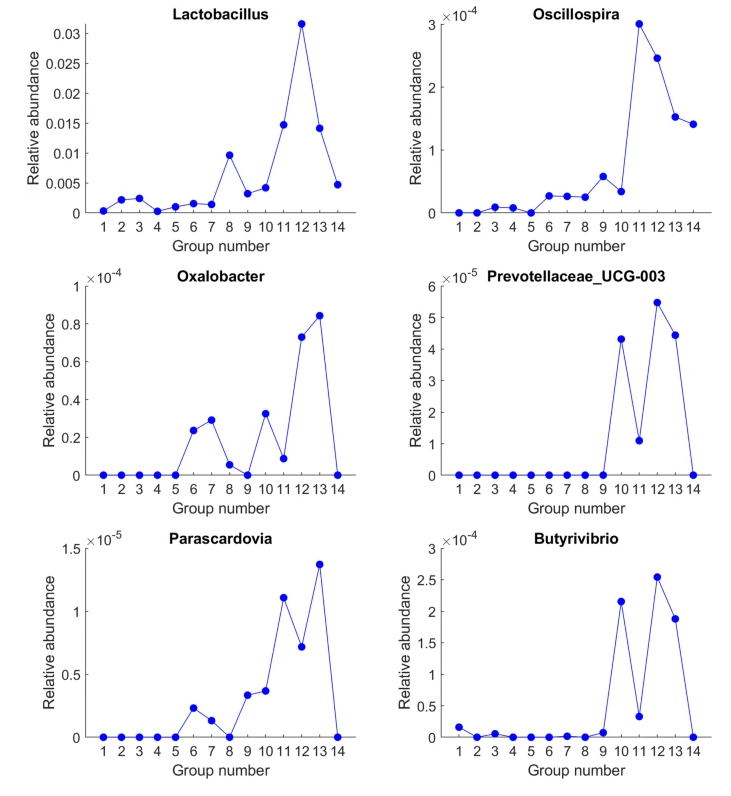
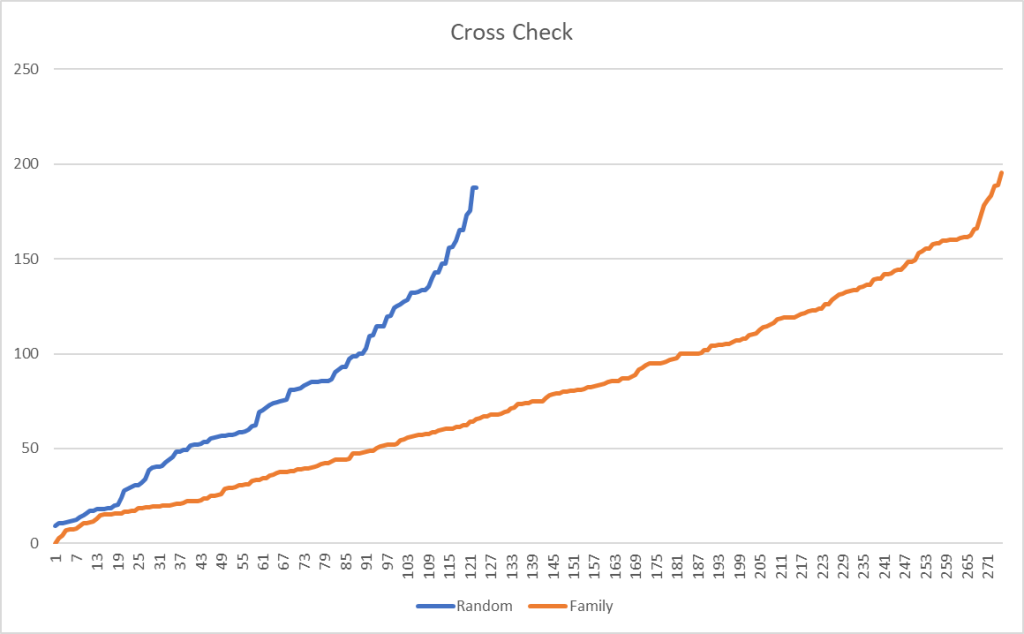
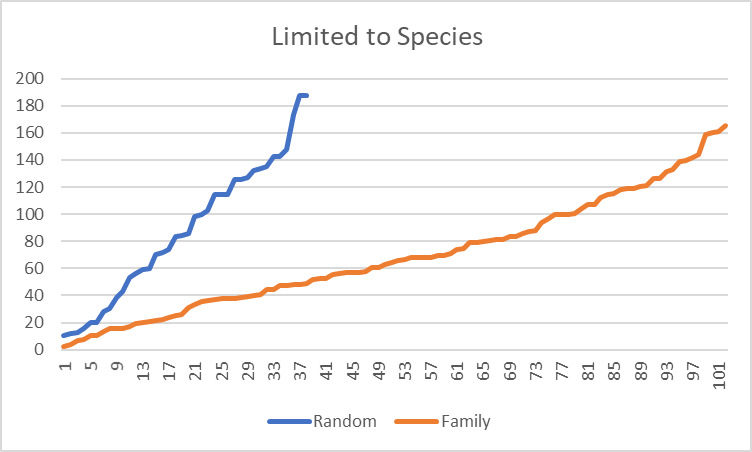
And on the normal side of the house, bacteria deemed unhealthy and Jason Hawrelak suggestions appear normal. In other words, it is not your usual case of gut dysbiosis. Rare bacteria are over represented as shown below. This will create some challenges, because modification of rare bacteria has very little information.
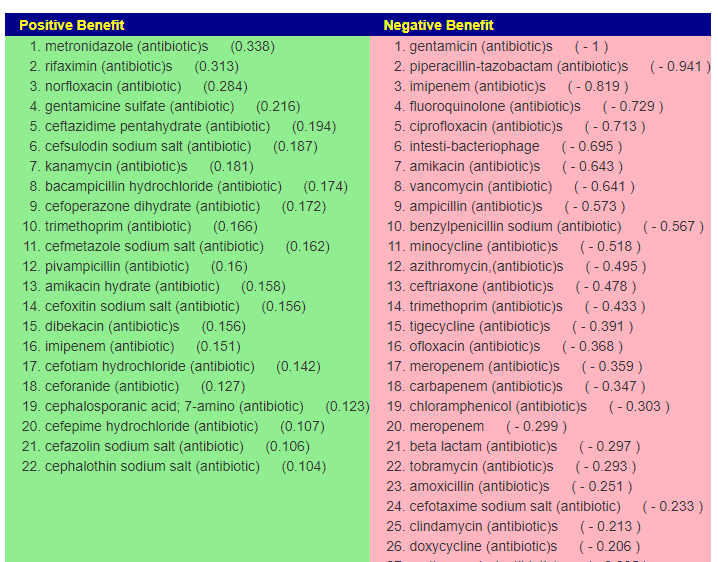
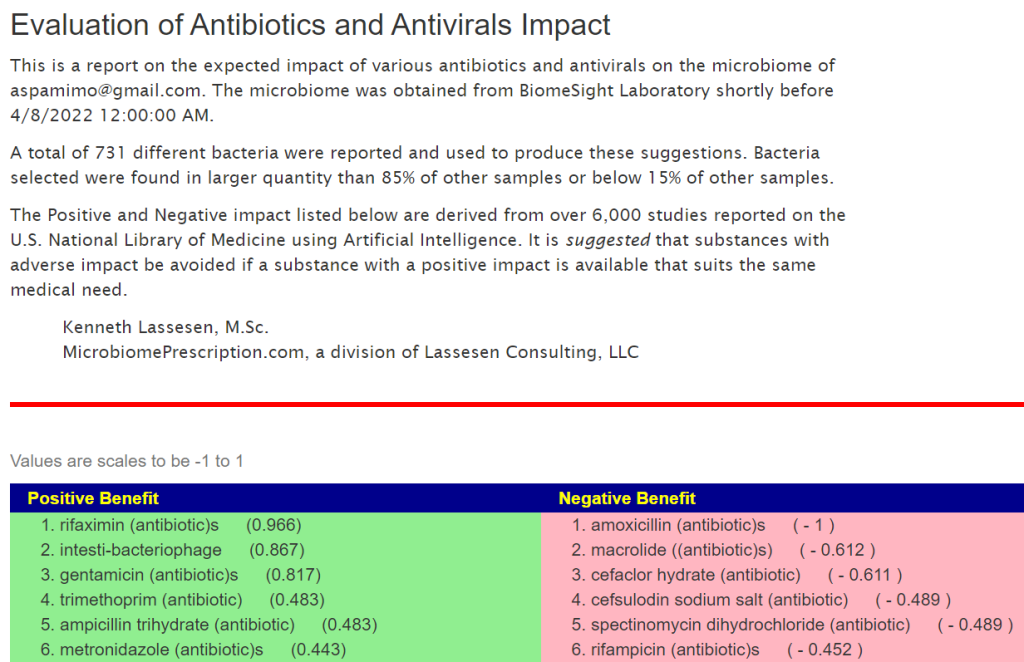
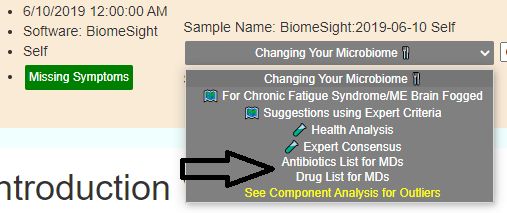
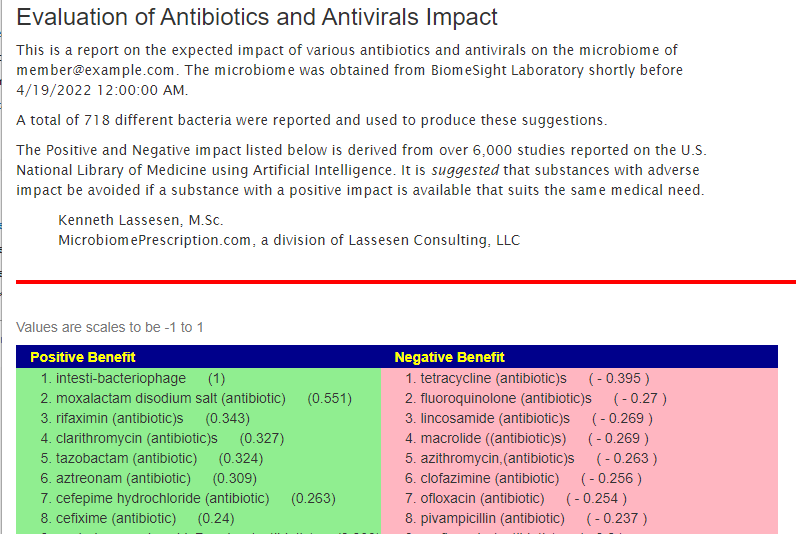
Looking at the Antibiotics page, we see that her poor response to the antibiotics she was given is reflected in the numbers computed from her microbiome.
Moving forward
Given the high number of unusual bacteria, my prefer start is at the DNA level, i.e. using KEGG data to see if there are deficiencies that can be moderated.
- RETAIL Probiotics is very similar to many people with dysfunction (so much that I keep double checking the computation). I listed the species after so you can better understand what you want in the probiotics)
- miyarisan (jp) / miyarisan – 907 (clostridium butyricum)
- enviromedica terraflora sbo probiotic -812 (bacillus clausii,bacillus coagulans, bacillus megaterium, bacillus pumilus, bacillus subtilis)
- Supplements – this is a much longer list than I usually see. Magnesium and Molybdenum are the my first choice from this list since they are involved in a lot of biological processes.
- Amylase (Enzyme) – Percentile: 5.7
- beta-alanine – Percentile: 1.5
- L-Cysteine – Percentile: 10.4
- L-glutamine – Percentile: 5.9
- L-Lysine – Percentile: 3.6
- L-Proline – Percentile: 5.7
- L-Threonine – Percentile: 6.5
- magnesium – Percentile: 1
- Molybdenum – Percentile: 5
- NADH – Percentile: 2.8
- Phytase (Enzyme) – Percentile: 12.7
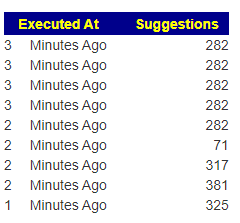
I will move on to the usual process of generating consensus suggestions. Given the unusualness of this sample, I do not know what to expect. It could be outside of our existing database (the above suggestions was based on DNA and thus we have almost complete coverage).
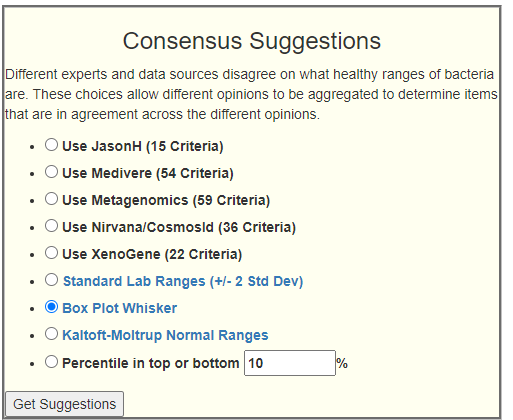
The top 5 selected 9 bacteria; Standard Lab Ranges came in with a very low (and surprising) 5 bacteria; Box Plot Whiskers Ranges had lower than usually seen, just 36; Kaltoft-Moltrup Ranges came in with a normal looking 137 bacteria, Filter by 10 percentile came in with a massive 332 bacteria!! Given what we saw above, these unusual atypical results are not surprising.
Looking thru the top consensus suggests, I see
- bacillus subtilis (probiotics)
- bacillus coagulans (probiotics)
- pediococcus acidilactic (probiotic)
- clostridium butyricum (probiotics)
- walnuts – a food very high in magnesium
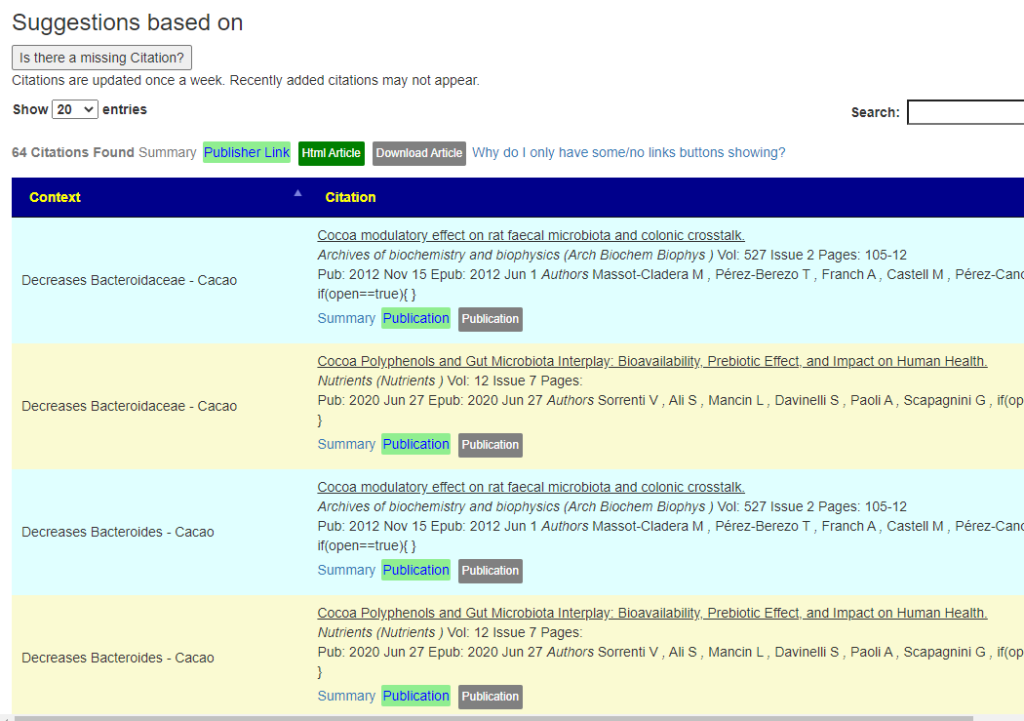
- Cacao
- avocado peel
- brown rice
- grape polyphenols
- Holy Basil
On the highest avoid list
- Slippery Elm
- glycyrrhizic acid (licorice)
- high red meat diet
- saccharin
- stevia
- l-glutamine – counter indicated to the DNA suggestions above, so I would omit it
There are 568 different items (I downloaded the file and open in Excel). With the exception of l-glutamine, all of the DNA based suggestions were either positive or not found (i.e. no clinical studies using them).

For diet planning, it may be good to write out your weekly supplements, food (including herbs used) and check each against the Excel spreadsheet and make minor changes as appropriate.
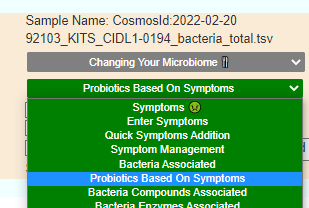
Trying the new Experimental Symptom Filtering
This person entered their symptoms, so it is available. If you are not familiar with this process, see this post.
- Symptoms Picked
- Immune Manifestations: Hair loss
- Comorbid: Small intestinal bacterial overgrowth (SIBO)
- Comorbid: High Anxiety
- Comorbid: Hypothyroidism
- Neurological-Audio: Tinnitus (ringing in ear)
When I went to the bacteria list, I was impressed by the number of bacteria listed with Weak Association
| Rank | Name | Your value | Percentile |
|---|---|---|---|
| clade | Bacteroidetes/Chlorobi group | 664840 | 79.8 |
| clade | FCB group | 664840 | 78.5 |
| class | Bacteroidia | 660490 | 80.3 |
| class | Holophagae | 40 | 61.6 |
| class | Negativicutes | 260 | 0.7 |
| class | Verrucomicrobiae | 60 | 11.9 |
| family | Akkermansiaceae | 60 | 15.9 |
| family | Bacillales Family X. Incertae Sedis | 200 | 28.7 |
| family | Bacteroidaceae | 598650 | 87.7 |
| family | Ectothiorhodospiraceae | 10 | 2.7 |
| family | Holophagaceae | 40 | 62.1 |
| family | Rhodanobacteraceae | 10 | 3 |
| family | Rhodothermaceae | 80 | 30.7 |
| family | Selenomonadaceae | 100 | 25.7 |
| family | Syntrophomonadaceae | 10 | 2.1 |
| family | Veillonellaceae | 260 | 9.3 |
| family | Xanthomonadaceae | 20 | 13.4 |
| Rank | Name | Your value | Percentile |
| genus | Acetivibrio | 150 | 30.6 |
| genus | Acetobacterium | 110 | 32.3 |
| genus | Akkermansia | 60 | 15.8 |
| genus | Alkaliphilus | 80 | 23 |
| genus | Anaerotruncus | 170 | 20.6 |
| genus | Bacteroides | 598650 | 98.9 |
| genus | Bifidobacterium | 440 | 26.3 |
| genus | Caloramator | 30 | 7.8 |
| genus | Coprobacillus | 150 | 30.6 |
| genus | Coprococcus | 3960 | 28.2 |
| genus | Geothrix | 40 | 62.8 |
| genus | Megasphaera | 10 | 0.7 |
| genus | Peptococcus | 200 | 40 |
| genus | Phocaeicola | 310709 | 96.3 |
| genus | Rothia | 10 | 3.3 |
| genus | Slackia | 30 | 10.6 |
| genus | Thermicanus | 20 | 5.5 |
| genus | Veillonella | 20 | 2 |
With Expected Association (more restricted criteria to be included, we had a reduced list. (Nothing showed up for Strong)
| Rank | Name | Your value | Percentile |
|---|---|---|---|
| family | Rhodanobacteraceae | 10 | 3 |
| family | Selenomonadaceae | 100 | 25.7 |
| family | Verrucomicrobiaceae | 60 | 24.6 |
| genus | Alkaliphilus | 80 | 23 |
| norank | Bacillales incertae sedis | 20 | 4.1 |
| species | Butyrivibrio proteoclasticus | 10 | 3.3 |
The list of suggestions to take was short (we have limited or no data we have on many of these bacteria).
I went back to Weak Association, and the list was very similar.
A trip to the wilderness…
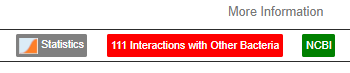
There is a manual “back door” to suggestions when there is no direct clinical study. Clicking on the bacteria listed above takes you to the information page. Note that there is an Interactions with Other Bacteria link.
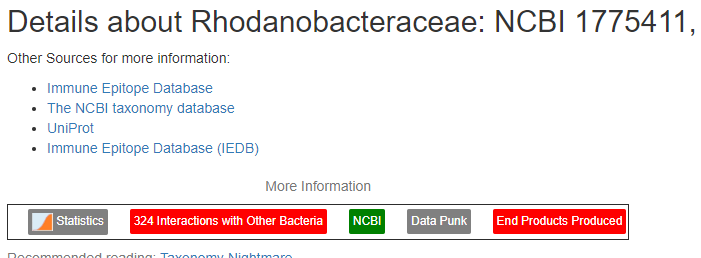
Clicking on this link, goes to a page showing the estimates for these interaction. On that page, there is a quiet link that we will now use.
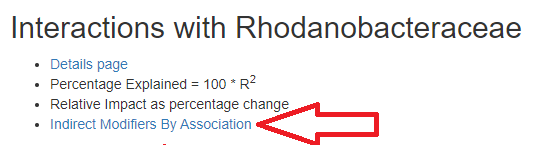
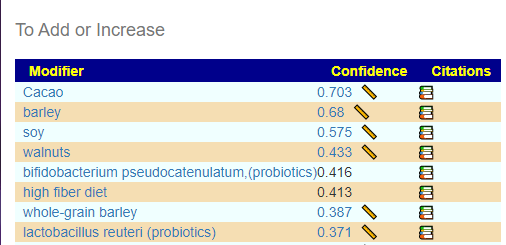
For this one, we wish to increase it (in fact for all of them), only one items shows up as increasing for any of them:
- choline deficiency - i.e. reduce choline in your diet if applicable
All of them have very similar list (likely because they are in the same “bacteria fraternity” )
Bottom Line
At this point, I have covered all of the paths that I prefer to shift the microbiome closer to normal / healthy. I would suggest the person takes this information and development an action plan (diet, supplement changes). As always, it should be reviewed by a medical professional familiar with the patient. After 2-3 months, a new microbiome should be done. I will gladly do a follow up to see how well things work or did not work.
I am interested in learning, not being right!
Now to feedback from this person:
This is too much information!
To prevent people from being overwhelmed, I would suggest working from the DNA suggestions above. The other suggestions have a bias because it is based on the number of studies (and thus popularity with researchers). The DNA suggestions lack this bias, there is a little bias because the bacteria sequenced for DNA are influenced by researchers choices, but the data is reasonably comprehensive.
Probiotics: Which product, dosage, when to take, for how long?
Q: “Enviromedica terraflora has 3 different sbo probiotics; advanced care, immune and daily. How do I know which one to get?”
A: Compare the contents to the list that it was computed from (click on enviromedica terraflora sbo probiotic to see the bacteria in it) . If all of these produces have the same amount of bacteria/probiotic, then use the one that is best pricing (i.e. BCFU/ $). The bacteria are:
I went to amazon to compare prices:
- Terraflora Advanced Care SBO Probiotic – $54, 1 BCFU per TWO capsules
- Terraflora Daily Care – $43, 1 BCFU per TWO capsules
- Terraflora Deep Immune SBO Probiotic – $51, 1 BCFU per TWO capsules
The daily care is what you want. The other have additional additives which may help or hurt — you need to check each one additives. We are keeping to the least complex route — so go with the Daily Care.
In general, these additives allows firms to upsell to more expensive products (far more than the price of the additives).
Dosages
There is a page with dosages for many supplements and probiotics — based on clinical studies (not what the manufacturer suggests on the bottle). The page is located here. Unfortunately, you will not find the retail product name listed, the list is by the bacteria name in the product.
bacillus clausii
bacillus coagulans – 1050 mg/day [Src]
bacillus megaterium
bacillus pumilus
bacillus subtilis – 1000 – 10,000 MCFU/day [src]
Since two capsules are 1 BCFU (aka 1000 MCFU), I would start a two capsules and every second day increase it by two capsules until you hit 10,000 MCFU (20 capsules!). If you notice changes, then either keep that dosage or step back the dosage. 10BCFU have been explicitly tested for safety [Study]
When to take?
This is a personal opinion, but just before bed time seems best. There are many many opinions out there and no well done studies. Typically there are one of two responses (depending on the person)
- Deep sleep, often with night sweats, as the bacteria interact with your immune system rebuilding itself (i.e. energy is not being directed at your activities, but the immune system) [Taking probiotics at night could make them way more effective. 2019]
- Insomnia — the effect of the probiotics is releasing chemicals causing wakefulness. If this is the case, switch to 1 hr after breakfast.
For how long?
Since probiotics do not persists, often their effect on “bad bacteria” is caused by them producing antibiotic compounds (most of our commercial antibiotics were discovered in bacteria). There are several studies that found that rotating antibiotics is far more effective than keeping to the same one. We should do the same with probiotics. A rule of thumb that I use is simple (and helps with monthly budget), is to do one month or one bottle (which ever comes first) and then move on to a different probiotic. For Terraflora, it’s a 60 count, doing the suggested dosage pattern cited above, it will last just 8 days until the bottle is empty.
For Miyarisan, (🍽️ clostridium butyricum (probiotics)) we have 330 tablets in a bottle. And studies [list] range from 60mg/day to 1050 mg/day. The literature says: 270 mg of butyrate-producing bacteria (Miyairi bacteria) in 9 tablets … so start with 4 capsules and keep increasing every 2nd day. It will take 21 days to get thru a bottle.
CustomProbiotics.com / L. Plantarum Probiotic Powder . This can come as a price shock to many people ($115 for a bottle) but their bottle recommends 0.8g, that is 320 BCFU per day. So one bottle is 62 days at that dosage (suddenly the price/day is similar to the above). The maximum for reference studies is 60 BCFU/day [src], so you go with lower dosage (this is a powder, not capsules). In this case, switch after 3-4 weeks.
Question: Where does this information come from
This was a question from this reader. The short form:
- the US National Library of Medicine (link) and
- Some 1,845,803 facts were extracted and entered into a database.
- Kyoto Encyclopedia of Genes and Genomes (link)
- Some 8,052,707 facts were extracted and entered into a database.
This data from used to build a mathematic model of the microbiome, what happens in it and what modifies it.
A longer form can be done as a walk thru:
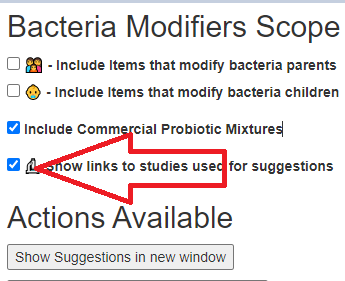
If you go to the ad-hoc suggestion page, there is a checkbox, “Show links to studies used for suggestions“. Checking this and then asking for suggestions results in the suggestion page showing a 📚
Clicking on this will list off the studies used to make this decision. An example below
What is very different from this versus advice from a MD is extremely simple. A MD may make a decision on typically a dozen facts that stuck in their mind, not the 10 million facts that this program, Artificial Intelligence, considers.
The downside is that a MD will not overwhelm you with information, he may prescribe just one drug or suggest something vague like “eat more fiber”. With this Artificial Intelligence, it will often identify which types of fiber should be eaten and which should be avoided. All of this is based on studies with the where did you get this suggestion from documented and linked to. If you ask a MD, you will be lucky to get a single document and could get an angry MD because asking for documentation could cause him offense.
Bottom line, you are investing in your body, similar to investing in the stock market. You are told to invest in tech stocks — so you buy some bit-coin stock…. and discover that you are worth a lot less (looking at recent history), or you start wading thru the various stocks and reading opinions for each, and likely make better choices and have a healthy collection of stocks (or body). There is no easy route for investing in either the stock market or your body (unfortunately).
Recent Comments