Early this year I took one week of antibiotics to deal with possible developing cellulitis. About a year prior, I took the antibiotic for a prior incidence of cellulitis. I have been taking just one regular prescription drug (L) for the last few years.
About two weeks after finishing the antibiotics, I developed itching in the legs which I expected to just fade away. Suddenly I had eye edema as shown, rashes, etc. A lot of other symptoms that my wife (with verified by tests) Mast Cell Activation Syndrome.
At peak
Calming down
Our medical professional prescribed high dosage of multiple anti-histamines. After two weeks there was little progress. After a lot of prompting of an AI, it suggested “L” may be a contributor. I always took this at bed time, and symptoms became much worse at night. I stopped taking it, the result was significant improvement every day since. My wife has told me that I am looking more normal every day, but I still have some distance to go.
A hint of one possible cause?
Although many many symptoms matched my wife’s MCAS symptom, it appears that histamines were not the issue.
“L” breaks down bradykinin, so lisinopril can increase bradykinin levels; this helps vasodilation but is also linked to cough and angioedema risk.
“Bradykinin and mast cell activation can overlap because mast cells may help trigger the kallikrein-kinin system, which can increase bradykinin production. Bradykinin can also increase vascular leak and swelling, so some symptoms can look similar to MCAS flares.” Mast cell degranulation and bradykinin-induced angioedema – searching for the missing link, 2024
Bradykinin can be measured but not usually as a routine clinical test. In practice, doctors usually test for the cause of bradykinin-related swelling rather than measuring bradykinin itself, because bradykinin is very unstable and hard to measure directly in blood. The most direct method is a specialized blood test using LC-MS/MS or a similar lab technique that measures bradykinin and its breakdown products. Some research methods use special sample handling, like drawing blood into chilled tubes and processing it very quickly, because bradykinin can change fast after the blood is drawn, Bradykinin measurement by liquid chromatography tandem mass spectrometry in subjects with hereditary angioedema enhanced by cold activation ,2025
Excessive bradykinin can be treated. In my case, the treatment was easy, stopping L.
Also note: that all of the papers being cited are 2024 and later.
Microbiome Role?
Just before these events I did a microbiome test. In two more weeks I am planning to do a second test. I will attempt to identify possible changes and how such changes could have cause these change.
Stay tune!
Random Notes:
“L” half life is report to be around 50 hrs. using 5 half lives to fully clear “L”, that is 250 hours or 10 days. I am assuming even a small amount of this “toxin” is sufficient for triggering
Where can I find a practioner well versed on gut microbiome, mold, and possibly gastrology? I’ve been getting worse the last few years with my functional provider that I’m now dealing with low ferritin, oxalates, mold, Sibo, Candida, and malnutrition. This has thyroid and hormones out of whack along with increasing TM.
Response:The harsh reality is many promises, very few deliver. A Colleague is spending many hours a week trying to instruct medical professionals on the gut microbiome… he says that it is painful…
Why is this so?
Looking at studies on the microbiome on PubMed we see an explosion of knowledge. 228,197 studies cited for “microbiome”. The consequences are simple:
Any medical professional that graduated before 2017 likely has had near-zero training on the microbiome.
Medical professional tend to use “established cook-book recipes” for treatment. One key reason is medical liability insurance.
For a microbiome issue like Ulcers, it took almost 50 years for the treatment cookbook to be widely adapted.
Antibiotics working was reported in the 1950’s
Barry Marshall and Robin Warren in 1979 identified the bacteria
In the 1990’s the FDA approved the use of antibiotics.
My father suffered (nearly dying) from a bleeding ulcer in the 1960’s. That reality contributed to my not wanting to wait until treatments are approved by medical insurance companies.
Solutions
Conventional
There are a small number of people with the appearance of skills. I have a list here. The people have not been evaluated (buyer beware), but they are at least interested. I know that Kristina Mitts actively uses microbiome prescription and is also a writer for BiomeSight ,example of one of her posts.
Self-Serve
I suffered from ME/CFS (Chronic Fatigue Syndrome) multiple times and have a lot of contacts that still have it. Most of those people cannot afford to go conventional. The same people also suffer from brain challenges, so I started up a blog site for them: CFS Remission. That site spawned my Microbiome Prescription site.
The intent of the Prescription site is to be an adjunct resource for patients. It will generate lists of suggestions based on 14,425,455 facts extracted from 21,279+ studies on PubMed. It may also prepare a detailed list of suggestions with evidence and logic for a MD to review. An example for depression.
Medical professionals do not have time to review an average of 2000 new studies a year. A professional is lucky to review 2 studies a week, not 40. There is a need to alter how they learn.
The site does no use “gathering of hearsay” a.k.a. LLM or ChatGPT, but an older fuzzy logic expert system AI. This is very different from the “hot new AI’s”
I do not know the “right/best way” of determining suggestions. I compute suggestions that mathematics suggests having a greater chance of helping instead of hurting. From feedback and from 2nd sample analysis — it seems to improve people (Analysis Posts on Long COVID and ME/CFS).
The intent is for users to review the suggestions with their medical professionals and get their approval for the plan before starting. Most medical professional will identify any risky items (for example, “Round-Up” once showed up!!) and then say “Whatever, no concerns”
The site is free for individual use. Donations covers operating costs. I have no need to generate revenue from it (50 years in information technology paid well).
Postscript – and Reminder
I am not a licensed medical professional, and the laws where I live prohibit any activity that could be interpreted as practicing medicine or giving personal medical advice. My work is limited to academic and analytical models, and I restrict myself to the language of science and statistics rather than clinical recommendations.
I cannot tell anyone what they should or should not take. Instead, I can present information about items that, based on numerical and statistical analysis, appear to have better odds of improving microbiome-related measures. I am a trained, experienced statistician with appropriate degrees and professional affiliations, and my role is to interpret data—not to treat patients.
All information I provide is for educational and informational purposes only and is not a substitute for professional medical advice, diagnosis, or treatment. Any ideas, rankings, or “suggestions” derived from my analyses must be reviewed and approved by your qualified medical professional before you decide to act on them.
The answers and explanations I provide describe my reasoning and methodology. They are not intended as medical advice for you or for anyone else, and they do not create a doctor–patient or provider–patient relationship. Always consult a knowledgeable licensed healthcare professional before starting, changing, or stopping any treatment, supplement, or health-related regimen.
I wonder if you would be willing to write a blog post looking at my recent test results in comparison to last year? Confirmed diagnosis of ME/CFS. UK NHS only helps with pacing advice.
First BiomeSight test: 2025-04-17
Following this, 3 self-directed cycles of antibiotics, probiotics, prebiotics, and diet changes based on MicrobiomePrescription results. First 2 cycles increased my baseline and reduced symptoms dramatically, third cycle set me back slightly. Overall very positive.
Unfortunately then was hospitalised later in 2025 with a perforated and infected gallbladder, sepsis. They rotated through quite a few different harsh antibiotics trying to find one which worked. Then in December 2025 went in for surgery to remove the gallbladder, more antibiotics.
Second BiomeSight test: 2026-03-16
My baseline now is worse again, many symptoms returned. I am loathe to use more antibiotics while some of my bacteria are so low (Akkermansia at 0.006) even though my positive scores are dominated by antibiotic suggestions. Would like to focus on probiotics, prebiotics, herbs, supplements, diet changes for now.
Any insight would be most appreciated.
Confirming the Worst
Going over to the symptom compare tool, we see that you are now worse than a year ago. 140 of 141 symptom forecasts are significantly worse! Seeing number this much worse is unusual but consistent with his events and perception.
Going Forward
My last two post has been evaluating the alternative path — instead of attacking the bacteria causing symptoms, push the person to a statistically significant healthy microbiome. The following links may be worth a reading:
This approach matches “I am loathe to use more antibiotics” because antibiotics typically are on the avoid lists with the healthy approach and high on the to take list attacking symptoms. It is sitting on the Simple UI page.
Basic Results:
52 bacteria were identified — every single one was too high.
I have broken suggestions into classes below. In general, I have kept them to items with an impact of at least 1.
Items listed are order by largest impact first.
Herbs
The top herbs are below. I was delighted {Bofutsushosan} was listed because it is well known increases Akkermansia which he is concerned about.
Food
Flavonoids
Vitamins
Common and OTC Supplements
Probiotics x PubMed
This list is done using PubMed studies.
Probiotics x R2 Model
I prefer the R2 Model because we have a lot more data to use than with PubMed. On the flip side, this does not have clinical studies supporting the choices.
The top probiotic Bacillus thuringiensis suitable for human consumption may be a challenge. Most retail products are formulated to control caterpillars, worms, or mosquito larvae in gardens and standing water, not for ingestion or probiotic use.
DoMyOwn sells a dedicated Bt category and says it’s available through their store rather than big-box shelves.
FBN lists Bt ingredient-based products, including Bacillus thuringiensis subspecies tenebrionis.
DIY Pest Control lists Bt products and notes common trade names like Thuricide and Mosquito Dunks.
Summary
I look forward to see how well this alternative approach performs. It does not focus on the bacteria associated with his 141 symptoms — instead, we focus on shifting to a healthy microbiome profile (with very high statistical significance, p < 0.0001,) I would suggest retesting every 3-4 months to track progress.
Questions And Answers
Q: It’s interesting to see how some Odds Ratio based suggestions match with the Consensus Suggestions, and some vary wildly.
A: Suggestions are based on bacteria target and available literature. Literature is sparse and often without replication of results
The safest path would be to start with items that are in agreement.
Q: I had one question with regard to whole milk, dairy, and lactose. The Odds Ratio analysis suggested these were positives – this makes my life a lot easier as I was using milk to help ferment and increase the CFU of the probiotics I used last year and hoped to again, and I eat a fair amount of dairy in general (I mostly eat a vegetarian diet with occasional fish, and dairy helps with my protein intake).
However when I ran the Consensus Suggestions earlier this week I got scores of -294.9 for bovine milk products, -120 for whole cow milk, and -158.6 for lactose.
A: I favor the Odds Ratio. On this point as you have no issues with dairy, keep to your current usage.
Q: Does this mean I likely need to make a choice between the Consensus Suggestions route (which I followed last year) and the new Odds Ratio route?
A: No, you could start doing a consensus of the consensus and odds ratio. Then add in items that disagree. I would suggest using an ratio evaluation:
Consensus: -120 with min of -960, so -(120/960) = -12.5%
I am not a licensed medical professional, and the laws where I live prohibit any activity that could be interpreted as practicing medicine or giving personal medical advice. My work is limited to academic and analytical models, and I restrict myself to the language of science and statistics rather than clinical recommendations.
I cannot tell anyone what they should or should not take. Instead, I can present information about items that, based on numerical and statistical analysis, appear to have better odds of improving microbiome-related measures. I am a trained, experienced statistician with appropriate degrees and professional affiliations, and my role is to interpret data—not to treat patients.
All information I provide is for educational and informational purposes only and is not a substitute for professional medical advice, diagnosis, or treatment. Any ideas, rankings, or “suggestions” derived from my analyses must be reviewed and approved by your qualified medical professional before you decide to act on them.
The answers and explanations I provide describe my reasoning and methodology. They are not intended as medical advice for you or for anyone else, and they do not create a doctor–patient or provider–patient relationship. Always consult a knowledgeable licensed healthcare professional before starting, changing, or stopping any treatment, supplement, or health-related regimen.
This is the second review I have done since working through the implications of Mathematically Derived Healthy Microbiome. It highlights two very different strategies for improving gut health.
The earlier approach focuses on targeting bacteria that show statistical associations with symptoms. This approach often places many antibiotics near the top of the recommendations. When antibiotics are involved, I tend to favor the Cecile Jadin Protocol for ME/CFS.
The newer approach uses the revised model to target bacteria associated with a healthy, asymptomatic gut. In this approach, antibiotics often appear among the major items to avoid.
Both approaches are based on statistics, but the newer one has a much stronger statistical association.
The earlier approach has a track record of significantly improving the microbiome during the first few cycles. For some people, however, those improvements eventually stall. It also requires a friendly MD to prescribe the antibiotics, which is often a challenge.
If you apply the earlier approach one symptom at a time, the recommendations often contradict each other. “No man may serve two masters” becomes “No recommendations may heal two symptoms.”
The newer approach has no track record yet. It has only recently become available, and it is now being tried by someone whose progress has stalled.
So which one should you use? If you have a friendly MD, I would go with the earlier approach. If you do not, I would go with the newer approach.
Back Story
My symptoms have been somewhat confusing, but for many years ,like over 10 years ago I was constantly bloated with excessive wind/gas but also a lot of belching too. I would eat lots of wheat and sugar and processed foods. 2011 ended up on Proton-pump inhibitors (PPIs) on and off for over 10 years. 2016 appendix burst & got severe peritonitis and ended up very poorly, had 2 weeks of intravenous antibiotics. Slowly recovered.
Years of migraines and brain fog – but yet very active and social.
Then in 2022 I developed throat irritation that was exacerbated (i now believe by certain foods/Ingredients, alcohol, occasional smoking Definately fatty foods but I still cant quite put my finger on what made my throat irritation/ hoarse voice worse). I then developed Biliary Gastritis in October 2024 (Stomach lining erosion) likely from a possible intolerance just like the throat irritation. I became very constipated and still struggle with that.
Foods that make me worse maybe
Overly fatty foods
Possibly milk
Wheat, bread
Possibly some fruit
Big blood sugar spikes off things like carrots and oats, sweet potatoes, very sensitive to carbs and sugar (i wore a glucose monitor out of curiosity) I am not diabetic.
Initial Review
There are two distinct paths, or algorithms, available in Microbiome Prescription.
The prior approach, which I call Traditional, begins with a few straightforward questions:
Are you prepared to risk a severe Jarisch-Herxheimer reaction? It happens often.
If you are working, can you afford to miss a few weeks?
Do you have a friendly MD who is willing to prescribe a single course of each antibiotic listed below and become familiar with Jadin’s protocol?
The newer approach, Healthy Target, was recently added based on an odds-ratio model derived from healthy people. Instead of chasing symptoms, it shifts the goal toward a healthy gut. It does not address individual symptoms directly.
Building Suggestions
Probiotics
We actually have three ways of getting probiotics suggestions:
Traditional Approach
Healthy Target using Clinical Studies from PubMed
Data is very sparse on impacts
Healthy Target using the “R2 Model” (a statistical model, not clinical studies)
Data is rich on impacts
We are going to compare only the positive probiotics from the R2 model that are easily available and the top 3 of the other models.
Apart from Lactobacillus fermentum we have disagreement on positive or negative impact. A similar result is often seen when doing symptom by symptom with the traditional approach. We lack sufficient data to have certainty. Being a statistician, I favor the approach with the highest statistical significance — i.e. the novel or Healthy Target approach.
My Current Preference
There is nothing stopping a person trying one approach for 6-12 weeks and then retest; then switch to the other for 6-12 weeks; retest. Make sure that you keep detail notes on responses.
Sample Comparison Tool (example below)
comparing the Healthy Microbiome Estimate from the two sample
My impression is that the novel algorithm agrees better with their reactions. This shifts me further towards advocating for the novel algorithm.
Diet Plan
Often people want to simplify suggestions to one specific type of popular diet. This approach often defeat suggestions. Where diet are mentioned, they are secondary or tertiary guidance. Some generic diet studies appears in the suggestions, for example:
This is intended as supplemental information to refine other suggestions where there is not sufficient information. The diets are what is cited in the literature. Most diets tend to be poorly defined. The classic example is Mediterranean diet. Often the “US Version” fails on the seafood or lamb aspects.
The exact foods vary by region: Greek-style diets may include more yogurt, feta, olives, and seafood, while other Mediterranean areas may use more pasta, beans, lamb, or different local vegetables and herbs. Even the meal pattern can differ, but the overall theme remains plant-forward, minimally processed, and olive-oil based.
Another example is the low-fiber diet. It is usually defined to be under 10 to 15 grams of fiber per day (about 1/2 of the recommended amount of fiber). However, studies show that the US population averages 15-16 grams per day!! so most Americans are already on a low-fiber diet
From the recommendations given I would build a general food diet from:
1 cup of blackberries each day, some lingonberry if available at a reasonable price
Chicken as proteins source, no fish, little meat, no rare beef
I am not a licensed medical professional, and the laws where I live prohibit any activity that could be interpreted as practicing medicine or giving personal medical advice. My work is limited to academic and analytical models, and I restrict myself to the language of science and statistics rather than clinical recommendations.
I cannot tell anyone what they should or should not take. Instead, I can present information about items that, based on numerical and statistical analysis, appear to have better odds of improving microbiome-related measures. I am a trained, experienced statistician with appropriate degrees and professional affiliations, and my role is to interpret data—not to treat patients.
All information I provide is for educational and informational purposes only and is not a substitute for professional medical advice, diagnosis, or treatment. Any ideas, rankings, or “suggestions” derived from my analyses must be reviewed and approved by your qualified medical professional before you decide to act on them.
The answers and explanations I provide describe my reasoning and methodology. They are not intended as medical advice for you or for anyone else, and they do not create a doctor–patient or provider–patient relationship. Always consult a knowledgeable licensed healthcare professional before starting, changing, or stopping any treatment, supplement, or health-related regimen.
Hello, could you tell me which antimicrobials are okay to use without killing the good bacteria? I have hydrogen SIBO, methane SIBO, and hydrogen sulfide SIBO. I don’t want to make things worse because I no longer have bifidobacteria, lactobacilli, and Oxalobacter in particular. And I don’t want to take something broad-spectrum.
I was especially wondering about clove and thyme. I also have fungal issues and yeast in my body, possibly related to mold. Could you explain how to tell whether an antimicrobial is harmful to the good bacteria? Thank you
What is defined as good or bad?
The issue is not that simple as “good” or “bad”. Too much of a “good” bacteria is associated with a variety of conditions. Let us look at the research for two commonly believed “good” bacteria:
Lactobacillus is reported HIGH (from 119 studies) with
The Human Need for Simplicity versus Biological Reality
I am a high functioning autistic spectrum individual. Others in the spectrum include those with photographic memory and complete memory recall. I lack those, but where I excel is my tolerance for complexity and uncertainty.
Across my 50-year career in software development, I’ve noticed that code I find straightforward often overwhelms other developers. One once remarked, “Any JavaScript file over 200 lines is black magic to me,” while reviewing what I considered a simple application. That experience reflects something broader: people naturally seek simplicity, even when reality is irreducibly complex.
In the same way, many approach microbiome science by labeling bacteria as “good” or “bad.” This reduction helps those who feel saturated by excessive detail—but the truth is far more nuanced.
The Evolution of Microbiome Prescription
For more than a decade, my goal with the Microbiome Prescription project has been simple in principle:
Accept scientific evidence—a microbiome test.
Compute suggestions aimed at correcting dysbiosis.
The biggest challenge lies in determining which bacteria should shift, and in what direction. My early approach relied on lab-provided ranges: if a value was above range, reduce it; if below, increase it. But this method failed. Lab ranges are based on naïve averages and assume normal distributions. After teaching Ph.D.-level statistics, I knew better—bacterial populations follow heavily skewed distributions, not bell curves.
The next phase was to use symptom-annotated samples to mathematically model bacterial associations. When a new sample arrived, the system forecasted likely symptoms. Users checked which symptoms applied, improving both the model and predictive power.
Subsequent tests validated these forecasts: 53 predictions improved, while 19 worsened. It became clear that “gut health” cannot be captured by any single number. The ecosystem is too complex.
“No Protocol Can Serve Two Symptoms”
This phrase is an adaptation of Matthew 6:24: “No man can serve two masters.” When multiple symptoms are modeled independently, the results often conflict—what helps one symptom can worsen another. The earlier data illustrates this problem: 53 improvements, 19 regressions.
Rather than fighting symptoms individually, I began shifting focus toward the overall trajectory of health.
From Symptom Fighting to Health Trekking
A turning point came during an experiment using odds ratios derived from annotated microbiome samples—this time ranking bacteria by percentiles instead of percentages. Different labs report percentages inconsistently; percentiles normalize those variations (as discussed in this review).
Using 1,000 healthy individuals’ shotgun results from PrecisionBiome.EU, I noticed a striking pattern: “Asymptomatic: No Health Issues” consistently ranked as the top prediction.
That insight simplified everything. Instead of juggling countless symptom-specific models (10, 20, or even 200 symptoms), we can statistically track a single target—how far a sample deviates from “asymptomatic.” See definition here.
Now we’re just juggling one ball.
Reality vs. Model
The refined model depends on detailed microbiome tests—at least 16s sequencing, shotgun preferred—and percentile rankings for each bacterium. Unfortunately, most labs don’t provide percentile data. From Biomesight and Ombre, I can derive percentiles accurately from their percentage data. Some others attempt to estimate percentiles by assuming a bell curve—again, incorrect.
Recommendations for Individuals
Before ordering a microbiome test, confirm that it allows downloadable data with:
Percentile and percentage values.
Bacteria identified by NCBI Taxon numbers.
Recommended providers: Ombre or Biomesight (for better percentile reliability).
After testing, upload your results to Microbiome Prescription and simply click to start analysis.
Older analytical methods remain available and effective for many users, though progress may plateau for some. See Another ME/CFS Microbiome Update for details.
This is part of this continuing saga with this person. Prior posts and the labs shown below. Repairing the microbiome is not a single test, take a pill, and you are done. It may be like a long journey by sail through the fjords of Norway: a lot of course corrections!
I would say that there is no improvement since the last test. So this is still applicable:
I have not been feeling so well lately (since the last year). I would say that my symptoms has become worse. Earlier it has always felt as I have done some progress but the last 18 months it has been the opposite. Earlier I got rid of my muscle and joint pain but it has come back and I have much bigger issues with my red nose and my body feels very stressed.
Also feel very bloated.
A summary of my biggest issues:
Get the red nose (some form of rosacea).
Feel fatigued (both physically and mentally).
Feeling stressed.
Brain fog.
Bloated.
Lots of gas – I fart and burps a lot.
Issues with allergies
Muscle and joint pain
For the last 4-5 years I’ve been eating large amounts of rye and oats.
Around 150-200 gram of rye bread every day.
Around 70 gram of oats every day.
Been eating low fat, low protein and high carb (specially from rye, oats, apple juice and potatoes) because this diet seem to reduce my symptoms. As soon as I start to eat high meat and high fat my symptoms get worse.
In this analysis, I am going to look at:
Changes since the last sample
Review a new approach that is being incorporated
Looking at suggestions and the difference between the new approach and the traditional approach
At the end, I suggest following the new approach with the motivation that the traditional approach has appeared to have stalled. The microbiome adapts to antibiotics and diet changes; rotation to alternatives often seems to be needed to keep destabilizing the microbiome dysbiosis.
Changes Between Samples
Going to Old UI/Multiple Samples we compare symptom matching values. We see that just 1 of 42 showed improvement.
Looking at the new Odds Ratio data, we see the number of bacteria identified as critical in different samples below / Odds Estimate. I am not clear on the meaning and significance…
Odds Estimate: The higher the number, the more likely that the person is healthy
Number of Bacteria: Not reliable because different bacteria contribute differently to health.
2026-03-06: 59 / 1632
2025-11-17: 36 / 1588
2025-03-30: 20 / 1671
2024-12-03: 21 / 1561
2024-09-02: 36 / 1611
2024-01-22: 58 / 1586
2023-09-12: 38 / 678
2023-02-22: 52 / 1707
2022-08-11: 30 / 886
2022-03-25: 24 / 1037
2021-12-03: 15 / 1287
2021-08-31: 49 / 757
My general reading is that from 2021-2024 there was improvement and now the person is in a new stable healthier state but with still dysbiosis. I am hoping that the switch to an alternative view of solving his health may result in further improvement. In other words, rotation of approaches.
Another View on the Same Issue
In my recent post, Turning Fixing the Microbiome Upside Down!, I introduced a different way to think about repairing the microbiome. A human–society analogy might make it clearer.
Imagine your city is struggling with homelessness, vagrancy, and petty crime. The usual response—especially in the U.S.—is to send in the police. Round up those panhandling on the streets! In microbiome terms, that’s like identifying “bad bacteria” and launching an attack.
But there’s another approach: offer housing, mental health care, and job training. You don’t punish people—you help them heal and reintegrate.
Traditionally, Microbiome Prescription has focused on detecting problematic bacteria and trying to suppress or adjust them. The challenge is that most people have many interconnected symptoms. Research often shows that substance X improves one symptom but worsens another. You end up chasing symptoms—fixing one only to see another emerge or intensify.
A more holistic alternative, which has only recently become possible, is to guide the person’s microbiome toward a naturally healthy state instead. See this post: Mathematically Derived Healthy Microbiome.
Recently I asked the head of a microbiome testing company, what statistical evidence do you have for what is a healthy or desired microbiome profile. How do you obtain the importance of each bacteria? He knew that using means and standard deviation were invalid because of the high skew with the data. His response was requesting his staff to remedy this situation, looking at odds-ratio as a starting point.
Evaluation
I am a modeler, not a medical professional. Modelers try putting together mathematics using available data and use that to generate predictions. Once the predictions are made, they are evaluated against any available facts.
Above we have some observations from the person, the model does not know this information — so we can evaluate predictions against this data.
Been eating low fat, low protein and high carb (specially from rye, oats, apple juice and potatoes) because this diet seem to reduce my symptoms. As soon as I start to eat high meat and high fat my symptoms get worse.
Each of the above depends heavily on the bacteria selected and the threshold used. It is interesting to see that the new “Make Healthy” is a clear winner against his observations.
What is particularly interesting with the “Make Healthy” is that values were computed for 1,632 substances. Looking at the list os suggestions, we do not have a mass of antibiotics seen on the other lists. We are not focused on reducing bad bacteria, rather on improving the good bacteria, and letting those address the bad bacteria. The top items are below.
N-acetylneuraminic acid {Sialic acid} : a bioactive sugar involved in cell signaling, glycoproteins, glycolipids, and is abundant in the brain; it is linked to cognitive function, memory, and immune function in general mechanistic descriptions
My impression is that this is a much friendlier set of suggestions. In fact, the bottom of the list (to avoid) are pages of antibiotics and prescription drugs.
Probiotics Exploration
There are two ways of getting probiotics:
Using published studies on their impact. In general, each study describes one or two bacteria impacted. This results in low data
Using the R2 Associations: This is a modelling of their impact with hundreds of bacteria impact estimated.
The new Healthy Algorithm includes R2 recommendations
We got the following suggestions
We will explore how different algorithms evaluate these.
Bacteria
Healthy With R2
Healthy With Studies
Symptoms With Studies
Novice with Studies
Streptococcus thermophilus
1988
-1 to 4
-132 to -139
-132 to -139
Enterococcus faecalis
1291
.6
-579
-579
Bifidobacterium infantis
1124
-2
76
76
Bifidobacterium breve
377
1
213
213
Bifidobacterium longum
365
1
-1423
-1423
Bacillus thuringiensis
96
n/a
n/a
n/a
Pichia kudriavzevii
38
n/a
n/a
n/a
Acidipropionibacterium acidipropionici
22
n/a
n/a
n/a
Aspergillus oryzae
15
.1 – 3
-192 to 8
-192 to 8
Lactobacillus acidophilus
4
0
-574
-574
Keeping to the “When in disagreement, leave it out” a.k.a. Minimal Risk a.k.a. “Do not harm”, we have
Top choice is Bifidobacterium breve
Reasonable choice is Bifidobacterium infantis
Alternatively, Streptococcus thermophilus high value, cheap, and easy availability — it is a good candidate to try a 2-4 week experiment.
Personally, I would be tempted to try the following pattern (starting at a low dosage and increasing):
3 weeks of Streptococcus thermophilus (up to 10 BCFU)
2 weeks of Bifidobacterium breve (up to 20 BCFU)
2 weeks of Bifidobacterium infantis (up to 20 BCFU)
Bottom Line
My personal choice would be to go with the “Healthy Algorithm” for the following reasons:
The traditional approach has appeared to stall, time for a change
It is heavily based on very statistical significance over the entire scope of bacteria involved (i.e. dense data) but it has not been validated by clinical studies.
I have always been unhappy about clinical studies because the data is:
Messy (typically in the context of one or another medical condition)
Small sample sizes
Low resolution to bacteria
I am also curious to see how well the “Healthy Algorithm” performs.
Postscript – and Reminder
I am not a licensed medical professional and there are strict laws where I live about “appearing to practice medicine”. I am safe when it is “academic models” and I keep to the language of science, especially statistics. I am not safe when the explanations have possible overtones of advising a patient instead of presenting data to be evaluated by a medical professional before implementing.
I cannot tell people what they should take or not take. I can inform people items that have better odds of improving their microbiome as a results on numeric calculations. I am a trained experienced statistician with appropriate degrees and professional memberships. All suggestions should be reviewed by your medical professional before starting.
The answers above describe my logic and thinking and is not intended to give advice to this person or any one. Always review with your knowledgeable medical professional.
A reader asked why different models to generate suggestions for their microbiome disagreed for a probiotic.
Two primary data sources exist regarding the effects of Bifidobacterium longum subsp. infantis: clinical studies and computational modeling data. I pulled some statistics from my databases.
Two primary data sources exist regarding the effects of Bifidobacterium longum subsp. infantis: clinical studies and computational modeling data.
1. Clinical studies (PubMed):
A total of 34 clinical studies were identified, many of which involved participants with existing medical conditions.
Across these studies, an impact was reported on only 24 bacterial taxa.
Among these, six taxa showed consistent results (replication)
The remaining 18 taxa were each reported as impacted in only a single study, indicating a lack of replication.
Statistical significance in these studies was typically defined as (P < 0.05).
Moreover, each study employed distinct microbiome testing methodologies, contributing to substantial variability—a phenomenon sometimes referred to as the “taxonomy nightmare.”
2. Computational model (R2 Model):
Analysis using the R2 Model (link) identified statistically strong associations between B. longum subsp. infantis and 73 bacterial taxa among healthy individuals.
The statistical significance threshold in this dataset was generally (P < 0.00001),
All samples were processed using a standardized microbiome testing pipeline, eliminating cross-platform variability.
Interpretation: Medical professionals predominantly rely on clinical trial data when evaluating probiotic efficacy, often without critically assessing methodological consistency or statistical robustness. Consequently, computational models such as R2—despite their reproducibility and rigor—are often perceived as opaque or “black box” approaches.
Example: Bacteroides
The following probiotics report different results (i.e. one study report increases, a different study report decreases)
bacillus subtilis {B.Subtilis }
Bifidobacterium animalis {B. animalis}
bifidobacterium longum {B.Longum }
Lacticaseibacillus casei {L. casei}
Lacticaseibacillus paracasei {L.paracasei}
Lacticaseibacillus rhamnosus {l. rhamnosus}
lactobacillus acidophilus {L. acidophilus}
Lactobacillus plantarum {L. plantarum}
Limosilactobacillus fermentum {L. fermentum}
Limosilactobacillus reuteri {L. Reuteri}
Example: Clostridium
The following probiotics report different results (i.e. one study report increases, a different study report decreases)
bacillus subtilis {B.Subtilis }
Bifidobacterium animalis {B. animalis}
bifidobacterium longum {B.Longum }
Heyndrickxia coagulans {B. coagulans}
Lactobacillus plantarum {L. plantarum}
Limosilactobacillus reuteri {L. Reuteri}
Example: Lachnospiraceae
The following probiotics report different results (i.e. one study report increases, a different study report decreases)
One famous story of operations research success during the war involved an analysis of Allied bombers returning from bombing missions over Europe. The military analyzed the location of shrapnel damage and bullet holes in returning bombers, to identify where to place additional armor on aircraft. Operations researchers were brought in at the last minute to do a “confirmatory” analysis, but they recommended that additional armor be placed on bombers everywhere except the places with damage or bullet holes! The operations researchers realized that analyzing damage to returning bombers involved a sampling error. It was the bombers that did not return that needed extra protection—and they needed it in the most vulnerable places (the places not damaged on the returning bombers).
In the past, most medical work has focused on bacterial shifts statistically linked to individual symptoms. Think of the “bullet holes” problem: the literature usually looks at one symptom at a time, while real patients often present with dozens.
Recently, I started using odds ratios instead. Most people know odds ratios from smoking and cancer risk, but they can be applied broadly—for example, the odds of working at Microsoft if you graduated from a particular university.
Using about 5,500 samples and roughly 350 symptoms, I built odds tables and then tested those odds ratios against a reference set of healthy individuals. To my surprise, sample after sample showed the highest odds for being asymptomatic, far more often than I expected.
On reflection, this implies we now have a well-defined, statistically grounded model of a healthy (asymptomatic) microbiome. That was the “lightbulb” moment.
Instead of hunting for individual “holes” and trying to patch them, we should look at all the shifts away from this asymptomatic model. Once those shifts and their contributions (odds ratios) are identified, we can use published research to determine what is most likely to normalize the microbiome. A long list of symptoms (bullet holes) stops being the target; the real target becomes making the microbiome asymptomatic.
After seeing the post Mathematically Derived Healthy Microbiome, a colleague asked me to show the Odds Ratio for Autism – ordered with most significance on top. Autism has many causes with significant literature indicating that some behaviors are associated to some bacteria.
From the samples upload (Ombre, etc) or transferred (Biomesight) to my Citizen Science site (Microbiome Prescription), I computed the following odds ratios in the same manner (percentile based). All of the data that I am using is available for download for other people to explore. The current matrix of Odds ratio is available at Key Bacteria for Symptoms using Percentiles (Lab Agnostic) – R2.
Contribute Your Data
If you have a child or person with ASD, please contribute your microbiome sample and annotated it with symptoms. The Odds tables are planned to be recomputed every 6 months as data increases.
We are currently using the annotations below, the table below used “Official Diagnosis: Autism” :
Autism: More Unusual Responses to an Unexpected Event
Autism: More Abnormal Body Posturing or Facial Expressions
Autism: More Abnormal Tone of Voice
Autism: More Avoidance of Eye Contact or Poor Eye Contact
Autism: More Behavioral Disturbances
Autism: More deficits in Language Comprehension
Autism: More Decrease in Speaking
Autism: More Inappropriate Social Interaction
Autism: More Intense Focus on One Topic
Autism: More Lack of Empathy
Autism: More Flat or Monotonous Speech
Autism: More Repeating Words or Phrases
Autism: More Repetitive Movements
Autism: More Self-Abusive Behaviors
Autism: More Sleep Disturbances
Autism: Less Unusual Responses to an Unexpected Event
Autism: Less Abnormal Body Posturing or Facial Expressions
Autism: Less Abnormal Tone of Voice
Autism: Less Avoidance of Eye Contact or Poor Eye Contact
Autism: Less Behavioral Disturbances
Autism: Less deficits in Language Comprehension
Autism: Less Decrease in Speaking
Autism: Less Inappropriate Social Interaction
Autism: Less Intense Focus on One Topic
Autism: Less Lack of Empathy
Autism: Less Flat or Monotonous Speech
Autism: Less Repeating Words or Phrases
Autism: Less Repetitive Movements
Autism: Less Self-Abusive Behaviors
Autism: Less Sleep Disturbances
Autism: High Functioning
Autism: Spectrum (not full)
Usage: This is based on multiple labs using percentiles to compensate for their processing differences. Your lab may not report on some of the bacteria — if not reported, ignore.
Tax_Name
Tax_Rank
Increased Odds of Autism
Mediterraneibacter gnavus
species
Above 18.2609 %ile
Phocaeicola plebeius
species
Above 11.9622 %ile
Dorea longicatena
species
Below 12.1069 %ile
Segatella
genus
Above 18.4336 %ile
Halomonadaceae
family
Above 7.377 %ile
Bacteroides nordii
species
Above 17.6211 %ile
Acidaminobacter
genus
Above 6.015 %ile
Segatella copri
species
Above 17.6471 %ile
Erysipelatoclostridium
genus
Below 15.7082 %ile
Ruminococcus albus
species
Above 20.1852 %ile
Ruminococcus
genus
Above 18.808 %ile
Oscillibacter
genus
Below 13.1897 %ile
Spirosomataceae
family
Above 7.5362 %ile
Acidaminobacter hydrogenoformans
species
Above 5.5138 %ile
Rikenellaceae
family
Below 13.1509 %ile
Microcoleaceae
family
Above 8.9855 %ile
Campylobacterales
order
Above 6.4151 %ile
Limosilactobacillus fermentum
species
Above 2.7523 %ile
Caldilineae
class
Above 15.1111 %ile
Caldilineales
order
Above 15.1111 %ile
Paraprevotella
genus
Above 16 %ile
Caldilineaceae
family
Above 15.1786 %ile
Desulfotomaculaceae
family
Above 10.6448 %ile
Thermoclostridium
genus
Above 0.3236 %ile
Slackia
genus
Above 0.4184 %ile
Liquorilactobacillus
genus
Above 19.6721 %ile
Epsilonproteobacteria
class
Above 9.7804 %ile
Hespellia
genus
Below 11.8474 %ile
Cytophagaceae
family
Above 13.3333 %ile
Mollicutes
class
Above 16.3636 %ile
Phascolarctobacterium succinatutens
species
Above 1.1628 %ile
Ruminiclostridium
genus
Above 15.7895 %ile
Mediterraneibacter
genus
Above 18.8889 %ile
Alistipes finegoldii
species
Below 13.5572 %ile
Mycoplasmatota
phylum
Above 15.7576 %ile
Campylobacterota
phylum
Above 10.9434 %ile
Acetivibrio
genus
Above 17.7227 %ile
Rhodocyclaceae
family
Above 5.8824 %ile
Bacteroides graminisolvens
species
Above 15.5637 %ile
Blautia luti
species
Below 19.1045 %ile
Moraxellales
order
Above 10 %ile
Bacteroides intestinalis
species
Above 14.4105 %ile
Ruminococcus bromii
species
Above 21.6477 %ile
Subdoligranulum variabile
species
Below 19.68 %ile
Erysipelotrichaceae
family
Below 7.1149 %ile
Sporobacter
genus
Below 10.4876 %ile
Moraxellaceae
family
Above 8.5389 %ile
Phocaeicola coprocola
species
Above 17.8068 %ile
Streptomyces
genus
Above 4.7619 %ile
Oribacterium
genus
Above 21.5398 %ile
Ruminococcus callidus
species
Above 19.5072 %ile
Bacteroides xylanisolvens
species
Above 16.1884 %ile
Phocaeicola salanitronis
species
Above 12.2807 %ile
Anaeroplasmataceae
family
Above 22.2222 %ile
Anaeroplasmatales
order
Above 21.875 %ile
Flavonifractor plautii
species
Below 18.4022 %ile
Phascolarctobacterium faecium
species
Above 0.5482 %ile
Oscillatoriales
order
Above 17.4962 %ile
Chromatiales
order
Above 9.2994 %ile
Mogibacterium timidum
species
Above 16.4659 %ile
Butyrivibrio proteoclasticus
species
Below 64.8889 %ile
Fusicatenibacter
genus
Below 23.7641 %ile
Oxalobacter
genus
Above 4.6875 %ile
Flavonifractor
genus
Below 14.7527 %ile
Microbacterium
genus
Above 9.8655 %ile
Catenibacterium
genus
Above 1.7241 %ile
Rhodocyclales
order
Above 7.1429 %ile
Alkalithermobacter thermoalcaliphilus
species
Above 15.8345 %ile
Erwiniaceae
family
Above 10.0437 %ile
Marvinbryantia
genus
Below 12.4525 %ile
Blautia faecis
species
Below 22.905 %ile
Leuconostocaceae
family
Above 20.868 %ile
Papillibacter
genus
Below 14.9367 %ile
Bacillales incertae sedis
no rank
Above 14.2752 %ile
Dehalococcoidia
class
Above 5.9406 %ile
Bifidobacterium pullorum
species
Above 17.7914 %ile
Thomasclavelia
genus
Below 14.4953 %ile
Pseudomonas
genus
Above 15.6522 %ile
Opitutia
class
Above 4.4444 %ile
Lactonifactor
genus
Below 14.891 %ile
Bacteroides stercoris
species
Above 16.6144 %ile
Dialister invisus
species
Above 1.2915 %ile
Catonella
genus
Above 21.3216 %ile
Megasphaera
genus
Above 3.8685 %ile
Myxococcia
class
Above 1.4011 %ile
Myxococcales
order
Above 1.4011 %ile
Myxococcota
phylum
Above 1.4011 %ile
Pseudomonadaceae
family
Above 15.6522 %ile
Hyphomonadaceae
family
Above 38.3387 %ile
Alistipes
genus
Below 13.8175 %ile
Limosilactobacillus
genus
Above 19.2529 %ile
Anaerosporobacter
genus
Below 21.1679 %ile
Kiloniellaceae
family
Above 2.7586 %ile
Nostocales
order
Above 2.008 %ile
[Ruminococcus] lactaris
species
Below 71.3383 %ile
Lactobacillus iners
species
Above 13.8614 %ile
Peptostreptococcus anaerobius
species
Above 1.4493 %ile
Luteibacter anthropi
species
Below 72.4754 %ile
Archaea
superkingdom
Above 2.8571 %ile
Intestinimonas
genus
Below 15.1786 %ile
Odoribacter laneus
species
Below 64.1221 %ile
Campylobacteraceae
family
Above 13.0536 %ile
Actinomycetota
phylum
Above 9.7956 %ile
Sphingomonadales
order
Above 17.3913 %ile
Finegoldia
genus
Above 14.8472 %ile
Fusobacterium nucleatum
species
Above 0.4831 %ile
Methanobrevibacter
genus
Above 2.8037 %ile
Sphingobacterium
genus
Above 0.7639 %ile
Rhodobacterales
order
Above 25.9259 %ile
Thalassospiraceae
family
Above 3.352 %ile
Desulforamulus
genus
Above 0 %ile
Intestinibacter
genus
Below 30.7692 %ile
unclassified Clostridiales
family
Below 21.5559 %ile
Sphingobacteriaceae
family
Above 9.8826 %ile
Euryarchaeota
phylum
Above 2.6432 %ile
Shuttleworthella
genus
Above 21.4575 %ile
Sphingobacteriia
class
Above 9.9902 %ile
Sphingobacteriales
order
Above 9.9902 %ile
Hoylesella
genus
Above 18.541 %ile
Thiotrichaceae
family
Below 75.077 %ile
Gemella
genus
Above 9.4512 %ile
Syntrophomonas
genus
Above 17.9842 %ile
Bifidobacterium pseudocatenulatum
species
Above 13.4831 %ile
Oscillospira
genus
Below 6.1783 %ile
Blautia obeum
species
Above 19.6197 %ile
Porphyromonas asaccharolytica
species
Above 0.7843 %ile
Eubacteriaceae
family
Above 17.632 %ile
Lachnobacterium
genus
Above 15.0525 %ile
Oscillatoriophycideae
subclass
Above 6.9444 %ile
Parasutterella
genus
Below 19.2101 %ile
Methanobacteria
class
Above 2.8112 %ile
Campylobacter
genus
Above 13.3588 %ile
Thiotrichales
order
Above 1.0707 %ile
Bifidobacterium animalis
species
Below 34.058 %ile
Nocardioidaceae
family
Above 25 %ile
Coprococcus
genus
Above 18.905 %ile
Cyanophyceae
class
Above 12.3288 %ile
Dorea formicigenerans
species
Below 7.2871 %ile
Streptosporangiales
order
Above 7.2072 %ile
Anaerofilum
genus
Above 10.9091 %ile
Alistipes putredinis
species
Below 19.8198 %ile
Prevotella disiens
species
Above 4.7782 %ile
Methanobacteriaceae
family
Above 2.8689 %ile
Methanobacteriales
order
Above 2.8689 %ile
Catonella morbi
species
Above 19.6413 %ile
Fusobacteriaceae
family
Above 10.978 %ile
Butyricimonas synergistica
species
Below 44.385 %ile
Acetivibrio straminisolvens
species
Below 69.1722 %ile
Desulfitobacteriaceae
family
Above 11.0647 %ile
Sphingomonadaceae
family
Above 14.7826 %ile
Coprococcus eutactus
species
Above 21.8324 %ile
Proteus
genus
Above 1.626 %ile
Ralstonia
genus
Above 19.214 %ile
Slackia heliotrinireducens
species
Above 9.0498 %ile
Dialister
genus
Above 0.8889 %ile
Erysipelotrichia
class
Below 6.7775 %ile
Erysipelotrichales
order
Below 6.7775 %ile
Holdemania filiformis
species
Below 22.4044 %ile
Haemophilus parainfluenzae
species
Above 3.6927 %ile
Actinomycetaceae
family
Above 0.4348 %ile
Turicibacter sanguinis
species
Above 0.6925 %ile
Fusicatenibacter saccharivorans
species
Below 23.9819 %ile
Bacteroides clarus
species
Above 12.8788 %ile
Bacillaceae
family
Above 13.4783 %ile
Methanomada group
clade
Above 2.8112 %ile
Cytophagia
class
Above 15.7842 %ile
Cytophagales
order
Above 15.7842 %ile
Phocaeicola
genus
Below 8.5865 %ile
Leuconostoc
genus
Above 16.9725 %ile
Parvimonas
genus
Above 23.6842 %ile
Selenomonadaceae
family
Above 0.4348 %ile
Amedibacillus dolichus
species
Above 3.3113 %ile
Caulobacteraceae
family
Below 50.2994 %ile
Amedibacillus
genus
Above 3.3113 %ile
Desulfohalotomaculum
genus
Above 43.3912 %ile
Gemellaceae
family
Above 9.4512 %ile
Hyphomonadales
order
Above 47.2843 %ile
Azoarcus
genus
Above 15.3846 %ile
Entomoplasmatales
order
Above 13.0693 %ile
Azospirillum
genus
Above 9.7778 %ile
Haemophilus
genus
Above 3.9924 %ile
Cellvibrionales
order
Above 7.5221 %ile
Halochromatium
genus
Above 2.9703 %ile
Bacteroides fragilis
species
Above 2.8061 %ile
Methanobrevibacter smithii
species
Above 3.3816 %ile
Catenibacterium mitsuokai
species
Above 17.7419 %ile
Slackia isoflavoniconvertens
species
Above 22.1662 %ile
Mycoplasma
genus
Above 14.6054 %ile
Thermoclostridium caenicola
species
Below 77.4232 %ile
Azospirillaceae
family
Above 2.7027 %ile
Enterococcaceae
family
Above 1.4286 %ile
Desulfitobacterium
genus
Below 24.6575 %ile
Parasutterella excrementihominis
species
Below 20.5943 %ile
Eubacterium
genus
Above 17.9028 %ile
Moorellales
order
Below 82.1855 %ile
Balneola
genus
Above 10.1695 %ile
Alkaliphilus
genus
Above 3.7152 %ile
Acetivibrio alkalicellulosi
species
Above 16.1781 %ile
Fusobacteriales
order
Above 13.2867 %ile
Blautia wexlerae
species
Below 9.2321 %ile
Pseudoramibacter
genus
Below 64.5833 %ile
Weissella
genus
Above 13.3333 %ile
Acidaminococcus
genus
Above 10.6489 %ile
Fusobacteriia
class
Above 13.2867 %ile
Tepidibacter
genus
Below 65.4206 %ile
Psychrobacter glacialis
species
Above 0 %ile
Veillonella dispar
species
Above 12.6816 %ile
Bacteroides cellulosilyticus
species
Above 16.8103 %ile
Negativicoccus
genus
Above 8.7805 %ile
Actinobacillus porcinus
species
Below 74.971 %ile
Chitinophagaceae
family
Above 15.565 %ile
Chitinophagia
class
Above 15.032 %ile
Chitinophagales
order
Above 15.032 %ile
Cyanobacteriota
phylum
Above 13.5965 %ile
Planifilum fimeticola
species
Below 82.4012 %ile
Clostridium perfringens
species
Above 7.6923 %ile
Bacteroides salyersiae
species
Above 11.583 %ile
Parabacteroides johnsonii
species
Above 2.8571 %ile
Syntrophomonadaceae
family
Above 5.7348 %ile
Mycoplasmataceae
family
Above 15.814 %ile
Alistipes shahii
species
Below 8.6694 %ile
Cystobacterineae
suborder
Above 5.6338 %ile
Succinivibrio
genus
Below 54.6053 %ile
Moryella
genus
Below 21.0046 %ile
Parvimonas micra
species
Above 25 %ile
Bacteroides rodentium
species
Above 17.799 %ile
Succinivibrio dextrinosolvens
species
Below 52.6786 %ile
Brochothrix thermosphacta
species
Below 77.5635 %ile
Bifidobacteriaceae
family
Above 7.0069 %ile
Bifidobacteriales
order
Above 6.9565 %ile
Brochothrix
genus
Above 5.2632 %ile
Fusobacterium
genus
Above 9.7345 %ile
Tissierellia
class
Below 3.0928 %ile
Novispirillum
genus
Below 81.6863 %ile
Mannheimia
genus
Below 66.2442 %ile
Blautia glucerasea
species
Above 14.2222 %ile
Fusobacteriota
phylum
Above 13.1944 %ile
Desulfofarcimen
genus
Above 25.0965 %ile
Tindallia magadiensis
species
Below 89.2784 %ile
Desulfurispora thermophila
species
Above 11.4504 %ile
Acidaminococcus fermentans
species
Below 56.3139 %ile
Pectobacteriaceae
family
Above 30.531 %ile
Mycoplasmatales
order
Above 14.9425 %ile
Paraprevotella clara
species
Above 3.7736 %ile
Desulfurisporaceae
family
Above 11.2805 %ile
Desulfurispora
genus
Above 11.2805 %ile
Lelliottia
genus
Above 0 %ile
Oxalobacter formigenes
species
Above 4.5016 %ile
Terrisporobacter
genus
Below 24.9482 %ile
Caloramator indicus
species
Below 49.9016 %ile
Ignavibacteriota
phylum
Above 61.7766 %ile
Odoribacter splanchnicus
species
Below 14.0381 %ile
Symbiobacterium
genus
Below 77.561 %ile
Anaerotruncus colihominis
species
Above 16.0959 %ile
Microbacteriaceae
family
Above 23.1441 %ile
Nevskiaceae
family
Below 81.761 %ile
Peptococcus niger
species
Above 6.6667 %ile
Bifidobacterium ruminantium
species
Above 17.8862 %ile
Streptococcus anginosus
species
Above 10.4683 %ile
Dysgonomonas
genus
Above 10.4478 %ile
Parabacteroides goldsteinii
species
Above 8.9385 %ile
Coprobacter
genus
Below 13.4328 %ile
Acholeplasma hippikon
species
Above 6.1644 %ile
Cyanobacteriota/Melainabacteria group
clade
Above 13.5135 %ile
Tissierellia incertae sedis
no rank
Above 12.1242 %ile
Hallella
genus
Above 11.1888 %ile
Rhodospirillaceae
family
Above 1.6726 %ile
Halomonas
genus
Above 29.5673 %ile
Lysobacterales
order
Above 6.9565 %ile
Bacteroides gallinarum
species
Above 14.6222 %ile
Anaerococcus
genus
Above 0.2985 %ile
Desulfovibrio piger
species
Above 7.1429 %ile
Clostridium putrefaciens
species
Above 37.2294 %ile
Facklamia
genus
Above 65.4525 %ile
Brenneria
genus
Above 31.5927 %ile
Blautia hydrogenotrophica
species
Above 20.7045 %ile
Alkaliphilus peptidifermentans
species
Above 50 %ile
Segatella albensis
species
Above 20.9738 %ile
Kribbella
genus
Above 25 %ile
Dysgonomonadaceae
family
Above 10.8497 %ile
Actinomyces
genus
Above 0.8811 %ile
Sphingomonas
genus
Above 20.9821 %ile
Rothia mucilaginosa
species
Above 6.8493 %ile
Selenomonas
genus
Below 75.154 %ile
Acidimicrobiia
class
Above 24.8434 %ile
Rothia
genus
Above 13.8614 %ile
Caldicellulosiruptor
genus
Below 71.5325 %ile
Coprococcus catus
species
Above 20.9663 %ile
Acidimicrobiales
order
Above 24.8434 %ile
Pseudomonadales
order
Above 10 %ile
Holophagaceae
family
Above 11.46 %ile
Geothrix
genus
Above 11.7002 %ile
Butyricimonas virosa
species
Above 6.2366 %ile
Mycoplasmoidales
order
Above 1.8242 %ile
Holophagales
order
Above 11.8196 %ile
Clostridium frigoris
species
Above 3.2216 %ile
Thermodesulfobacteriota
phylum
Above 0.0907 %ile
Halanaerobiales
order
Above 22.0503 %ile
Bifidobacterium angulatum
species
Above 62.8713 %ile
Aeromonadales
order
Above 9.6916 %ile
Desulfofarcimen acetoxidans
species
Above 15.7895 %ile
Kribbellaceae
family
Above 25 %ile
Bifidobacterium
genus
Above 5.9083 %ile
Varibaculum
genus
Above 5.814 %ile
Peptoniphilus lacrimalis
species
Above 7.362 %ile
Geothrix fermentans
species
Above 15.8965 %ile
Ignavibacteria
class
Above 64.4684 %ile
Holophagae
class
Above 11.5899 %ile
Filifactor
genus
Above 10.1299 %ile
Jonesiaceae
family
Above 13.4831 %ile
Oxalobacteraceae
family
Above 0.7782 %ile
Jonesia
genus
Above 16.8539 %ile
Caloramator
genus
Above 12.8554 %ile
Coriobacteriales
order
Above 9.8845 %ile
Actinomycetes
class
Above 9.2105 %ile
Streptococcus
genus
Above 8.3879 %ile
Peptostreptococcaceae incertae sedis
no rank
Above 0.6667 %ile
Eubacteriales incertae sedis
no rank
Above 0 %ile
Ignavibacteriales
order
Above 67.0256 %ile
Anaerococcus vaginalis
species
Above 16.3934 %ile
Luteibacter
genus
Below 71.123 %ile
Campylobacter ureolyticus
species
Above 3.0769 %ile
Chromatiaceae
family
Above 0 %ile
Synergistaceae
family
Above 5.8824 %ile
Sporomusaceae
family
Above 6.7227 %ile
Comamonadaceae
family
Above 0.4348 %ile
Paenibacillus
genus
Above 13.1004 %ile
Caldicellulosiruptoraceae
family
Below 71.5325 %ile
Caldicellulosiruptorales
order
Below 71.5325 %ile
Alteromonadales
order
Above 6.1135 %ile
Oribacterium sinus
species
Above 19.4444 %ile
Ethanoligenens harbinense
species
Above 50.4541 %ile
Thermoactinomycetaceae
family
Above 9.5097 %ile
Anaerofustis stercorihominis
species
Above 38.6449 %ile
Eubacteriales Family XII. Incertae Sedis
family
Above 2.0528 %ile
Fibrobacterota
phylum
Above 1.0753 %ile
Phocaeicola coprophilus
species
Above 29.3286 %ile
Clostridium intestinale
species
Above 73.8625 %ile
Thermoanaerobacterales
order
Above 2.7397 %ile
Hymenobacteraceae
family
Below 70.5882 %ile
Bacteroides stercorirosoris
species
Below 75.1353 %ile
Piscirickettsiaceae
family
Above 12.4339 %ile
Anaerofustis
genus
Above 36.3409 %ile
Schaalia
genus
Above 0.3974 %ile
Niabella
genus
Above 19.977 %ile
Sporotomaculum hydroxybenzoicum
species
Above 21.3542 %ile
Coriobacteriaceae
family
Above 9.8845 %ile
Enterorhabdus
genus
Below 12.9278 %ile
Bacteroides reticulotermitis
species
Above 89.5652 %ile
Gordonibacter
genus
Below 14.9123 %ile
Anaerobranca
genus
Above 0.8 %ile
Turicibacter
genus
Above 6.7941 %ile
Hyphomicrobiales
order
Above 8.2609 %ile
Romboutsia ilealis
species
Above 34.0909 %ile
Desulfobacteraceae
family
Above 25.9312 %ile
Furfurilactobacillus
genus
Above 8.6957 %ile
Acetitomaculum
genus
Above 25 %ile
Mobiluncus
genus
Above 23.7569 %ile
Micrococcaceae
family
Above 14.2857 %ile
Bacillus
genus
Above 7.2581 %ile
Oceanospirillales
order
Above 11.4537 %ile
Desulfobacterales
order
Above 26.9333 %ile
Caulobacterales
order
Below 48.9641 %ile
Ruminococcus flavefaciens
species
Above 46.0116 %ile
Ethanoligenens
genus
Above 25.8193 %ile
Acetivibrio clariflavus
species
Above 13.9151 %ile
Bifidobacterium indicum
species
Above 10.7143 %ile
Streptococcaceae
family
Above 8.2902 %ile
Candidatus Soleaferrea
genus
Below 45.3465 %ile
Bacteroides helcogenes
species
Above 34.5133 %ile
Streptococcus sanguinis
species
Above 13.4211 %ile
Alistipes indistinctus
species
Above 53.0568 %ile
Peptostreptococcus
genus
Above 12.3636 %ile
Furfurilactobacillus siliginis
species
Above 20 %ile
Phocaeicola vulgatus
species
Below 7.2567 %ile
Propionibacteriales
order
Above 31.7391 %ile
Eisenbergiella tayi
species
Below 19.2009 %ile
Metamycoplasmataceae
family
Above 1.8622 %ile
Adlercreutzia equolifaciens
species
Above 3.2319 %ile
Turicibacteraceae
family
Above 6.7941 %ile
Coprobacillus
genus
Above 9.8039 %ile
Atopobium
genus
Above 18.5567 %ile
Thiohalobacter
genus
Above 29.4118 %ile
Blautia hansenii
species
Above 11.9804 %ile
Streptococcus anginosus group
species group
Above 10.7595 %ile
Lysobacteraceae
family
Above 3.913 %ile
Shigella
genus
Above 46.5517 %ile
Akkermansia muciniphila
species
Above 5.5556 %ile
Bacillales Family X. Incertae Sedis
family
Above 10.1538 %ile
Roseburia intestinalis
species
Above 9.0909 %ile
Cyclobacteriaceae
family
Above 29.0323 %ile
Nevskiales
order
Below 76.0638 %ile
Ehrlichia ovina
species
Below 62.1113 %ile
Terrabacteria group
clade
Above 10.1363 %ile
Pseudomonadota
phylum
Above 9.9365 %ile
Chloroflexota
phylum
Above 13.0491 %ile
Peptostreptococcaceae
family
Above 8.982 %ile
[Ruminococcus] torques
species
Above 21.6405 %ile
Nitrospirales
order
Above 25 %ile
Rhodospirillales
order
Above 2.8415 %ile
Subdoligranulum
genus
Below 20 %ile
Thiothrix
genus
Below 75.0602 %ile
Planifilum
genus
Below 80.1641 %ile
Nitrospiraceae
family
Above 18.9655 %ile
Acidimicrobiaceae
family
Above 22.5806 %ile
Porphyromonas
genus
Above 13.3333 %ile
Nitrospirota
phylum
Above 25 %ile
Bacteroides caccae
species
Above 4.7619 %ile
Johnsonella
genus
Above 13.5845 %ile
Thiohalobacter thiocyanaticus
species
Above 29.4118 %ile
Streptococcus parasanguinis
species
Above 9.0129 %ile
Sutterella stercoricanis
species
Above 10.1669 %ile
Lentisphaerota
phylum
Above 28.3688 %ile
Selenomonadales
order
Above 4.8902 %ile
Nitrospiria
class
Above 25 %ile
Robinsoniella
genus
Above 13.8554 %ile
Paenibacillaceae
family
Above 7.8603 %ile
Betaproteobacteria
class
Above 9.0039 %ile
Thermoanaerobacterium
genus
Above 33.8028 %ile
Veillonella
genus
Above 5.5736 %ile
Phocaeicola sartorii
species
Above 15.1724 %ile
Prevotella veroralis
species
Above 25 %ile
Halobacteroidaceae
family
Above 41.573 %ile
Rhodovibrionaceae
family
Above 17.7616 %ile
Nocardiopsaceae
family
Above 37.8917 %ile
Tessaracoccus
genus
Above 22.1675 %ile
Thiobacillus thiophilus
species
Above 21.7317 %ile
Negativicoccus succinicivorans
species
Above 8.6842 %ile
Hungateiclostridium
genus
Above 37.8815 %ile
unclassified Burkholderiales
family
Above 20.3488 %ile
Proteinivoraceae
family
Above 4.1509 %ile
Paucilactobacillus
genus
Above 24.2915 %ile
Synergistia
class
Above 4.2553 %ile
Synergistales
order
Above 4.2553 %ile
Leuconostoc miyukkimchii
species
Above 46.3768 %ile
Bifidobacterium catenulatum
species
Above 70.1105 %ile
Synergistota
phylum
Above 4.2553 %ile
Flavobacterium
genus
Above 25 %ile
Lentisphaeria
class
Above 24.1135 %ile
Finegoldia magna
species
Above 7.4468 %ile
Gallionellaceae
family
Above 30.8458 %ile
[Clostridium] scindens
species
Above 68.559 %ile
Victivallales
order
Above 25.8567 %ile
Thiobacillus
genus
Above 47.0588 %ile
Morganellaceae
family
Above 16.3717 %ile
Bifidobacterium breve
species
Above 9.6916 %ile
Hungateiclostridiaceae
family
Above 40 %ile
Acetitomaculum ruminis
species
Above 23.5149 %ile
Phocaeicola massiliensis
species
Above 14.2857 %ile
Segatella maculosa
species
Above 1.4981 %ile
Dialister propionicifaciens
species
Above 29.4931 %ile
Clostridium chartatabidum
species
Above 32.4627 %ile
Veillonellales
order
Above 8.8109 %ile
Prevotella corporis
species
Above 9.3949 %ile
Holdemanella biformis
species
Above 10.0539 %ile
Veillonellaceae
family
Above 8.7719 %ile
Pseudobutyrivibrio
genus
Below 7.5397 %ile
Slackia piriformis
species
Above 25.266 %ile
Desulfobacteria
class
Above 26.9333 %ile
Holdemanella
genus
Above 9.6774 %ile
Bifidobacterium bombi
species
Above 35.7143 %ile
Moryella indoligenes
species
Above 64.66 %ile
Moraxella
genus
Above 22.8155 %ile
Bacteroides eggerthii
species
Above 12.9412 %ile
Niabella aurantiaca
species
Above 18.9918 %ile
Pelotomaculum
genus
Below 28.5248 %ile
Marinilabiliales
order
Above 63.5097 %ile
Enterobacterales
order
Above 1.8487 %ile
Ruminococcus champanellensis
species
Above 68.5841 %ile
Tissierellaceae
family
Above 35.6455 %ile
Balneolia
class
Above 57.1865 %ile
Intestinimonas butyriciproducens
species
Above 62.4101 %ile
Pseudoclavibacter
genus
Above 56.8182 %ile
Enterocloster
genus
Above 67.8604 %ile
Leyella
genus
Above 5.5205 %ile
Leyella stercorea
species
Above 5.5205 %ile
Blautia producta
species
Above 20.3704 %ile
canis group
species group
Below 33.3333 %ile
Hungatella
genus
Above 68.6275 %ile
Gammaproteobacteria
class
Above 8.6043 %ile
Enterobacteriaceae
family
Above 5.6522 %ile
Pedobacter
genus
Above 3.6364 %ile
Lactococcus
genus
Above 8.8803 %ile
Acidobacteriota
phylum
Above 11.1607 %ile
Thiobacillaceae
family
Above 47.0588 %ile
Sarcina
genus
Above 10.3175 %ile
Bacteroides fluxus
species
Above 8.7912 %ile
Robinsoniella peoriensis
species
Above 17.1082 %ile
Planococcaceae
family
Above 15.7895 %ile
Porphyromonas bennonis
species
Above 14.0684 %ile
Nostoc
genus
Above 20 %ile
Hoylesella buccalis
species
Above 7.5397 %ile
Balneolota
phylum
Above 50 %ile
Burkholderiales
order
Above 8.4815 %ile
Shigella dysenteriae
species
Above 46.0526 %ile
Balneolaceae
family
Above 61.2308 %ile
Clostridium kluyveri
species
Above 26.5306 %ile
Filifactor alocis
species
Above 16.3743 %ile
Anaerocolumna
genus
Above 70.852 %ile
Bacteroides uniformis
species
Below 5.7624 %ile
Verrucomicrobiota
phylum
Above 3.3663 %ile
Propionibacteriaceae
family
Above 34.657 %ile
Melioribacter roseus
species
Above 81.5172 %ile
Desulfobacterium
genus
Above 39.9329 %ile
Alloprevotella rava
species
Below 41.3699 %ile
Stella
genus
Above 24.4635 %ile
Johnsonella ignava
species
Above 13.3102 %ile
Marinilabiliaceae
family
Above 63.7987 %ile
Bifidobacterium thermacidophilum
species
Above 28.1579 %ile
Dolosigranulum pigrum
species
Above 30.9353 %ile
Anaerostipes caccae
species
Above 77.6586 %ile
Lachnospira
genus
Above 7.6068 %ile
[Eubacterium] siraeum
species
Above 71.5867 %ile
Streptococcus constellatus
species
Above 52.4476 %ile
Christensenella
genus
Above 27.3743 %ile
Senegalimassilia
genus
Above 21.4953 %ile
Bifidobacterium catenulatum PV20-2
strain
Above 89.0383 %ile
Ehrlichia
genus
Below 25 %ile
Blautia schinkii
species
Above 12.035 %ile
Pelotomaculum isophthalicicum
species
Below 28.5901 %ile
Paracholeplasma
genus
Above 79.1118 %ile
Pelosinus
genus
Above 36.1905 %ile
Coprobacillus cateniformis
species
Above 5.99 %ile
Micrococcales
order
Above 8.2609 %ile
Porphyromonas canis
species
Below 73.925 %ile
Dysgonomonas capnocytophagoides
species
Above 36.8902 %ile
Lactobacillus
genus
Above 3.4783 %ile
Dolosigranulum
genus
Above 31.8898 %ile
Spiroplasmataceae
family
Above 53.5792 %ile
Lacrimispora
genus
Above 33.0396 %ile
Dorea
genus
Below 5.3787 %ile
Propionispora
genus
Below 71.0744 %ile
Sporobacterium
genus
Above 85.8099 %ile
Balneolales
order
Above 56.8807 %ile
Bifidobacterium gallicum
species
Above 90.3963 %ile
Spiroplasma
genus
Above 51.6269 %ile
Thermicanus aegyptius
species
Above 78.268 %ile
Cellulosilyticum
genus
Above 75 %ile
Anaeroglobus geminatus
species
Above 82.1138 %ile
Prevotellaceae
family
Above 5.9783 %ile
Anaerostipes
genus
Above 10.0086 %ile
Anaeroglobus
genus
Above 81.3312 %ile
Anaeromyxobacter
genus
Above 54.0816 %ile
Collinsella
genus
Above 10.2865 %ile
Lactonifactor longoviformis
species
Above 63.6142 %ile
Lachnospira pectinoschiza
species
Above 5.41 %ile
Phocaeicola barnesiae
species
Above 65.69 %ile
Anaeromyxobacteraceae
family
Above 53.8776 %ile
Christensenellaceae
family
Above 26.6667 %ile
Lactobacillales
order
Above 9.333 %ile
Bifidobacterium cuniculi
species
Above 79.5343 %ile
Ezakiella
genus
Above 44.3787 %ile
Parascardovia
genus
Above 50 %ile
Viridibacillus
genus
Above 52.381 %ile
Desulfotomaculum
genus
Above 10.8359 %ile
Tolumonas auensis
species
Above 50.0958 %ile
Tolumonas
genus
Above 49.8102 %ile
Paraburkholderia phenoliruptrix
species
Above 50.7444 %ile
Synechococcales
order
Above 43.1111 %ile
Herbinix
genus
Above 45.8613 %ile
Bifidobacterium mongoliense
species
Above 72.963 %ile
Lawsonia intracellularis
species
Above 62.7737 %ile
Bifidobacterium dentium
species
Above 69.9454 %ile
Paraburkholderia
genus
Above 50.885 %ile
Roseburia hominis
species
Above 68.4211 %ile
Parabacteroides faecis
species
Above 70.6278 %ile
Aerococcaceae
family
Above 15.7658 %ile
Clostridium bornimense
species
Above 52.9825 %ile
Desulfocella
genus
Above 72.2063 %ile
Stomatobaculum longum
species
Above 58.5603 %ile
Bacteroidaceae
family
Below 6.1279 %ile
Bacteroides thetaiotaomicron
species
Above 8.0824 %ile
Melioribacter
genus
Above 80.9524 %ile
Melioribacteraceae
family
Above 73.4694 %ile
Lawsonia
genus
Above 63.7993 %ile
[Clostridium] innocuum
species
Above 64.8961 %ile
Terriglobia
class
Above 12.1622 %ile
Hoylesella timonensis
species
Above 15.1261 %ile
Acholeplasmataceae
family
Above 7.6923 %ile
Burkholderia
genus
Above 56.7568 %ile
Paracholeplasma vituli
species
Above 80.298 %ile
Blautia
genus
Below 6.242 %ile
Caloramator uzoniensis
species
Below 33.1201 %ile
Lachnoclostridium phytofermentans
species
Above 50 %ile
[Bacteroides] pectinophilus
species
Above 65.0641 %ile
Anaerovibrio lipolyticus
species
Below 47.1154 %ile
Bifidobacterium magnum
species
Above 64.2308 %ile
Bacteroidota/Chlorobiota group
clade
Above 10.0509 %ile
Sporosarcina
genus
Above 34.1889 %ile
Hathewaya proteolytica
species
Above 54.0616 %ile
Alicyclobacillaceae
family
Above 47.2689 %ile
Acholeplasma
genus
Above 7.2816 %ile
Roseburia
genus
Above 9.4187 %ile
Hathewaya histolytica
species
Below 51.6193 %ile
Caloramator mitchellensis
species
Below 81.2403 %ile
Bifidobacterium boum
species
Above 57.9041 %ile
Collinsella aerofaciens
species
Above 4.329 %ile
Anaplasmataceae
family
Below 12.4088 %ile
Sporobacterium olearium
species
Above 84.1248 %ile
Hespellia stercorisuis
species
Above 88.634 %ile
Terrisporobacter petrolearius
species
Above 82.1981 %ile
Thiomonas thermosulfata
species
Above 54.5358 %ile
Bacteroides denticanum
species
Above 92.336 %ile
Bifidobacterium scardovii
species
Above 33.3333 %ile
Oscillospira guilliermondii
species
Below 59.8165 %ile
Lactobacillaceae
family
Above 6.5217 %ile
Sporolactobacillus putidus
species
Above 84.2342 %ile
Chlorobiia
class
Below 71.5658 %ile
Atopobiaceae
family
Above 17.8974 %ile
Chlorobiaceae
family
Below 71.624 %ile
Blautia coccoides
species
Below 69.1216 %ile
Chlorobiota
phylum
Below 71.5367 %ile
Anoxynatronum sibiricum
species
Above 55.1773 %ile
Rhodothermus clarus
species
Below 64.2594 %ile
Candidatus Amoebophilus
genus
Below 5.216 %ile
Candidatus Amoebophilus asiaticus
species
Below 5.216 %ile
Anoxynatronum
genus
Above 54.8936 %ile
Stomatobaculum
genus
Above 57.1429 %ile
Pseudobutyrivibrio xylanivorans
species
Below 6.4199 %ile
Anaerovibrio
genus
Below 44.4533 %ile
Entomoplasmataceae
family
Above 69.2719 %ile
Chlorobiales
order
Below 71.8823 %ile
Hungatella hathewayi
species
Above 63.9344 %ile
Desulfofalx
genus
Above 73.865 %ile
Desulfofalx alkaliphila
species
Above 73.865 %ile
Sporolactobacillus
genus
Above 68.4685 %ile
Geopsychrobacteraceae
family
Above 67.4395 %ile
Amoebophilaceae
family
Below 5.216 %ile
Desulfuromusa
genus
Above 67.4395 %ile
Anaerotignum
genus
Above 72.6027 %ile
Guggenheimella bovis
species
Above 69.7337 %ile
Bifidobacterium catenulatum subsp. kashiwanohense
subspecies
Above 62.2426 %ile
Erysipelothrix
genus
Above 9.2072 %ile
Pseudoclostridium
genus
Below 35.8599 %ile
Clostridium thermosuccinogenes
species
Below 35.8599 %ile
Erysipelothrix muris
species
Below 56.0898 %ile
Butyrivibrio hungatei
species
Above 50 %ile
Streptococcus australis
species
Above 80.5556 %ile
Bifidobacterium choerinum
species
Above 60.9756 %ile
FCB group
clade
Above 8.6426 %ile
Ruminococcaceae
family
Above 9.2529 %ile
Acholeplasmatales
order
Above 7.6923 %ile
Acetobacterium
genus
Above 4.9703 %ile
Intestinibacter bartlettii
species
Above 77.7778 %ile
Bacteroides pyogenes
species
Above 76.3825 %ile
Sarcina maxima
species
Above 71.8652 %ile
Coriobacteriia
class
Above 8.4291 %ile
Blautia stercoris
species
Above 70.4819 %ile
Emticicia oligotrophica
species
Above 88.5117 %ile
[Clostridium] hylemonae
species
Above 66.9763 %ile
Pectinatus cerevisiiphilus
species
Above 91.7887 %ile
Streptococcus oralis
species
Above 57.0136 %ile
Howardella ureilytica
species
Above 60.3774 %ile
Shewanellaceae
family
Below 49.7147 %ile
Shewanella
genus
Below 49.7147 %ile
Howardella
genus
Above 45.9016 %ile
Agathobacter rectalis
species
Above 71.3043 %ile
[Clostridium] symbiosum
species
Above 73.595 %ile
Bacillota sensu stricto incertae sedis
no rank
Above 56.1265 %ile
Falseniella
genus
Above 59.4221 %ile
Falseniella ignava
species
Above 59.4221 %ile
Alistipes onderdonkii
species
Above 64.4737 %ile
Sedimentibacter hydroxybenzoicus
species
Below 25.5814 %ile
Escherichia albertii
species
Above 85.7263 %ile
Selenomonas infelix
species
Below 41.4716 %ile
Aphanizomenonaceae
family
Below 28.3032 %ile
Bifidobacterium adolescentis
species
Above 56.4593 %ile
Rhodothermus
genus
Below 64.2613 %ile
Enterocloster citroniae
species
Above 77.193 %ile
Hespellia porcina
species
Above 75.8751 %ile
Carboxydocella ferrireducens
species
Below 32.8112 %ile
Nostocaceae
family
Below 53.6647 %ile
Mediterraneibacter glycyrrhizinilyticus
species
Below 28.6822 %ile
Limnobacter
genus
Below 51.6404 %ile
Sutterella sanguinus
species
Above 86.9959 %ile
Natronincola peptidivorans
species
Above 68.3226 %ile
Sphingobacterium bambusae
species
Below 24.5188 %ile
[Clostridium] leptum
species
Below 36.3636 %ile
Dolichospermum
genus
Below 28.0601 %ile
Veillonella montpellierensis
species
Above 52.2388 %ile
Limnobacter litoralis
species
Below 51.6087 %ile
Streptococcus thermophilus
species
Above 54.8936 %ile
Natronincola
genus
Above 67.8571 %ile
(c) 2026 Lassesen Consulting, LLC. ALL RIGHTS RESERVED
This work is licensed under the Creative Commons Attribution‑NonCommercial 4.0 International License (CC BY‑NC 4.0). Commercial use is prohibited without prior written permission. See https://creativecommons.org/licenses/by-nc/4.0/.
This is derived from “Asymptomatic: No Health Issues” Odd-Ratio Model (See this post). These ranges should apply to any test. It applies to only bacteria that are reported by the test. The current matrix of Odds ratio is available at Key Bacteria for Symptoms using Percentiles (Lab Agnostic) – R2.
CLARIFICATION: June 14th: These are the amount to be HEALTHY
Example Sporosarcina is 34.2%ile
If your sample is below 34.2%ile, i,e, 31% then it will selected the bacteria for remediation.
If you are interested in the mathematics see my prior posts.
Tax_Name
Tax_Rank
Amount to be healthy
Bacteroidota/Chlorobiota group
clade
Above 10.6%ile
delta/epsilon subdivisions
clade
Above 9.4%ile
Bacteria candidate phyla
clade
Above 54%ile
PVC group
clade
Above 6.7%ile
FCB group
clade
Above 10.6%ile
Terrabacteria group
clade
Above 10.6%ile
Cyanobacteriota/Melainabacteria group
clade
Above 13.5%ile
Methanomada group
clade
Above 5.9%ile
Balneolia
class
Above 49.4%ile
Chitinophagia
class
Above 15%ile
Desulfobacteria
class
Above 26.7%ile
Cyanophyceae
class
Above 12.3%ile
Desulfovibrionia
class
Above 8.9%ile
Ignavibacteria
class
Above 59.5%ile
Cytophagia
class
Above 15.8%ile
Negativicutes
class
Above 10.5%ile
Lentisphaeria
class
Above 25%ile
Tissierellia
class
Above 6.3%ile
Bacteroidia
class
Above 10.4%ile
Verrucomicrobiia
class
Above 2.3%ile
Fibrobacteria
class
Above 1.1%ile
Dehalococcoidia
class
Above 8.9%ile
Caldilineae
class
Above 4%ile
Erysipelotrichia
class
Above 10.6%ile
Holophagae
class
Above 3.4%ile
Synergistia
class
Above 0.8%ile
Acidimicrobiia
class
Above 2.1%ile
Coriobacteriia
class
Above 10.3%ile
Bacilli
class
Above 10.5%ile
Flavobacteriia
class
Above 6.1%ile
Sphingobacteriia
class
Above 9.6%ile
Methanobacteria
class
Above 5.9%ile
Clostridia
class
Above 10.4%ile
Gammaproteobacteria
class
Above 9.4%ile
Actinomycetes
class
Above 10.6%ile
Alphaproteobacteria
class
Above 5.7%ile
Betaproteobacteria
class
Above 9.9%ile
Deltaproteobacteria
class
Above 8.6%ile
Myxococcia
class
Above 1.6%ile
Lysobacteraceae
family
Above 3.9%ile
Bifidobacteriaceae
family
Above 7.7%ile
Veillonellaceae
family
Above 9.7%ile
Clostridiaceae
family
Above 10.5%ile
Lactobacillaceae
family
Above 9.1%ile
Halomonadaceae
family
Above 5.3%ile
Actinomycetaceae
family
Above 5.2%ile
Mycoplasmataceae
family
Above 8.3%ile
Spiroplasmataceae
family
Above 48.8%ile
Acholeplasmataceae
family
Above 9.6%ile
Methanobacteriaceae
family
Above 5.9%ile
Streptococcaceae
family
Above 10%ile
Corynebacteriaceae
family
Above 7.4%ile
Moraxellaceae
family
Above 0.8%ile
Enterobacteriaceae
family
Above 6.9%ile
Pasteurellaceae
family
Above 3.9%ile
Bacteroidaceae
family
Above 10.4%ile
Chromatiaceae
family
Above 4.5%ile
Lachnospiraceae
family
Above 10.7%ile
Peptostreptococcaceae
family
Above 10.5%ile
Eubacteriaceae
family
Above 3.7%ile
Peptococcaceae
family
Above 7.1%ile
unclassified Clostridiales
family
Above 49.8%ile
Thermoanaerobacteraceae
family
Above 2.7%ile
Bacillaceae
family
Above 1.7%ile
Planococcaceae
family
Above 15.8%ile
Paenibacillaceae
family
Above 3.1%ile
Thermoactinomycetaceae
family
Above 9.5%ile
Piscirickettsiaceae
family
Above 1.3%ile
Rikenellaceae
family
Above 26.8%ile
Porphyromonadaceae
family
Above 7.4%ile
Prevotellaceae
family
Above 6.9%ile
unclassified Burkholderiales
family
Above 22.7%ile
Cytophagaceae
family
Above 12.4%ile
Erysipelotrichaceae
family
Above 10.6%ile
Pseudomonadaceae
family
Above 15.7%ile
Acidimicrobiaceae
family
Above 2.4%ile
Nocardioidaceae
family
Above 18.2%ile
Microbacteriaceae
family
Above 18.8%ile
Sphingobacteriaceae
family
Above 9.8%ile
Coriobacteriaceae
family
Above 10.1%ile
Syntrophomonadaceae
family
Above 3.6%ile
Hyphomonadaceae
family
Above 37.4%ile
Rhodocyclaceae
family
Above 1.5%ile
Enterococcaceae
family
Above 1.4%ile
Rhodospirillaceae
family
Above 4.1%ile
Sphingomonadaceae
family
Above 12.2%ile
Flavobacteriaceae
family
Above 6.2%ile
Halobacteroidaceae
family
Above 36.6%ile
Holophagaceae
family
Above 3.3%ile
Kiloniellaceae
family
Above 2.8%ile
Bacillales Family X. Incertae Sedis
family
Above 10.2%ile
Gemellaceae
family
Above 0.6%ile
Ruminococcaceae
family
Above 11.1%ile
Eubacteriales Family XII. Incertae Sedis
family
Above 2.6%ile
Eubacteriales Family XIII. Incertae Sedis
family
Above 10.1%ile
Marinilabiliaceae
family
Above 57.3%ile
Cyclobacteriaceae
family
Above 29%ile
Chitinophagaceae
family
Above 15.6%ile
Caldilineaceae
family
Above 4%ile
Desulfarculaceae
family
Above 23.8%ile
Victivallaceae
family
Above 35.8%ile
Verrucomicrobiaceae
family
Above 1.4%ile
Desulfovibrionaceae
family
Above 8.5%ile
Desulfomicrobiaceae
family
Above 9%ile
Desulfobacteraceae
family
Above 25.9%ile
Oscillospiraceae
family
Above 10.4%ile
Akkermansiaceae
family
Above 3.5%ile
Peptoniphilaceae
family
Above 6.5%ile
Eggerthellaceae
family
Above 10.1%ile
Melioribacteraceae
family
Above 71.4%ile
Proteinivoraceae
family
Above 4.2%ile
Acidaminococcaceae
family
Above 6.4%ile
Christensenellaceae
family
Above 11.5%ile
Sutterellaceae
family
Above 9.7%ile
Desulfurisporaceae
family
Above 11.3%ile
Coprobacillaceae
family
Above 5.6%ile
Turicibacteraceae
family
Above 6.8%ile
Tepidimicrobiaceae
family
Above 48%ile
Kribbellaceae
family
Above 2.6%ile
Azospirillaceae
family
Above 8.6%ile
Rhodovibrionaceae
family
Above 17.8%ile
Thalassospiraceae
family
Above 19.6%ile
Thermohalobacteraceae
family
Above 80.4%ile
Metamycoplasmataceae
family
Above 1.9%ile
Spirosomataceae
family
Above 1.6%ile
Desulfitobacteriaceae
family
Above 11%ile
Desulfotomaculaceae
family
Above 1.9%ile
Tissierellaceae
family
Above 34.5%ile
Sporomusaceae
family
Above 6.7%ile
Balneolaceae
family
Above 49.5%ile
Hungateiclostridiaceae
family
Above 5.6%ile
Odoribacteraceae
family
Above 8.7%ile
Pectobacteriaceae
family
Above 25.9%ile
Morganellaceae
family
Above 20%ile
Barnesiellaceae
family
Above 24.7%ile
Dysgonomonadaceae
family
Above 10.8%ile
Tannerellaceae
family
Above 9.6%ile
Desulfofarcimen
genus
Above 9.3%ile
Desulfohalotomaculum
genus
Above 35.9%ile
Clostridioides
genus
Above 45.8%ile
Hungateiclostridium
genus
Above 37.3%ile
Mediterraneibacter
genus
Above 18%ile
Schaalia
genus
Above 6%ile
Anaerocolumna
genus
Above 66.8%ile
Hathewaya
genus
Above 11%ile
Segatella
genus
Above 15.4%ile
Hoylesella
genus
Above 0.7%ile
Leyella
genus
Above 5.5%ile
Paracholeplasma
genus
Above 71.1%ile
Oleidesulfovibrio
genus
Above 54.4%ile
Limosilactobacillus
genus
Above 13.2%ile
Thomasclavelia
genus
Above 23.3%ile
Christensenella
genus
Above 11.9%ile
Pseudoflavonifractor
genus
Above 24.6%ile
Melioribacter
genus
Above 73.3%ile
Murdochiella
genus
Above 34.1%ile
Alloprevotella
genus
Above 4.3%ile
Flavonifractor
genus
Above 31.8%ile
Phocaeicola
genus
Above 10.1%ile
Cellulosilyticum
genus
Above 71.6%ile
Romboutsia
genus
Above 25.9%ile
Terrisporobacter
genus
Above 32.4%ile
Intestinibacter
genus
Above 41.9%ile
Erysipelatoclostridium
genus
Above 34%ile
Ruminiclostridium
genus
Above 13.6%ile
Brassicibacter
genus
Above 83.9%ile
Fretibacterium
genus
Above 13.3%ile
Candidatus Soleaferrea
genus
Below 47.5%ile
Kosakonia
genus
Above 14.3%ile
Coprobacter
genus
Above 26.9%ile
Intestinimonas
genus
Above 30.4%ile
Fusicatenibacter
genus
Above 35.9%ile
Acetatifactor
genus
Below 52.3%ile
Eisenbergiella
genus
Above 31.1%ile
Aestuariispira
genus
Below 24.8%ile
Dielma
genus
Above 23.1%ile
Senegalimassilia
genus
Above 26.6%ile
Peptoclostridium
genus
Above 53.5%ile
Holdemanella
genus
Above 9.7%ile
Ezakiella
genus
Above 44.4%ile
Aminicella
genus
Below 30.1%ile
Hungatella
genus
Above 66.5%ile
Herbinix
genus
Above 36.5%ile
Fenollaria
genus
Above 71.9%ile
Pseudoscardovia
genus
Above 75.6%ile
Casaltella
genus
Above 49.4%ile
Faecalibacterium
genus
Above 10.3%ile
Alistipes
genus
Above 29%ile
Akkermansia
genus
Above 3.1%ile
Gemmiger
genus
Below 45.3%ile
Anaerostipes
genus
Above 10.6%ile
Acetoanaerobium
genus
Above 49.4%ile
Dorea
genus
Above 10.7%ile
Sedimentibacter
genus
Above 2.8%ile
Turicibacter
genus
Above 7.4%ile
Marvinbryantia
genus
Above 31.9%ile
Ethanoligenens
genus
Above 25.8%ile
Hespellia
genus
Above 27.1%ile
Anaerotruncus
genus
Above 10.8%ile
Anaerospora
genus
Above 54.1%ile
Acetanaerobacterium
genus
Above 8.6%ile
Odoribacter
genus
Above 8.7%ile
Tepidimicrobium
genus
Above 50%ile
Oribacterium
genus
Above 20.6%ile
Subdoligranulum
genus
Above 35.2%ile
Gracilibacter
genus
Above 77.7%ile
Henriciella
genus
Above 42.8%ile
Oscillibacter
genus
Above 29.1%ile
Lactonifactor
genus
Above 30.5%ile
Adlercreutzia
genus
Above 8.4%ile
Pelosinus
genus
Above 36.2%ile
Parabacteroides
genus
Above 9.7%ile
Niabella
genus
Above 18.1%ile
Barnesiella
genus
Above 21.5%ile
Howardella
genus
Above 6.6%ile
Proteiniborus
genus
Below 35.9%ile
Moryella
genus
Above 22.2%ile
Desulfurispora
genus
Above 11.3%ile
Blautia
genus
Above 10.7%ile
Butyricimonas
genus
Above 4.2%ile
Parasutterella
genus
Above 29.4%ile
Enterorhabdus
genus
Above 27.3%ile
Robinsoniella
genus
Above 8.4%ile
Gordonibacter
genus
Above 26.9%ile
Anaerosporobacter
genus
Above 40.3%ile
Propioniferax
genus
Below 52.3%ile
Holdemania
genus
Above 8.2%ile
Acidaminobacter
genus
Above 0.5%ile
Hallella
genus
Above 1.4%ile
Anaerofilum
genus
Above 3.5%ile
Pantoea
genus
Above 21.1%ile
Pseudobutyrivibrio
genus
Above 11.2%ile
Anaerobranca
genus
Above 1.2%ile
Johnsonella
genus
Above 13.6%ile
Sutterella
genus
Above 6.9%ile
Catonella
genus
Above 17.5%ile
Paenibacillus
genus
Above 10.5%ile
Caloramator
genus
Above 12.9%ile
Filifactor
genus
Above 7%ile
Geothrix
genus
Above 1.5%ile
Sporobacter
genus
Above 23.4%ile
Weissella
genus
Above 13.3%ile
Facklamia
genus
Above 60.7%ile
Brenneria
genus
Above 31.6%ile
Slackia
genus
Above 3.2%ile
Eggerthella
genus
Above 1.6%ile
Pedobacter
genus
Above 3.6%ile
Halochromatium
genus
Above 3%ile
Mogibacterium
genus
Above 1.8%ile
Papillibacter
genus
Above 31.1%ile
Coprobacillus
genus
Above 1%ile
Thermicanus
genus
Above 9.8%ile
Collinsella
genus
Above 12.2%ile
Olsenella
genus
Above 26.9%ile
Granulicatella
genus
Above 6%ile
Parasporobacterium
genus
Above 19.5%ile
Oscillospira
genus
Above 10.7%ile
Victivallis
genus
Above 35.1%ile
Anaerococcus
genus
Above 10.1%ile
Thalassospira
genus
Above 17.9%ile
Lachnobacterium
genus
Above 14.5%ile
Finegoldia
genus
Above 10.6%ile
Dysgonomonas
genus
Above 10.4%ile
Peptoniphilus
genus
Above 4.4%ile
Varibaculum
genus
Above 5.8%ile
Kribbella
genus
Above 2.6%ile
Porphyromonas
genus
Above 4%ile
Prevotella
genus
Above 5.3%ile
Syntrophomonas
genus
Above 3%ile
Desulfovibrio
genus
Above 4%ile
Desulfomicrobium
genus
Above 9.5%ile
Acidaminococcus
genus
Above 7.3%ile
Megasphaera
genus
Above 3.9%ile
Shigella
genus
Above 42.9%ile
Butyrivibrio
genus
Above 4.9%ile
Roseburia
genus
Above 10.5%ile
Oxalobacter
genus
Above 5%ile
Bacteroides
genus
Above 10.3%ile
Haemophilus
genus
Above 5.7%ile
Kluyvera
genus
Above 70.8%ile
Proteus
genus
Above 9.1%ile
Azospirillum
genus
Above 8.4%ile
Campylobacter
genus
Above 0.7%ile
Flavobacterium
genus
Above 40.1%ile
Pseudomonas
genus
Above 15.7%ile
Actinomyces
genus
Above 6.9%ile
Bifidobacterium
genus
Above 8.1%ile
Corynebacterium
genus
Above 6.9%ile
Eubacterium
genus
Above 0.9%ile
Bacillus
genus
Above 4.8%ile
Clostridium
genus
Above 10.5%ile
Desulfotomaculum
genus
Above 11.5%ile
Sporosarcina
genus
Above 34.2%ile
Lactobacillus
genus
Above 7%ile
Erysipelothrix
genus
Above 9.2%ile
Streptococcus
genus
Above 10%ile
Ruminococcus
genus
Above 18.2%ile
Gemella
genus
Above 0.7%ile
Atopobium
genus
Above 1.6%ile
Methanobrevibacter
genus
Above 3.3%ile
Peptococcus
genus
Above 4.5%ile
Acholeplasma
genus
Above 1.1%ile
Sarcina
genus
Above 17.7%ile
Spiroplasma
genus
Above 49%ile
Mycoplasma
genus
Above 4.9%ile
Halomonas
genus
Above 25%ile
Sphingomonas
genus
Above 20.6%ile
Lachnospira
genus
Above 9.6%ile
Microbacterium
genus
Above 1.3%ile
Acetobacterium
genus
Above 5%ile
Dialister
genus
Above 6.1%ile
Acetivibrio
genus
Above 17.1%ile
Bilophila
genus
Above 10.6%ile
Acetitomaculum
genus
Above 8.8%ile
Veillonella
genus
Above 7.5%ile
Coprococcus
genus
Above 18.3%ile
Phascolarctobacterium
genus
Above 6.7%ile
Bacillota sensu stricto incertae sedis
no rank
Above 64.6%ile
cellular organisms
no rank
Above 1.3%ile
Bacteria incertae sedis
no rank
Above 33.5%ile
Eubacteriales incertae sedis
no rank
Above 8%ile
Oscillospiraceae incertae sedis
no rank
Above 68.7%ile
Peptostreptococcaceae incertae sedis
no rank
Above 4.4%ile
Tissierellia incertae sedis
no rank
Above 11.6%ile
unclassified Streptococcus
no rank
Above 81%ile
unclassified Alistipes
no rank
Above 72.1%ile
unclassified Veillonella
no rank
Above 87.9%ile
unclassified Peptoniphilus
no rank
Above 73.6%ile
unclassified Bacteroides
no rank
Above 76.7%ile
unclassified Blautia
no rank
Above 61.5%ile
unclassified Parabacteroides
no rank
Above 36.5%ile
Chitinophagales
order
Above 15%ile
Balneolales
order
Above 49.4%ile
Acidaminococcales
order
Above 6.5%ile
Veillonellales
order
Above 9.7%ile
Marinilabiliales
order
Above 45.9%ile
Mycoplasmoidales
order
Above 1.8%ile
Hyphomonadales
order
Above 42.3%ile
Moraxellales
order
Above 0.8%ile
Tissierellales
order
Above 6.5%ile
Cellvibrionales
order
Above 9.7%ile
Eggerthellales
order
Above 10.1%ile
Ignavibacteriales
order
Above 60.3%ile
Selenomonadales
order
Above 5.7%ile
Cytophagales
order
Above 15.8%ile
Rhodospirillales
order
Above 3.5%ile
Rhodobacterales
order
Above 25.9%ile
Sphingomonadales
order
Above 17.4%ile
Flavobacteriales
order
Above 5.9%ile
Sphingobacteriales
order
Above 9.6%ile
Desulfovibrionales
order
Above 8.9%ile
Desulfobacterales
order
Above 26.9%ile
Fibrobacterales
order
Above 1.1%ile
Victivallales
order
Above 25.9%ile
Erysipelotrichales
order
Above 10.6%ile
Holophagales
order
Above 3.3%ile
Synergistales
order
Above 0.8%ile
Caldilineales
order
Above 4%ile
Desulfarculales
order
Above 24.3%ile
Verrucomicrobiales
order
Above 2.3%ile
Halanaerobiales
order
Above 21.5%ile
Coriobacteriales
order
Above 10.4%ile
Bifidobacteriales
order
Above 7.7%ile
Mycobacteriales
order
Above 4.3%ile
Streptosporangiales
order
Above 1.6%ile
Acidimicrobiales
order
Above 2.1%ile
Thiotrichales
order
Above 1.8%ile
Pseudomonadales
order
Above 10%ile
Chromatiales
order
Above 8%ile
Lysobacterales
order
Above 7%ile
Alteromonadales
order
Above 6.1%ile
Aeromonadales
order
Above 7.9%ile
Pasteurellales
order
Above 3.9%ile
Burkholderiales
order
Above 9.8%ile
Enterobacterales
order
Above 6.1%ile
Bacteroidales
order
Above 10.4%ile
Eubacteriales
order
Above 10.4%ile
Entomoplasmatales
order
Above 13.1%ile
Acholeplasmatales
order
Above 10.2%ile
Lactobacillales
order
Above 10.4%ile
Oceanospirillales
order
Above 11.5%ile
Mycoplasmatales
order
Above 12.4%ile
Actinomycetales
order
Above 7%ile
Methanobacteriales
order
Above 5.9%ile
Bacillales
order
Above 6.2%ile
Oscillatoriales
order
Above 17.5%ile
Nostocales
order
Above 2%ile
Hyphomicrobiales
order
Above 8.3%ile
Myxococcales
order
Above 1.8%ile
Bacteroidota
phylum
Above 10.4%ile
Cyanobacteriota
phylum
Above 13.6%ile
Pseudomonadota
phylum
Above 10.3%ile
Bacillota
phylum
Above 10.5%ile
Euryarchaeota
phylum
Above 4.2%ile
Candidatus Saccharibacteria
phylum
Above 28.8%ile
Verrucomicrobiota
phylum
Above 6.3%ile
Synergistota
phylum
Above 0.8%ile
Lentisphaerota
phylum
Above 24.1%ile
Chloroflexota
phylum
Above 11%ile
Thermodesulfobacteriota
phylum
Above 6.5%ile
Actinomycetota
phylum
Above 10.3%ile
Ignavibacteriota
phylum
Above 57.9%ile
Myxococcota
phylum
Above 1.6%ile
Balneolota
phylum
Above 42.4%ile
Melioribacter roseus
species
Above 65.1%ile
Fusicatenibacter saccharivorans
species
Above 33.2%ile
Intestinimonas butyriciproducens
species
Above 8.4%ile
Ruminococcus champanellensis
species
Above 63.9%ile
Parabacteroides faecis
species
Above 59.4%ile
Dielma fastidiosa
species
Above 21.5%ile
Coprobacter fastidiosus
species
Above 21.4%ile
Tepidimicrobium xylanilyticum
species
Above 52.3%ile
Bacteroides reticulotermitis
species
Above 85.9%ile
Anaerostipes sp. 5_1_63FAA
species
Above 86.3%ile
Casaltella massiliensis
species
Above 51.8%ile
Anaerococcus provencensis
species
Above 26.2%ile
Blautia stercoris
species
Above 13.6%ile
Blautia faecis
species
Above 35.3%ile
[Lactobacillus] rogosae
species
Below 62.3%ile
Phocaeicola paurosaccharolyticus
species
Above 15.9%ile
Brassicibacter mesophilus
species
Above 80.3%ile
Gemmiger formicilis
species
Below 45.8%ile
Eisenbergiella tayi
species
Above 30.1%ile
Dysgonomonas macrotermitis
species
Above 45.5%ile
Butyricimonas faecihominis
species
Above 31.8%ile
Aestuariispira insulae
species
Below 29.5%ile
Oleidesulfovibrio vietnamensis
species
Above 57%ile
Oribacterium sinus
species
Above 18.4%ile
Akkermansia muciniphila
species
Above 3.9%ile
Dialister invisus
species
Above 1.3%ile
Bifidobacterium longum
species
Above 8.5%ile
Subdoligranulum variabile
species
Above 31.5%ile
Alistipes finegoldii
species
Above 28.7%ile
Phocaeicola massiliensis
species
Above 4.2%ile
Clostridium frigoris
species
Above 2.2%ile
Ethanoligenens harbinense
species
Above 49.2%ile
Bifidobacterium thermacidophilum
species
Above 20%ile
Bacteroides cellulosilyticus
species
Above 14.3%ile
Bacteroides helcogenes
species
Above 34.5%ile
Eubacterium coprostanoligenes
species
Above 82%ile
Anaerosporobacter mobilis
species
Above 31.2%ile
Acholeplasma hippikon
species
Above 6.2%ile
Desulfurispora thermophila
species
Above 11.5%ile
Flavonifractor plautii
species
Above 29.5%ile
Gracilibacter thermotolerans
species
Above 77.2%ile
Mediterraneibacter glycyrrhizinilyticus
species
Below 27%ile
Oscillibacter valericigenes
species
Above 6.2%ile
Phocaeicola dorei
species
Above 7.2%ile
Roseburia inulinivorans
species
Above 26.1%ile
Leyella stercorea
species
Above 5.5%ile
Roseburia faecis
species
Above 8.4%ile
Dialister propionicifaciens
species
Above 25.3%ile
Phocaeicola plebeius
species
Above 11.1%ile
Phocaeicola coprocola
species
Above 14.8%ile
Bacteroides pyogenes
species
Above 78.9%ile
Acetivibrio alkalicellulosi
species
Above 15.2%ile
Parabacteroides goldsteinii
species
Above 1.7%ile
Alistipes onderdonkii
species
Above 64.3%ile
Alistipes shahii
species
Above 26.4%ile
Bacteroides finegoldii
species
Above 7.9%ile
Lactonifactor longoviformis
species
Above 21%ile
Bacteroides graminisolvens
species
Above 11%ile
Barnesiella intestinihominis
species
Above 25.1%ile
Parasutterella excrementihominis
species
Above 29.4%ile
Porphyromonas bennonis
species
Above 6.8%ile
Butyricicoccus pullicaecorum
species
Below 66.3%ile
Alistipes sp. EBA6-25cl2
species
Below 67.6%ile
Bacteroides sp. EBA5-17
species
Below 82.8%ile
Aminicella lysinilytica
species
Below 43.8%ile
Bacteroides sp. 2_2_4
species
Above 59%ile
Gordonibacter pamelaeae
species
Above 29.5%ile
Bifidobacterium bombi
species
Above 27.1%ile
Sutterella parvirubra
species
Above 14%ile
Segatella maculosa
species
Above 1.5%ile
Adlercreutzia equolifaciens
species
Above 6.1%ile
Blautia wexlerae
species
Above 10.7%ile
Howardella ureilytica
species
Above 4.9%ile
Niabella aurantiaca
species
Above 8.3%ile
[Bacteroides] pectinophilus
species
Above 58.7%ile
Phocaeicola coprophilus
species
Above 23.4%ile
Phocaeicola salanitronis
species
Above 11.8%ile
Bacteroides gallinarum
species
Above 13%ile
Pelosinus fermentans
species
Above 38.9%ile
Bacteroides xylanisolvens
species
Above 1.4%ile
Anaerostipes hadrus
species
Above 16%ile
Phocaeicola sartorii
species
Above 12.4%ile
Bacteroides faecis
species
Above 7.9%ile
Bacteroides rodentium
species
Above 16.8%ile
Mediterraneibacter faecis
species
Below 41.2%ile
Bacteroides fluxus
species
Above 10.2%ile
Alistipes indistinctus
species
Above 18.1%ile
Slackia piriformis
species
Above 8.5%ile
Phascolarctobacterium succinatutens
species
Above 1.2%ile
Slackia isoflavoniconvertens
species
Above 12.8%ile
Blautia glucerasea
species
Above 0.5%ile
Collinsella aerofaciens
species
Above 8.4%ile
Thomasclavelia cocleata
species
Below 52.6%ile
[Clostridium] methylpentosum
species
Above 82.7%ile
Segatella albensis
species
Above 21%ile
Bifidobacterium boum
species
Above 48.8%ile
Kluyvera georgiana
species
Above 68.1%ile
Paracholeplasma vituli
species
Above 72.7%ile
Eggerthella lenta
species
Above 4.8%ile
Bacteroides acidifaciens
species
Above 3.7%ile
[Ruminococcus] lactaris
species
Below 67.3%ile
Acidaminobacter hydrogenoformans
species
Above 0.5%ile
Lachnoclostridium phytofermentans
species
Above 50%ile
Holdemania filiformis
species
Above 34.5%ile
Anaerococcus octavius
species
Above 11%ile
Desulfofarcimen acetoxidans
species
Above 15.8%ile
Parabacteroides merdae
species
Above 6.8%ile
Bacteroides stercoris
species
Above 2.1%ile
[Clostridium] viride
species
Above 53.5%ile
Bacteroides caccae
species
Above 9.5%ile
Sporobacter termitidis
species
Above 58%ile
Catonella morbi
species
Above 7.6%ile
Succiniclasticum ruminis
species
Above 24.8%ile
Johnsonella ignava
species
Above 9.9%ile
Clostridium putrefaciens
species
Above 33.3%ile
Anaerostipes caccae
species
Above 6%ile
Pseudoflavonifractor capillosus
species
Above 26.8%ile
Coprobacillus cateniformis
species
Above 7%ile
Catenibacterium mitsuokai
species
Above 9.7%ile
Dorea longicatena
species
Above 32.1%ile
Blautia luti
species
Above 33.3%ile
[Clostridium] hylemonae
species
Above 68.2%ile
Coprococcus catus
species
Above 20.4%ile
Filifactor alocis
species
Above 16.4%ile
Lactobacillus iners
species
Above 13.9%ile
Segatella copri
species
Above 15%ile
Hungatella hathewayi
species
Above 40.6%ile
Turicibacter sanguinis
species
Above 7.3%ile
Anaerotruncus colihominis
species
Above 3.8%ile
Roseburia intestinalis
species
Above 28.9%ile
Marvinbryantia formatexigens
species
Below 32.2%ile
Victivallis vadensis
species
Above 11.9%ile
Blautia schinkii
species
Above 12%ile
Robinsoniella peoriensis
species
Above 58.3%ile
Varibaculum cambriense
species
Above 29.4%ile
[Clostridium] cellulosi
species
Above 65.3%ile
Caloramator fervidus
species
Above 5.4%ile
Alkalithermobacter thermoalcaliphilus
species
Above 8.3%ile
[Clostridium] scindens
species
Above 61.5%ile
Thomasclavelia spiroformis
species
Below 51.4%ile
Clostridium chartatabidum
species
Above 28.7%ile
[Clostridium] polysaccharolyticum
species
Below 17.3%ile
Gemella morbillorum
species
Above 23%ile
Lachnospira pectinoschiza
species
Above 7.2%ile
Bacteroides ovatus
species
Above 5.7%ile
Alistipes putredinis
species
Above 28.6%ile
Odoribacter splanchnicus
species
Above 29.6%ile
Prevotella corporis
species
Above 2.1%ile
Bifidobacterium animalis
species
Above 3.6%ile
Bifidobacterium pseudocatenulatum
species
Above 18.5%ile
Peptococcus niger
species
Above 5.5%ile
Methanobrevibacter smithii
species
Above 3.4%ile
Ruminococcus bromii
species
Above 21.6%ile
Ruminococcus callidus
species
Above 14.7%ile
Blautia obeum
species
Above 18.8%ile
Bilophila wadsworthia
species
Above 8.9%ile
Terrisporobacter glycolicus
species
Above 17.5%ile
Clostridium intestinale
species
Above 63.5%ile
Dorea formicigenerans
species
Above 10%ile
[Eubacterium] siraeum
species
Above 68.9%ile
Veillonella atypica
species
Above 0%ile
Veillonella dispar
species
Above 7.7%ile
Phascolarctobacterium faecium
species
Above 5.8%ile
Peptoniphilus lacrimalis
species
Above 0.7%ile
Blautia producta
species
Above 20.9%ile
Anaerococcus vaginalis
species
Above 11.2%ile
Mediterraneibacter gnavus
species
Above 17.2%ile
[Ruminococcus] torques
species
Above 21.6%ile
Coprococcus eutactus
species
Above 20.1%ile
Veillonella parvula
species
Above 0.4%ile
Finegoldia magna
species
Above 5.9%ile
Ruminococcus albus
species
Above 19.2%ile
Ruminococcus flavefaciens
species
Above 38.8%ile
Streptococcus sanguinis
species
Above 1.3%ile
Streptococcus thermophilus
species
Above 3.5%ile
Streptococcus parasanguinis
species
Above 9%ile
Blautia hansenii
species
Above 3.4%ile
Streptococcus anginosus
species
Above 10.5%ile
Enterococcus faecalis
species
Above 9.1%ile
Lactococcus lactis
species
Above 4.3%ile
Clostridioides difficile
species
Above 53.7%ile
Clostridium kluyveri
species
Above 24.5%ile
[Clostridium] leptum
species
Above 74.7%ile
Thomasclavelia ramosa
species
Above 31%ile
Faecalispora sporosphaeroides
species
Above 89.2%ile
Eubacterium oxidoreducens
species
Below 14.9%ile
Holdemanella biformis
species
Above 10.1%ile
Eubacterium limosum
species
Above 1.3%ile
Propioniferax innocua
species
Below 52%ile
Bifidobacterium indicum
species
Above 6.3%ile
Bifidobacterium magnum
species
Above 54%ile
Schaalia odontolytica
species
Above 8%ile
Hoylesella loescheii
species
Above 6.2%ile
Butyrivibrio fibrisolvens
species
Above 61.2%ile
Oxalobacter formigenes
species
Above 4.5%ile
Faecalibacterium prausnitzii
species
Above 9.9%ile
Proteus mirabilis
species
Above 11.1%ile
Haemophilus parainfluenzae
species
Above 5.5%ile
Aggregatibacter aphrophilus
species
Above 9.8%ile
Bacteroides fragilis
species
Above 6.1%ile
Bacteroides thetaiotaomicron
species
Above 9.2%ile
Bacteroides uniformis
species
Above 8.8%ile
Phocaeicola vulgatus
species
Above 9.3%ile
Parabacteroides distasonis
species
Above 9.4%ile
Lactobacillus casei group
species group
Above 23.9%ile
Streptococcus anginosus group
species group
Above 4.4%ile
Oscillatoriophycideae
subclass
Above 6.3%ile
Archaea
superkingdom
Above 7%ile
(c) 2026 Lassesen Consulting, LLC. ALL RIGHTS RESERVED
This work is licensed under the Creative Commons Attribution‑NonCommercial 4.0 International License (CC BY‑NC 4.0). Commercial use is prohibited without prior written permission. See https://creativecommons.org/licenses/by-nc/4.0/.


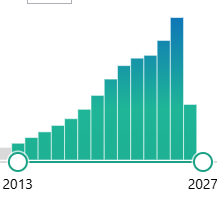
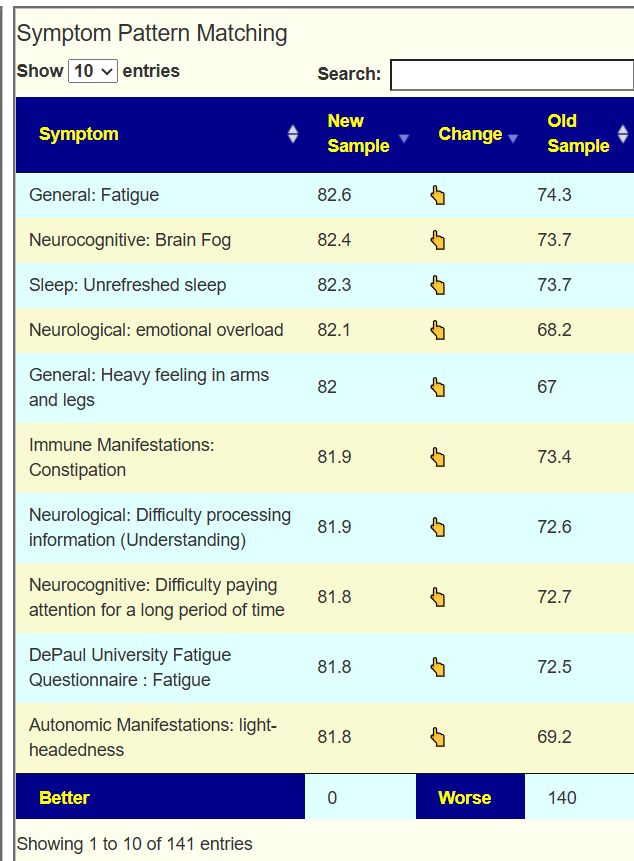
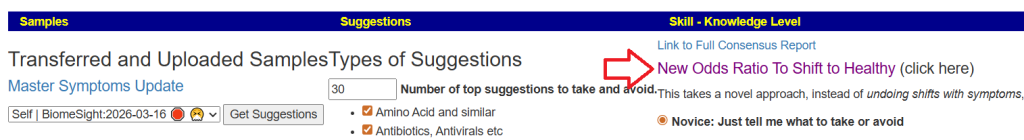
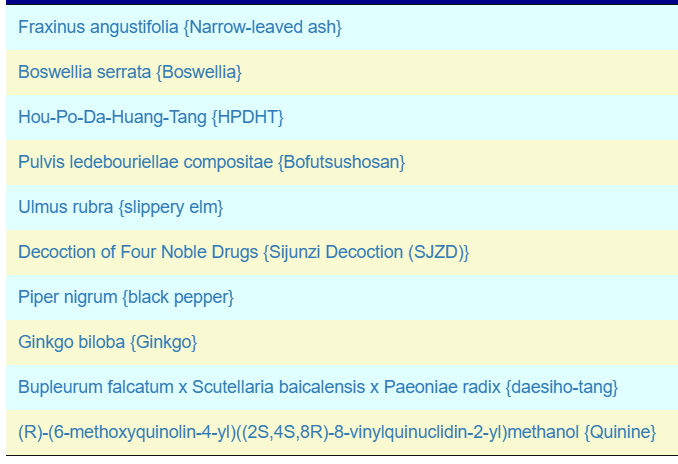
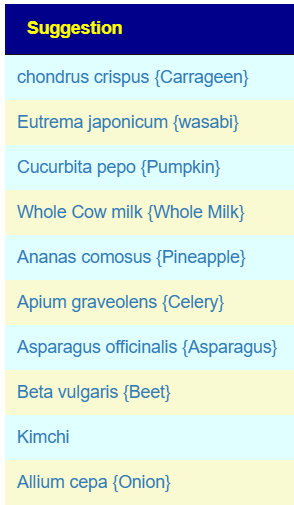
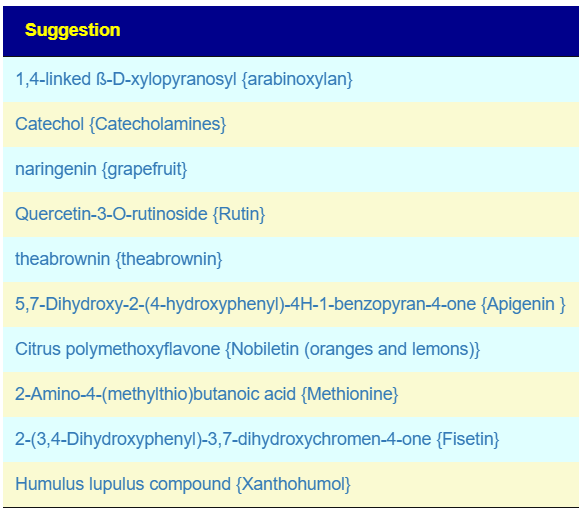
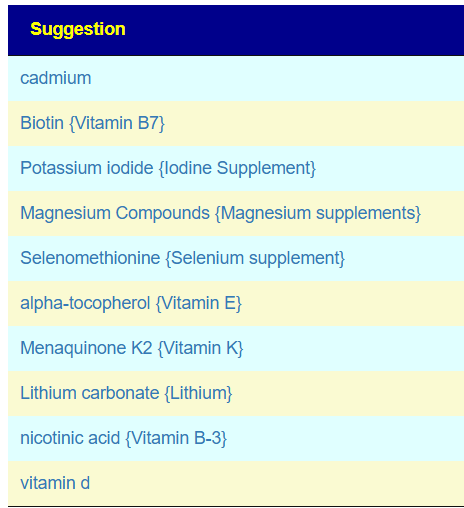
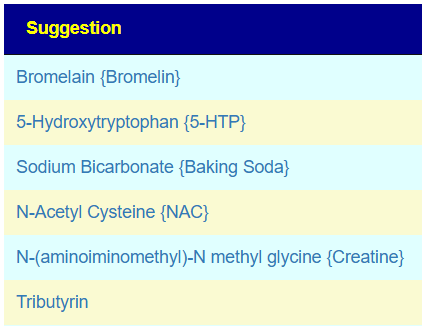
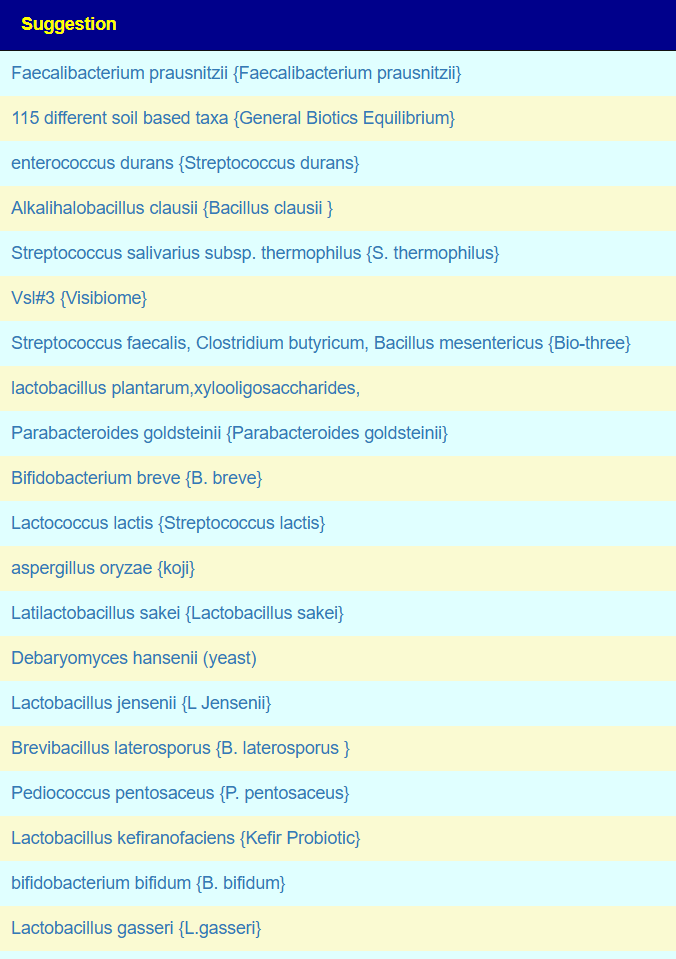
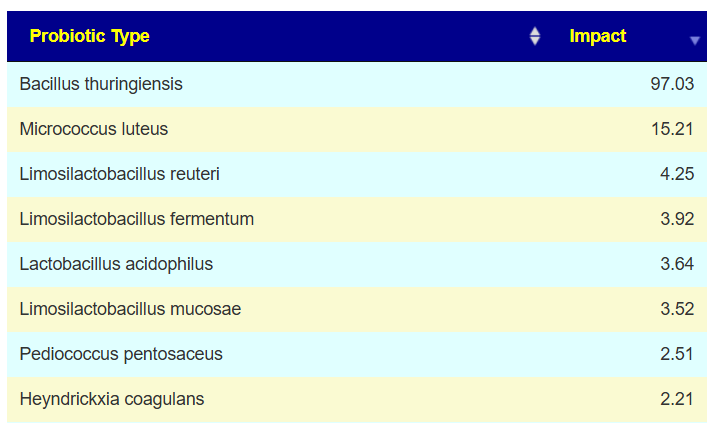
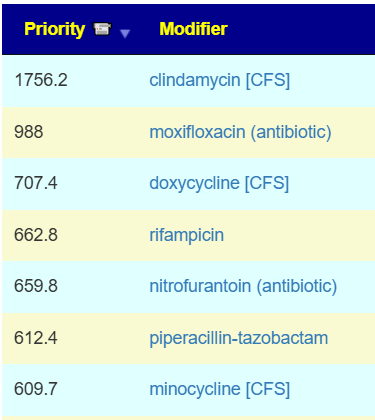
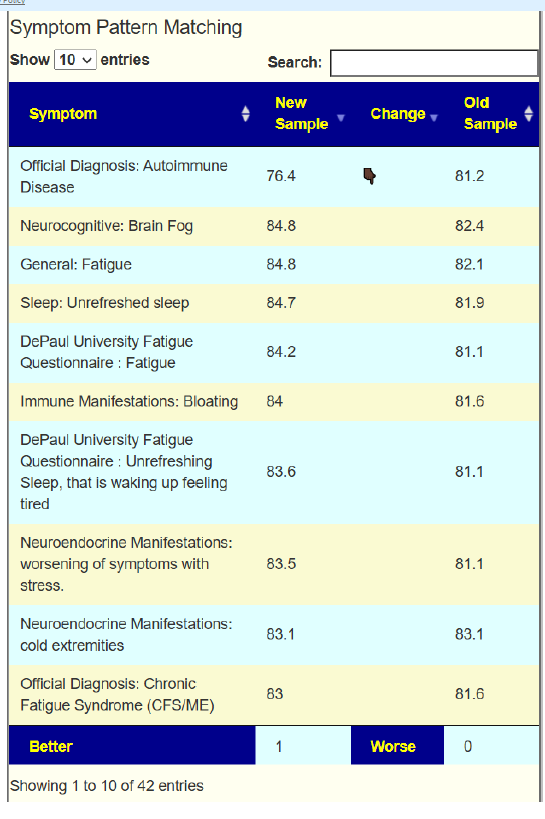
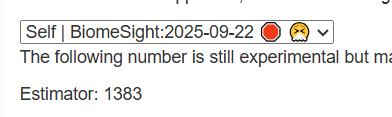
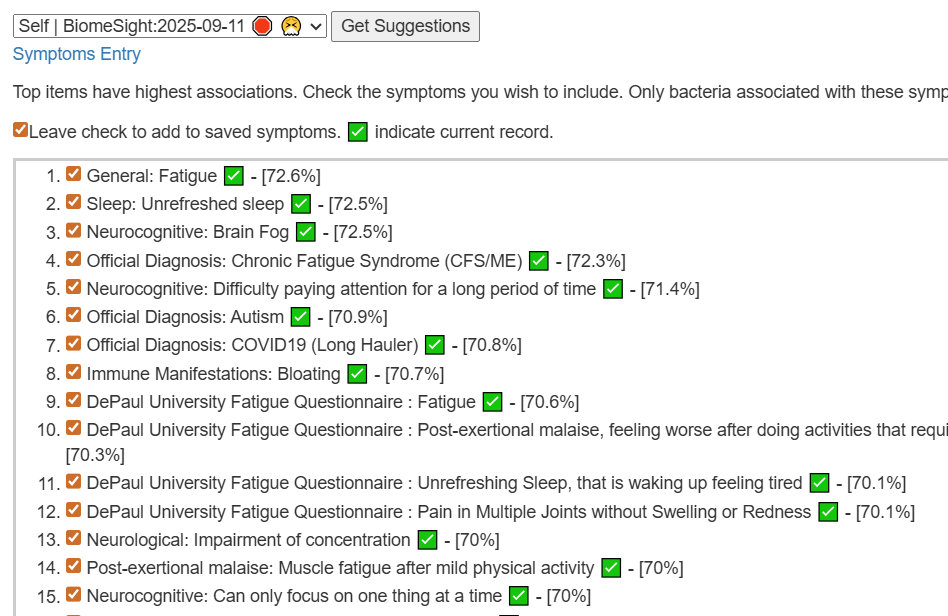
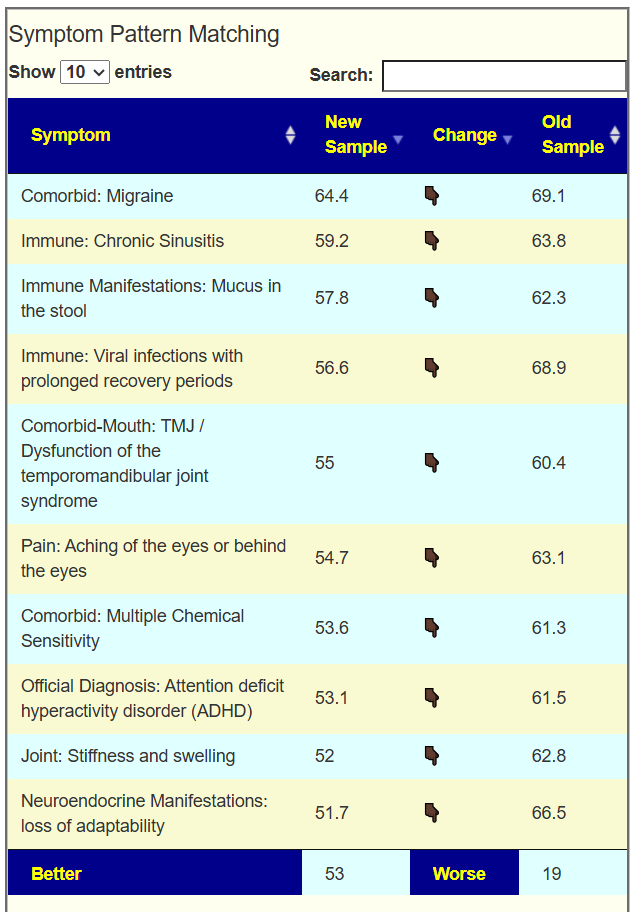
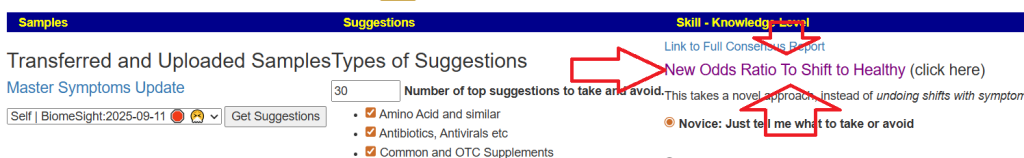
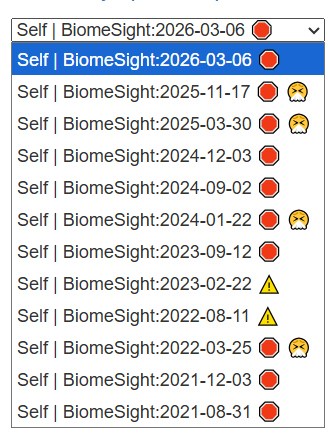
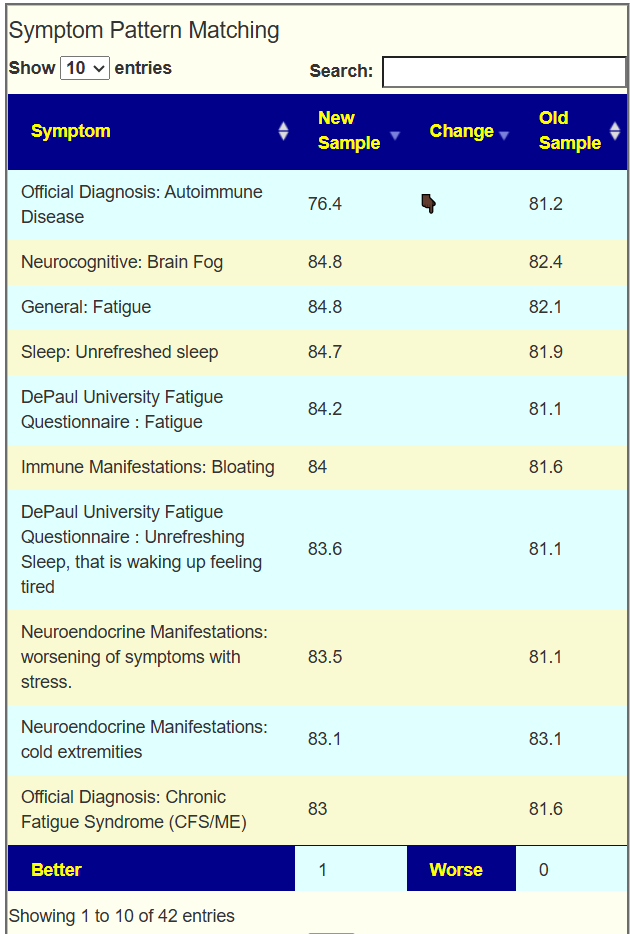
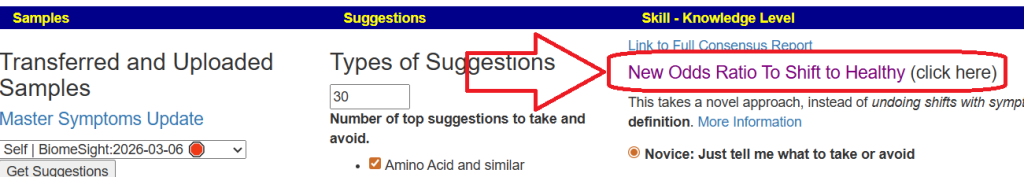
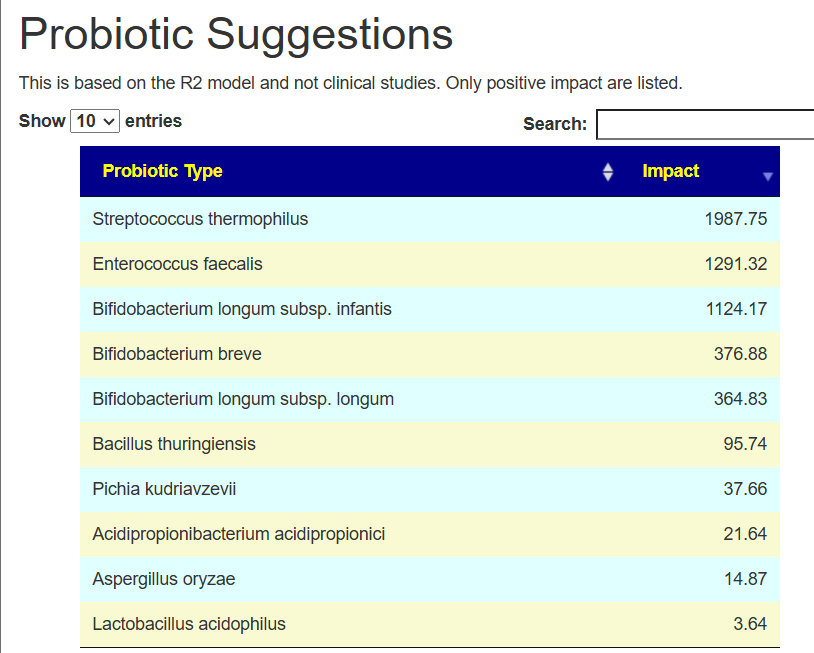
Recent Comments