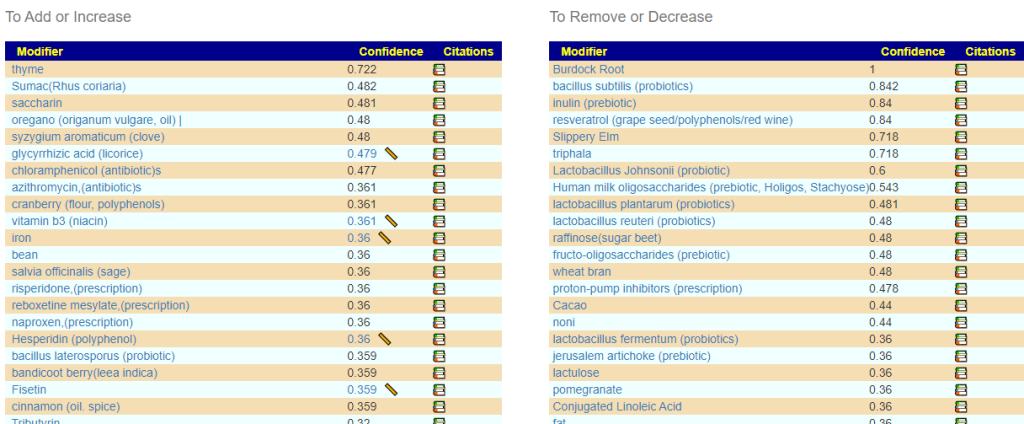
This post is intended for researchers by pointing to bacteria whose genetics are likely significant for long COVID. The raw data is below. Preliminary z-scores indicated that they are significant (Pr < 0.01) and no filtering has occurred for False Detection Rate. Users are advised to perform their own statistics.
Note: These results are lab-specific, using the data provided by BiomeSight.
The reference site for the study is: http://longcovid.microbiomeprescription.com/, the raw data is available at: http://citizenscience.microbiomeprescription.com/
| Symptom Obs | No Symptom Obs | Lab | SymptomName |
| 152 | 998 | biomesight | Official Diagnosis: COVID19 (Long Hauler |
| Bacteria | tax_rank | No Symptom Count | Symptom Count | No Symptom Frequency % | Symptom Frequency % |
| Lactococcus | genus | 620 | 136 | 62.1 | 89.5 |
| Negativicoccus | genus | 461 | 86 | 46.2 | 56.6 |
| Pedobacter kwangyangensis | species | 354 | 76 | 35.5 | 50 |
| Hydrogenophilaceae | family | 480 | 90 | 48.1 | 59.2 |
| Nostoc | genus | 344 | 68 | 34.5 | 44.7 |
| Veillonella montpellierensis | species | 517 | 94 | 51.8 | 61.8 |
| Rhodothermales | order | 24 | 36 | 2.4 | 23.7 |
| Gillisia limnaea | species | 586 | 114 | 58.7 | 75 |
| Tetragenococcus | genus | 601 | 107 | 60.2 | 70.4 |
| Gillisia | genus | 592 | 114 | 59.3 | 75 |
| Paenibacillaceae | family | 771 | 133 | 77.3 | 87.5 |
| Tetragenococcus halophilus | species | 101 | 55 | 10.1 | 36.2 |
| Rhodothermia | class | 24 | 36 | 2.4 | 23.7 |
| Hydrogenophilalia | class | 479 | 90 | 48 | 59.2 |
| Bifidobacterium breve | species | 431 | 82 | 43.2 | 53.9 |
| Thermosediminibacterales | order | 72 | 55 | 7.2 | 36.2 |
| Bifidobacterium choerinum | species | 654 | 117 | 65.5 | 77 |
| Bifidobacterium longum | species | 715 | 129 | 71.6 | 84.9 |
| Hydrogenophilales | order | 480 | 90 | 48.1 | 59.2 |
| Hydrogenophilus | genus | 430 | 81 | 43.1 | 53.3 |
| Rhodothermaeota | phylum | 24 | 36 | 2.4 | 23.7 |
| Bacteria | tax_rank | No Symptom Mean | Symptom Mean | No Symptom StdDev | Symptom Std Dev | Symptom Obs | No Symptom Obs |
| Porphyromonas bennonis | species | 317 | 713 | 1435.9 | 2361.1 | 43 | 288 |
| Clostridia | class | 618307 | 487672 | 199278.7 | 150542.1 | 152 | 995 |
| Insolitispirillum peregrinum | species | 8259 | 12198 | 15534.5 | 21217.5 | 96 | 593 |
| Sphingobacterium | genus | 1125 | 1590 | 1432.3 | 1764.9 | 150 | 938 |
| Sphingobacteriia | class | 29634 | 42219 | 29577.8 | 39150.6 | 152 | 995 |
| Lelliottia amnigena | species | 922 | 205 | 2676.6 | 592.2 | 38 | 301 |
| Roseburia faecis | species | 13441 | 7122 | 19243.9 | 8796.5 | 152 | 978 |
| Leptolyngbyaceae | family | 67 | 266 | 152.6 | 1051.5 | 35 | 232 |
| cellular organisms | norank | 994054 | 988395 | 9012.5 | 5355.3 | 152 | 996 |
| Opitutae | class | 142 | 315 | 447.2 | 759.3 | 79 | 604 |
| Caloramator mitchellensis | species | 8162 | 13580 | 19886.9 | 27582.2 | 145 | 925 |
| Leptolyngbya | genus | 67 | 266 | 152.2 | 1051.5 | 35 | 230 |
| Sphingobacteriaceae | family | 25959 | 37362 | 26540.8 | 35832.1 | 152 | 994 |
| Cytophagia | class | 948 | 2232 | 2899 | 11229.4 | 150 | 960 |
| Aphanizomenonaceae | family | 222 | 124 | 374.4 | 152.8 | 108 | 653 |
| Betaproteobacteria | class | 28271 | 21480 | 26518.8 | 17465.6 | 151 | 993 |
| Pseudanabaenales | order | 110 | 230 | 274 | 973.3 | 41 | 297 |
| Pseudanabaenaceae | family | 68 | 230 | 141.9 | 973.4 | 41 | 297 |
| Spirosomaceae | family | 730 | 2282 | 3089.7 | 12178.6 | 127 | 791 |
| Tenericutes | phylum | 2507 | 6395 | 5922.1 | 16841.5 | 147 | 957 |
| Puniceicoccaceae | family | 139 | 301 | 443 | 741.7 | 79 | 599 |
| Sutterella wadsworthensis | species | 6418 | 10491 | 10990.4 | 13485.8 | 108 | 636 |
| Eubacteriales | order | 614586 | 482370 | 199230.3 | 150329.8 | 152 | 995 |
| Dolichospermum | genus | 217 | 125 | 371.1 | 153.2 | 107 | 646 |
| Dialister invisus | species | 4796 | 8035 | 9328.1 | 10909.7 | 105 | 622 |
| Mollicutes | class | 2507 | 6395 | 5922.1 | 16841.5 | 147 | 957 |
| Coprococcus catus | species | 1256 | 868 | 1371 | 850 | 136 | 804 |
| Treponemataceae | family | 1604 | 5448 | 13832.3 | 32843.8 | 37 | 235 |
| Dorea formicigenerans | species | 1434 | 914 | 1591 | 1112.9 | 142 | 902 |
| Bacteroides eggerthii | species | 8545 | 15385 | 21533.5 | 30777.7 | 57 | 394 |
| Cytophagales | order | 948 | 2232 | 2899 | 11229.4 | 150 | 960 |
| Spirochaetales | order | 1551 | 5448 | 13579.1 | 32843.8 | 37 | 244 |
| Terrabacteria group | clade | 721047 | 521084 | 231350.3 | 165314.8 | 152 | 996 |
| Cytophagaceae | family | 785 | 2189 | 2917.9 | 11452.3 | 144 | 907 |
| Caloramator | genus | 8859 | 14126 | 20084.9 | 27641.6 | 151 | 972 |
| Spirochaetes | phylum | 903 | 3743 | 10120 | 27201.3 | 54 | 441 |
| Emticicia | genus | 784 | 2553 | 3286.6 | 12937.6 | 112 | 693 |
| Leptolyngbya laminosa | species | 66 | 266 | 152.8 | 1051.5 | 35 | 228 |
| Burkholderiales | order | 27963 | 21305 | 26363.5 | 17380.9 | 151 | 993 |
| Pedobacter | genus | 8642 | 13041 | 10106 | 17703.6 | 151 | 980 |
| Burkholderiaceae | family | 361 | 197 | 598.7 | 409.8 | 135 | 886 |
| Eubacteriales incertae sedis | norank | 375 | 161 | 837.1 | 256.6 | 139 | 895 |
| Butyrivibrio proteoclasticus | species | 496 | 203 | 1108.1 | 350.5 | 89 | 657 |
| Dolichospermum curvum | species | 201 | 97 | 393.5 | 137.7 | 87 | 505 |
| Desulfovibrio fairfieldensis | species | 720 | 263 | 1789.3 | 508 | 43 | 284 |
| Bacteroidaceae | family | 300654 | 238983 | 181167 | 141573.4 | 152 | 995 |
| Bacteroidia | class | 426327 | 369089 | 188681.8 | 168273.3 | 152 | 995 |
| Acidaminococcus | genus | 984 | 2304 | 4664.6 | 9773.8 | 105 | 707 |
| Bacteroidales | order | 426327 | 369089 | 188681.8 | 168273.3 | 152 | 995 |
| Spirochaetaceae | family | 1598 | 5448 | 13805.7 | 32843.8 | 37 | 236 |
| Porphyromonas asaccharolytica | species | 314 | 1553 | 970.4 | 8744.8 | 43 | 238 |
| Erysipelotrichaceae | family | 6385 | 3475 | 10831.8 | 4414.9 | 152 | 993 |
| Roseburia | genus | 30033 | 19201 | 34050.4 | 17905.1 | 152 | 991 |
| FCB group | clade | 448905 | 391426 | 199421.4 | 186334 | 152 | 996 |
| Dialister | genus | 4668 | 7912 | 9234.3 | 10868.1 | 107 | 646 |
| Lachnospiraceae | family | 219269 | 176420 | 109155.3 | 81234.8 | 152 | 995 |
| Cerasicoccus | genus | 249 | 650 | 650.7 | 1037.4 | 34 | 250 |
| Sphingobacteriales | order | 29634 | 42219 | 29577.8 | 39150.6 | 152 | 995 |
| Eubacteriaceae | family | 3543 | 1555 | 7588.1 | 4328.8 | 152 | 989 |
| Synechococcaceae | family | 68 | 230 | 141.6 | 973.4 | 41 | 299 |
| Acidaminococcus intestini | species | 300 | 799 | 1051.3 | 2292.1 | 37 | 222 |
| Acholeplasma hippikon | species | 426 | 812 | 1052.5 | 2058.9 | 35 | 260 |
| Treponema | genus | 1604 | 5448 | 13832.3 | 32843.8 | 37 | 235 |
| Firmicutes | phylum | 657764 | 502820 | 205065.5 | 155846.7 | 152 | 997 |
| Caloramator indicus | species | 373 | 1065 | 2091.5 | 3540.5 | 44 | 373 |
| Faecalibacterium prausnitzii | species | 100109 | 141766 | 77192.1 | 87778 | 152 | 986 |
| Spirochaetia | class | 903 | 3743 | 10119.8 | 27201.3 | 54 | 441 |
| Prevotella stercorea | species | 5077 | 10010 | 18648.5 | 25185.5 | 54 | 406 |
| Insolitispirillum | genus | 8259 | 12198 | 15534.5 | 21217.5 | 96 | 593 |
| Emticicia oligotrophica | species | 785 | 2553 | 3291.1 | 12937.7 | 112 | 691 |
| Lelliottia | genus | 922 | 205 | 2676.6 | 592.2 | 38 | 301 |
| Sphingobacterium bambusae | species | 316 | 506 | 452.1 | 1018.8 | 140 | 825 |
%7D%7BN%7D%7D%7D&bg=ffffff&fg=000000&s=0)


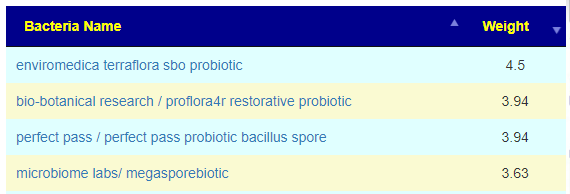
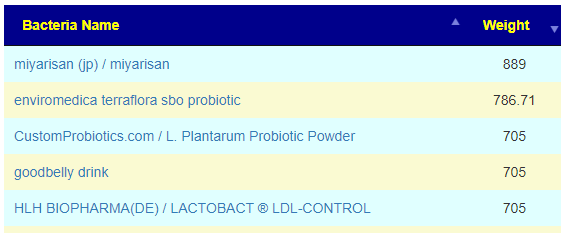
 Have you seen it anywhere? Also how would one figure out the dose for gut bacteria shifting?
 …I also have prescript on hand BUT that has a lot of other SBO strains. Would you stuck to TERRAflora for now?
Recent Comments