Bacteria are like people, they interact and are influenced. The problem is how to detect the interactions that are clinically significant and the direction of interaction without grabbing stereotypes (i.e. all Italians belong to the Mafia, Irish are lazy, Egyptians are all Islamic Terrorists, etc).
We are going to look at two bacteria interacting: Phocaeicola massiliensis and Paraprevotella
To see the results for other bacteria, look up your favorite bacteria MicrobiomePrescription : Look up a bacteria taxa. See video at bottom for walk through.
The Classic Way
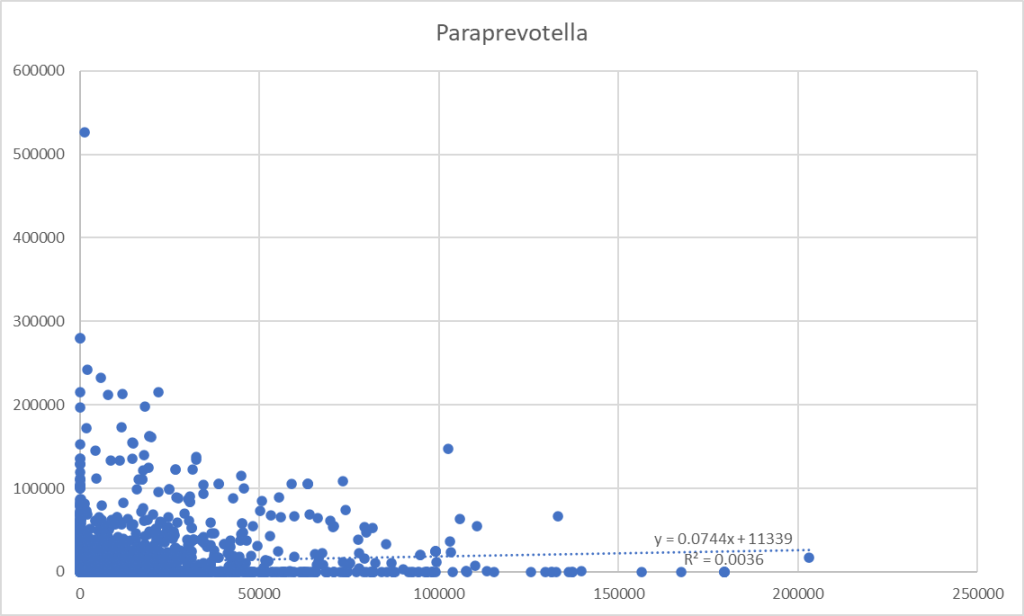
From a collection of samples, we pull all samples that report both bacteria. We take these numbers and drop them into a tool like Excel. Chart the data and try to do a linear regression. This is often pro-forma in research papers because that is rote learning.
A Uniform Way
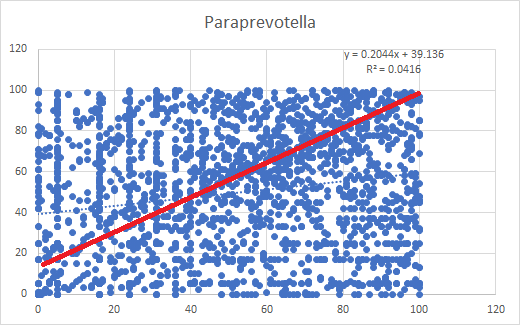
This is almost the same, except we do not use the actual numbers, but the percentile rankings. This produce stronger regressions values Using the percentile transform the data to a uniform distribution. R2 increased by 10 fold but really a long away from significance.
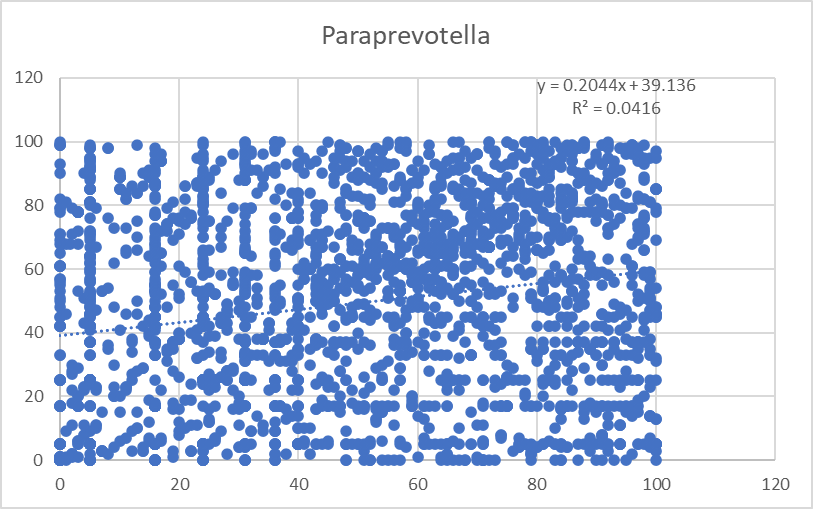
You can almost see signs of a trend in the middle of lots of noise.
A Non-parametric Way
We use classic Chi2. The process is simple
- For bacteria A we determine the percentage with a value of 100 or higher, say 5%
- For bacteria B we determine the percentage with a value of 1000 or higher, say 5%
- We filter the samples to those with bacteria A being higher than 100
- If there are no interactions than we expect 5% of bacteria B to be 1000 or more.
- If we find that 30% of bacteria B is more than 1000, then it appears that high Levels of A results in higher levels of B
From the above we can compute a statistics,Chi2, and thus the statistical significance. In this case, very very significant.
This means that we isolate the impact of high values and low values which the earlier methods did not do, We do not know how the middle value interact but for clinical issues, it is abnormally high and abnormally low values that are of interest.
Implementation
The first question is to pick the high and low threshold values. People can pick arbitrary values and try them. I have my own preference a patent pending algorithm to produce ranges.
The second question or issue is the number of computations. People can download my data set from https://citizenscience.microbiomeprescription.com/ and do the same calculation.
The number of calculations to be done were done in the following datasets with 5%ile and above, and 95%ile and above. The bigger the sample, the better sensitivity and more interactions likely to be discovered.
- All: 5,191,562 possible pairs on 5189 samples –> 1,270,000+ Interactions found
- Biomesight: 1,717,410 possible pairs on 2534 samples –> 275,000+ Interactions found
- Ombre: 1,743,720 possible pairs on 1540 samples –> 220,000+ Interactions found
- uBiome: 132,860 possible pairs on 791 samples –> 4,700+ Interactions found
For each pair of taxa we have 4 scenarios (Low versus Low, Low vs High, High vs High, High vs Low) Or about 32 million queries retrieving data sets and performing calculations. The bigger the sample size, the more items that are likely to be identified. For thresholds, we use a patent pending algorithm that appears to yield good results (shown above). The alternative would be to enumerate percentages and find the ones that work best (so 100 x 100 x 32 million = 320,000,000,000 queries).
Illustration of the code is below.
Select Sum(Case when c1.Percentile < 19.274700171330668
                  /* 577309 Low Percentile Threshold*/
           then 1 else 0 End) Obs, /*Low Count that is filtered sample */
         Count(1) Cnt, /*Filtered sample Count*/
         cast(Count(1) * 19.274700171330668/100 as float) [Expected Value]
from UserCounts c1 Join Usercounts c2
on C1.sampleId=c2.sampleId
And C1.taxon=204516
And C2.Taxon=577309
Join Users U on C1.SampleId=SequenceId
Where c2.Percentile < 12.890741292051205 /* 577309 Low Percentile Threshold*/
Group by C1.Taxon,C2.Taxon| dependent | independent | Label | Obs | Direction | Expected | Chi2 | % |
| 204516 | 577309 | L,L | 158 | > | 79 | 98.5 | 200% |
| 204516 | 577309 | L,H | 204 | < | 238 | 6 | 86% |
| 204516 | 577309 | H,L | 138 | < | 202 | 39.5 | 68% |
| 204516 | 577309 | H,H | 724 | > | 609 | 43.1 | 119% |
| Phocaeicola massiliensis | Paraprevotella |
There is a question of using Chi2 or using the percentage increased or decreased.
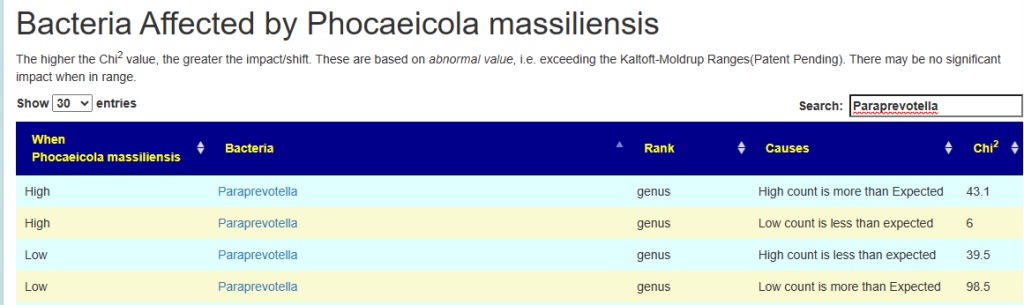
Example:
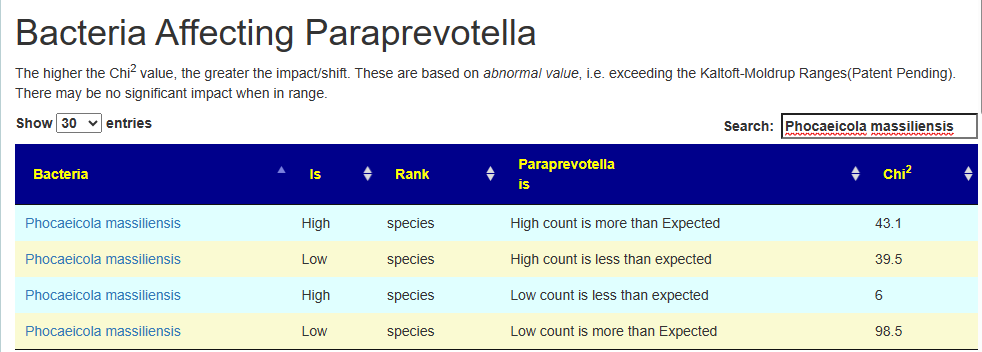
- High Paraprevotella, we get more high count and less low count of Phocaeicola massiliensis. In other words Phocaeicola massiliensis numbers increase as a result (i.e. median likely moved up).
- Low Example: Paraprevotella, we get less high count and more low count of Phocaeicola massiliensis. In other words Phocaeicola massiliensis numbers decrease as a result (i.e. median likely moved up).
Looking at doing linear regression, we do not see the relationship.
| Chi2 Low | Chi2 High | Number of Interaction Found |
| 6 | 50 | 1427931 |
| 50 | 150 | 301973 |
| 150 | 250 | 35584 |
| 250 | 350 | 7966 |
| 350 | 450 | 3172 |
| 450 | 550 | 1303 |
| 550 | 649 | 695 |
| 950 | 1050 | 610 |
| 650 | 750 | 505 |
| 750 | 850 | 483 |
| 851 | 950 | 376 |
| 1051 | 1150 | 349 |
| 1250 | 1350 | 223 |
| 1150 | 1250 | 218 |
| 1350 | 1450 | 213 |
| 1551 | 1650 | 158 |
| 1450 | 1549 | 153 |
| 1651 | 1750 | 141 |
| 1850 | 1949 | 138 |
| 1751 | 1847 | 126 |
| 1950 | 2050 | 98 |
| 2050 | 2150 | 83 |
| 2150 | 2249 | 68 |
| 2252 | 2348 | 64 |
| 2350 | 2449 | 56 |
| 2451 | 2548 | 33 |
| 2551 | 2650 | 31 |
| 2951 | 3043 | 28 |
| 2753 | 2845 | 27 |
| 2659 | 2741 | 27 |
| 3057 | 3150 | 26 |
| 3153 | 3242 | 23 |
| 3253 | 3348 | 20 |
| 2856 | 2949 | 19 |
| 3862 | 3948 | 18 |
| 3365 | 3450 | 16 |
| 4057 | 4141 | 14 |
| 3470 | 3548 | 12 |
| 3752 | 3842 | 12 |
| 3555 | 3625 | 9 |
| 3652 | 3749 | 8 |
| 3956 | 4046 | 8 |
| 4162 | 4248 | 6 |
| 4278 | 4329 | 3 |
| 4867 | 4905 | 3 |
| 5763 | 5782 | 2 |
| 4373 | 4423 | 2 |
| 5102 | 5139 | 2 |
| 4771 | 4771 | 1 |
| 5189 | 5189 | 1 |
| 4737 | 4737 | 1 |
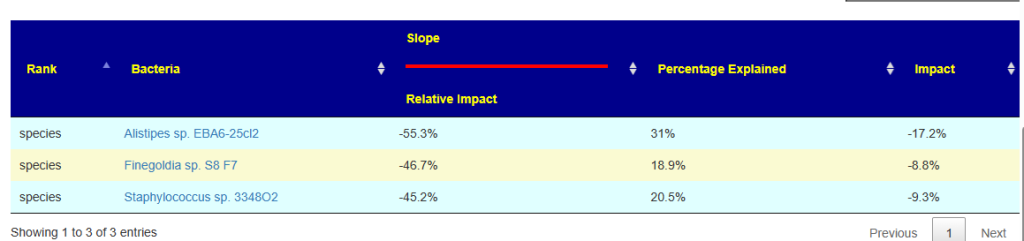
Next Project
Many taxa shifts have nothing in the literature affecting the taxa for use in a clinical context. Identifying taxa with a strong interaction that we can affect should allow us to indirectly influence the target taxa. Yes, gets complex but with modern computer power, very possible to do.
2 thoughts on “Bacteria interacting with Bacteria”
Comments are closed.