For over a year I have made donated data available at: http://lassesen.com/ubiome/ . I would hope that anyone using open source software project to also be open data.
This post deals with exporting the taxon, continuous and category data to a csv file format suitable for importing to R or Python for data exploration. The program code is simple (with all of the work done in the shared library).
The last post dealt with importing public data from my web site. My hope is that there will be open sourcing of data between sites derived from my open source code base.
With donated data, there are a few items that we need to make sure we do not share. We should not share:
Time series data for any person –> so dates are always the export date.
We make sure that there is apparent way to connect one sample to another.
We do the export and import by writing or reading XML via DataSets. We convert all Ids in the source to GUIDs to prevent accidental mixing source and destination IDs. This also mask sequence information, a desired characteristic for sharing data.
A key factor are the new SyncGuid column which provides a unique identifier across the multiple sites for a particular lab or report.
The C# code is very simple (the SQL does go thru some complexity to get the export data matching the import data from my last post).
static void Main(string[] args)
{
    var exportName = "some site";
    var filename = "MyExport";
    if (args.Length > 0) exportName = args[0];
    if (args.Length > 1) filename = args[1];
    DataInterfaces.ConnectionString = "Server=LAPTOP-BQ764BQT;Database=MicrobiomeV2;Trusted_Connection=True; Connection Timeout=1000";
    var schemaFile = new FileInfo($"{filename}Schema.xml");
    var exportFile = new FileInfo($"{filename}.xml");
    var export = DataInterfaces.Export(exportName);
    export.WriteXmlSchema(schemaFile.FullName);
    export.WriteXml(exportFile.FullName);
}
Source for C#: https://github.com/Lassesen/Microbiome2/tree/master/Export
Source for DB Schema: https://github.com/Lassesen/Microbiome2/tree/master/DBV2
I have done open sharing of data at http://lassesen.com/ubiome in formats designed for data science import and processing. In this post, I taken some of this data and make it uploadable to our new database schema. I will also work on utilities to allow data to be exported and shared going forward. If you get data donated on your site (AND you obtain consent for sharing the data anonymously) remember to share it with other citizen scientists.
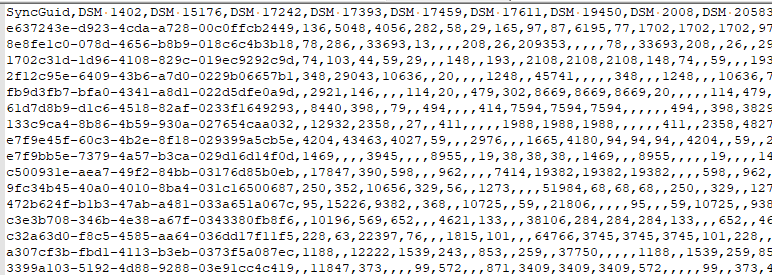
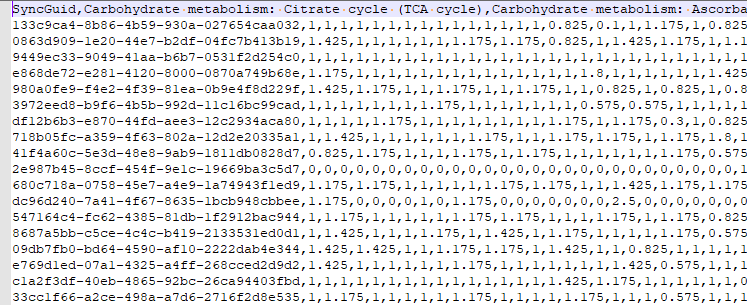
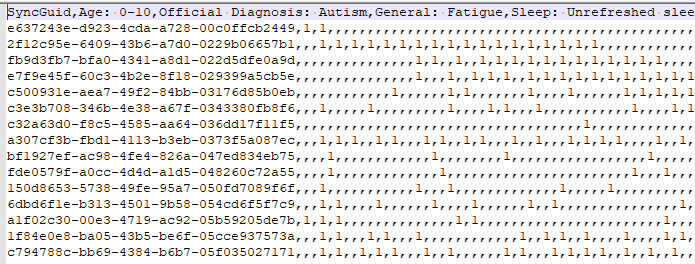
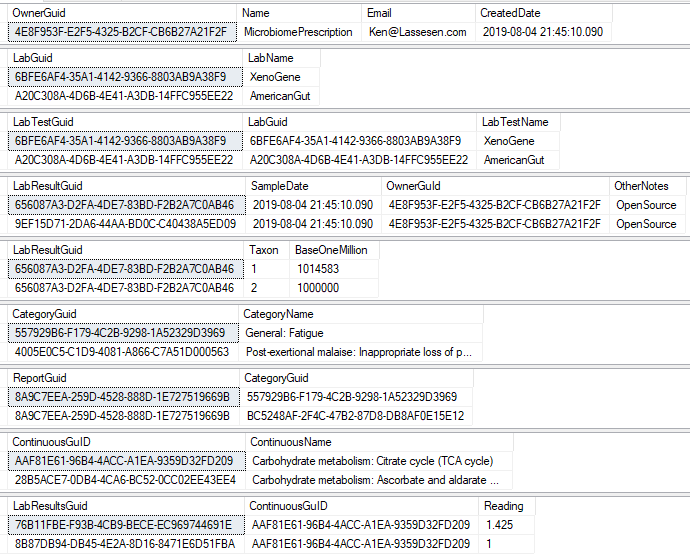
There are a series of tables that needed to be exported and then imported. The contents of the export is illustrated below. Note: Guid in the export will be converted to an Id by the import.
To deal with some issues (and to support interchange of data between people using this open source, I added two GUID columns. This means that every sample uploaded to a site, or report given to a site is unique and may be exchange between sites without duplicates. If the same microbiome report is uploaded to multiple sites, then there will be duplicates — until you de-duplicate the data (see this earlier post).
The process is simple:
Bring in all of the reference data (Continuous, Category, Labs, LabTests definitions) using their names as keys to prevent duplication
Import the lab and other results — using SyncGuid to prevent duplication.
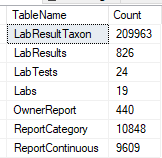
This is done by passing the XML from one site to a stored procedure (using Datasets) and then processing it. It is important to test the code to insure that the same data being imported multiple times does not result in extra rows. The TSQL below gives the counts on key tables.
Select 'LabResultTaxon' as TableName, Count(1) as Count from LabResultTaxon
UNION
Select 'LabResults' as TableName, Count(1) as Count from LabResults
UNION
Select 'LabTests' as TableName, Count(1) as Count from LabTests
UNION
Select 'Labs' as TableName, Count(1) as Count from Labs
UNION
Select 'OwnerReport' as TableName, Count(1) as Count from OwnerReport
UNION
Select 'ReportCategory' as TableName, Count(1) as Count from ReportCategory
UNION
Select 'ReportContinuous' as TableName, Count(1) as Count from ReportContinuous
Example – your numbers should be around these
After the import, you should recalculate core statistics for each LabTest type (see this post for a reminder). Every thing has been rolled into the Library, so the program is very short (but the library code and tSQL code is not).
var import = new DataSet();
import.ReadXmlSchema(schemaFile.FullName);
import.ReadXml(exportFile.FullName);
DataInterfaces.ConnectionString = "Server=LAPTOP-....";
DataInterfaces.Import(import);
LabTests.ComputeAllLabs(4);
Source for Importer: https://github.com/Lassesen/Microbiome2/tree/master/Import
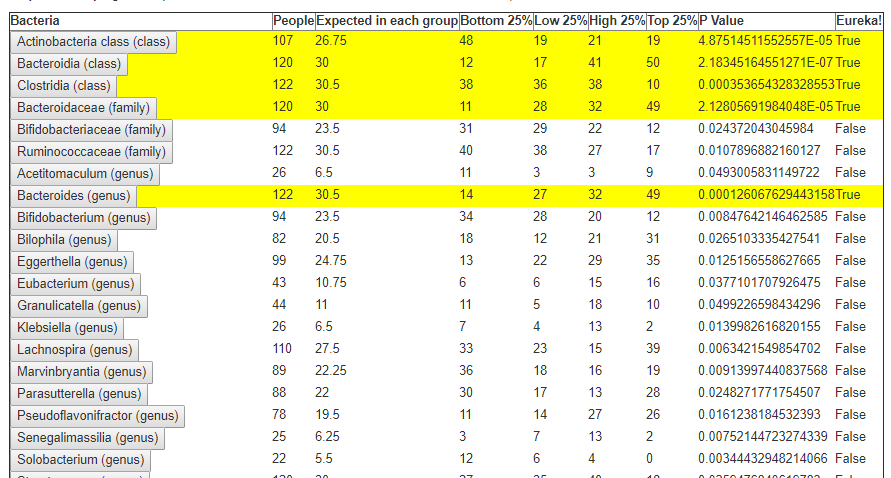
As we have seen, the microbiome is NOT a normal or bell curve. I struggled for almost a year trying to get statistical significance out of the data with parametric techniques. While I did get some results, the results were disappointing. When I switched to a non-parametric approach, I shouted EUREKA (without becoming a streaker thru town, unlike a certain ancient greek did).
In the last post we dealt with both continuous and category factors associated with a person. In terms of my existing site, using symptom explorer you will see tables such as the one shown below with used 4-quantilies.
In our earlier post on statistics, we saw how we can compute the quantiles for the available taxonomy. In this lesson we will use that data plus a category variable to detect significance as shown above in real time. This means that the results may change as more data is added — to me, this makes it a living research document.
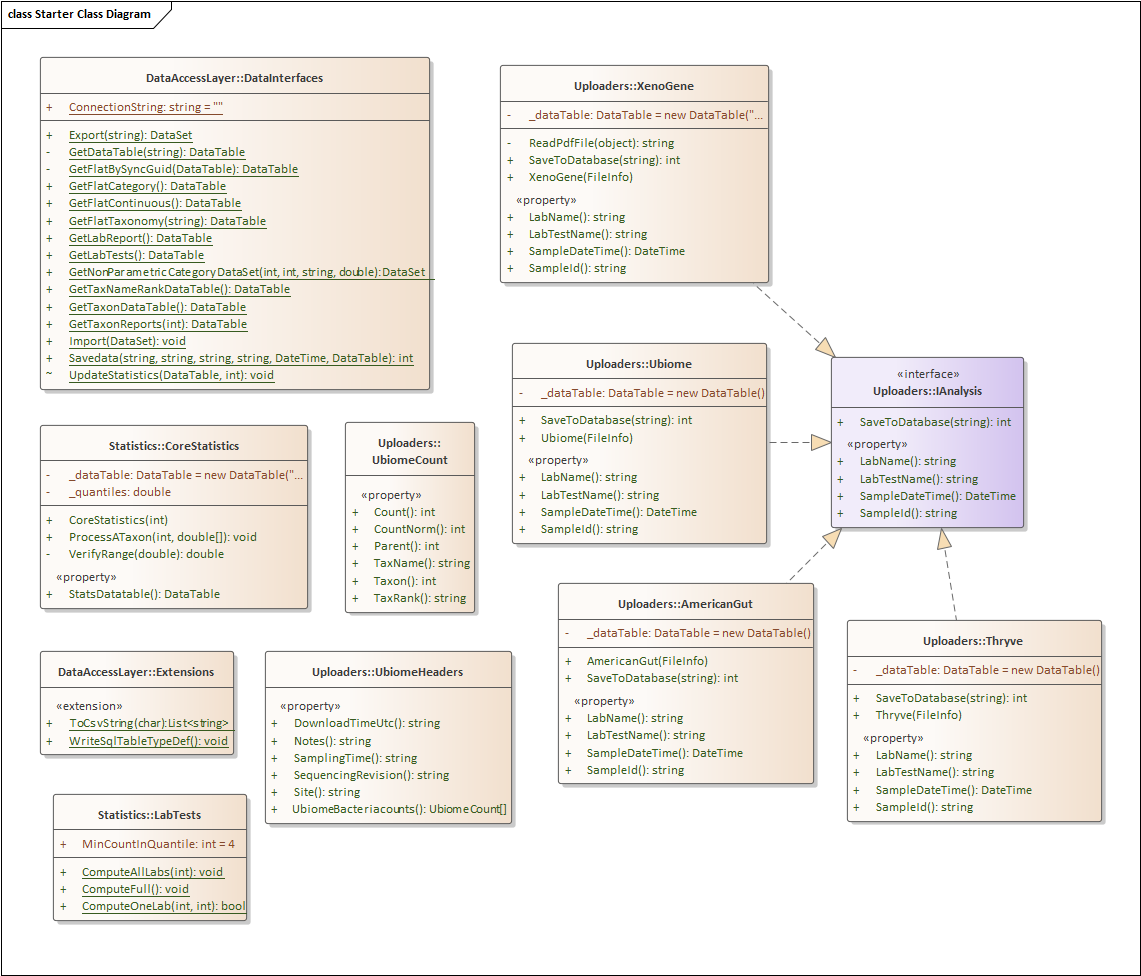
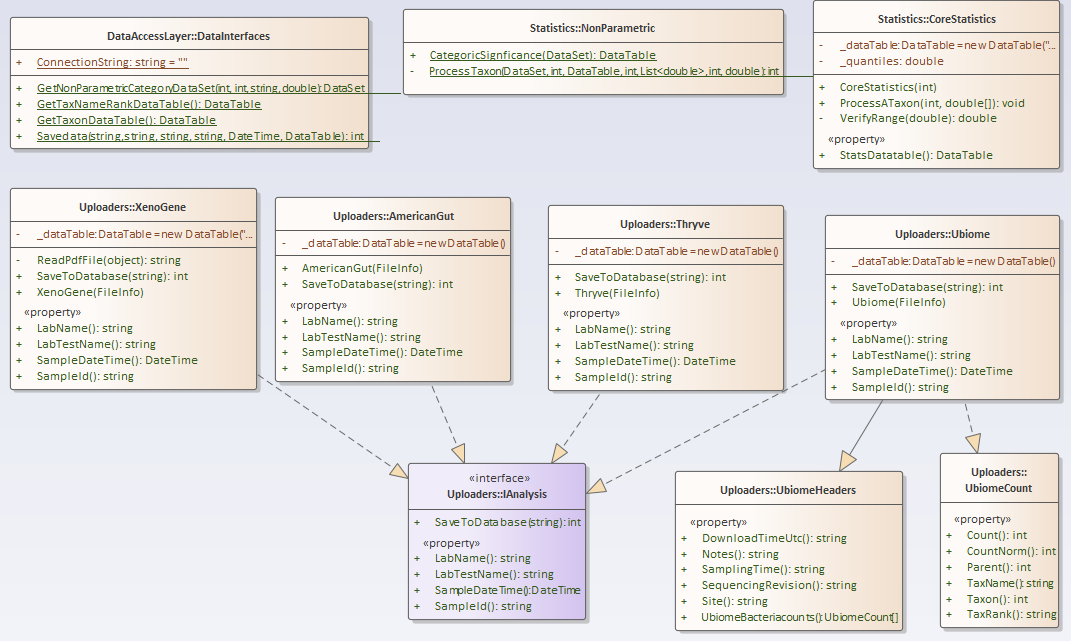
First the Nerd Stuff — Moving to Libraries
For this example, I have consolidated into a library most of the key stuff from prior posts. The class diagram is below. I plan to keep expanding it with future posts.
This is done by selecting a LabTest (remember that technically we cannot compare uBiome numbers to XenoType numbers to Thryve numbers) and then some Category. I opted not to go down the control group to category group path because with my donated data, it is not reliable. I opted to go down the population to category group path, which while technically less sensitive — it is a reasonable approach.
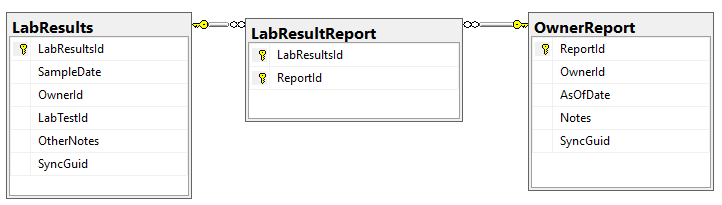
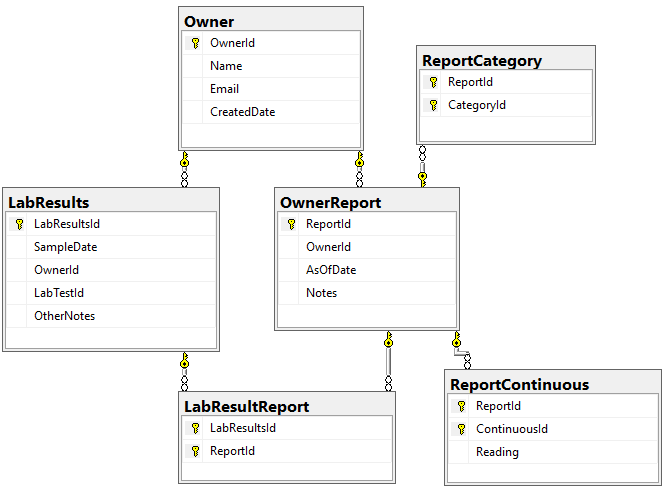
We need to associate Category and Continuous Reports to Lab Results and this means just adding one new table LabResultReport as shown below, it links two timeline items together.
From the @LabTestId and @CategoryId we just need to select which quantile to use. Did we divide data into 3,4,5,6,7 etc. buckets. If you look at the prior post, we see that it is easy to select which one, “Q3_”, “Q4_”, etc is the @quantileRoot. We need one more value: @MinSamples – if we do not have at reasonable number, there is almost no change of getting significant. I usually require 4 data points per bin — so Q3_ -> 12, Q4_-> 16, Q5->20.
Passing these number to a stored procedure, we get a dataset back as shown below:
Quantiles
Taxon
Count
StatisticsValue
StatisticsName (i.e. Q3_1,Q3_2 or Q4_1,Q4_2,Q4_3 etc)
User Data
Taxon
Value
Taxon Data
Taxon
TaxonName
The process is simply counting the data in User Data in each range and then applying some simple statistics to get P Values.
In terms of the calling program, the code is very simple:
var data = DataInterfaces.GetNonParametricCategoryDataSet(1, 1, "Q4_", 20);
var matrix = MicrobiomeLibrary.Statistics.NonParametric.CategoricSignficance(data);
matrix.WriteXml("Matrix.xml");
I just dump the data to a file for simplicity sake. You can open this file via excel to get a nice spreadsheet.
For myself, I wrote a long running (24hrs) program that iterated thru the range of values for Categories (and combinations of categories!) with different quantiles.
When we work with Continuous variables, we need to convert the ranges into quantiles (just like we did for taxon). This could be done using the ranges we entered, or by breaking into quantiles. Personally, using quantiles would be my preference because too many numbers are not bell/normal curves but are assumed to be just that. I will leave people to do pull requests with their code suggestions.
We have a microbiome, we have lab results, we have official conditions (ICD), we have symptoms. Last, we have substances (for example, probiotics) that modify the microbiome and thus may alter:
lab results
official condition status (i.e. mild, severe, acute)
microbiome
symptoms (one symptom may disappear or appear)
Information on expected impact of the above come from medical studies.
The typical question is “What should I take to improve {lab results|symptoms|official diagnosis|microbiome}?” The response should be typically, “Base on study A,B,C,K, you should take X to improve {lab results|symptoms|official diagnosis|microbiome}? “
The answers may come indirectly and may be by inference. For example:
I wish to improve my diabetes.
Severity of diabetes is connected with high A bacteria and low B bacteria and high levels of TNF-alpha
Substance X has no published studies for diabetes
Substance X has published studies for decreasing A and not altering B.
Substance Y has published studies for increasing B and not altering A but it does reduce TNF-alpha levels.
The inference is that you should consider taking X and Y to improve your diabetes. In some cases, you may find something like:
I wish to improve my mother’s Alzheimer’s Disease.
Severity of Alzheimer’s Disease is connected with high A bacteria and low B bacteria.
Substance X and Y has published studies for Alzheimer’s Disease showing positive results
Substance X has published studies for decreasing A and not altering B.
Substance Y has published studies for increasing B and not altering A.
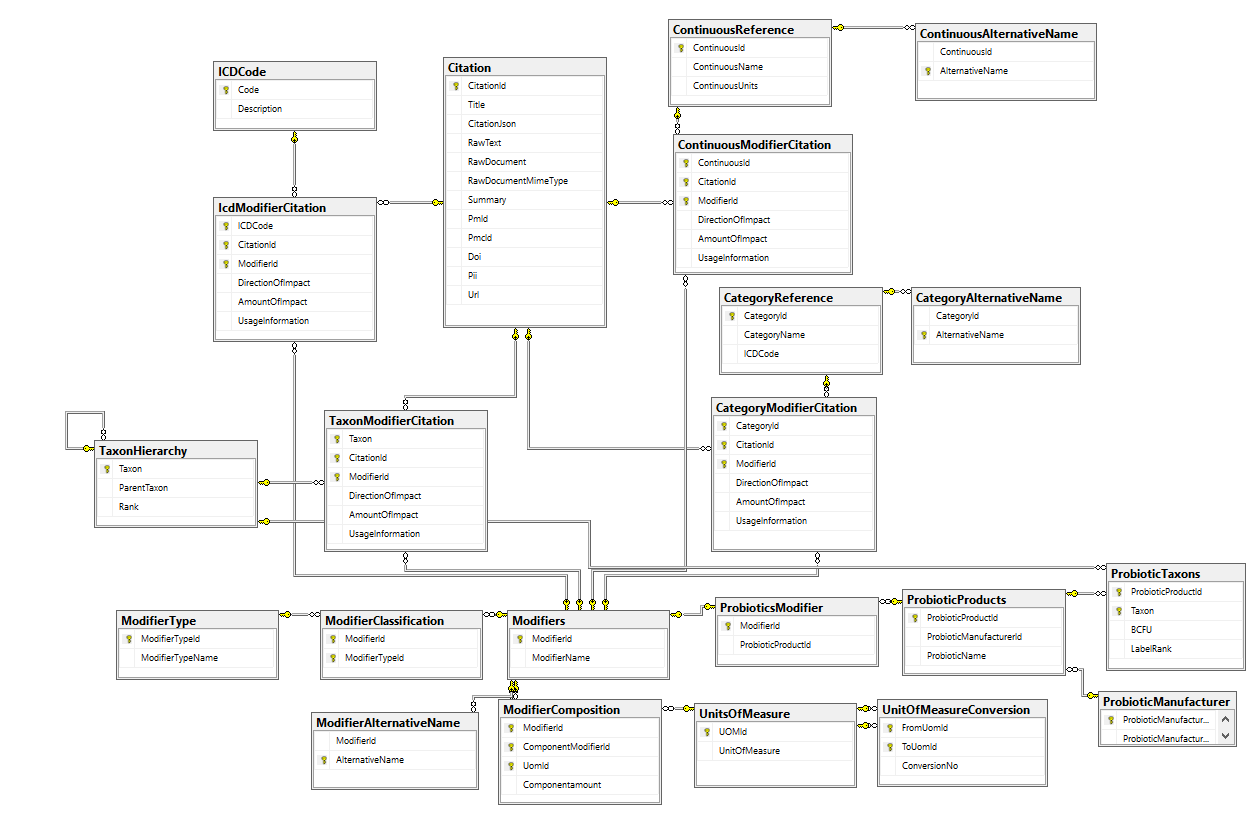
The database schema below attempts to capture this information from citations (studies).
Let us look at what information may be in a study and map the information to tables (following are made up study results for illustrations)
Salted Herrings at 20gm/day improves IBS from Study A
Modifier: Salted Herring
Citation: A
ICDCode: IBS
ICDModifierCitation
DirectionOfImpact: +1
AmountOfImpact: NULL — nothing reported
UsageInformation: 20gm/day
Same study found TNF-Alpha Increases by 20% above control
Confinuous Reference: TNF-Alpha
ContinousModifierCitation:
DirectionOfInpact: +1
Amount of Impact: 1.2 (1 being no change)
UsageInformation: 20gm/day
Same study found Asthma Disappear in 30% of patients
CategoryReference: Asthma (Yes or No remember)
ContinousModifierCitation:DirectionOfInpact: -1
Amount of Impact: 0.8 (1 being no change)
UsageInformation: 20gm/day
Same study found Sillium bacteria increased in patients
TaxonHierarchy: Sillium
TaxonModifierCitation:DirectionOfInpact: +1
Amount of Impact: nothing reported
UsageInformation: 20gm/day
So the results of one study ended up with entries in 4 tables.
We have a lot of possible inferences here:
Sillium impacts TNF-Alpha
Low Sillium may be associated with Asthma
All of this stuff becomes facts in our Artificial Intelligence/Expert System engine which I will cover in a few weeks.
Alternative Names
Alternative names is actually critical for text mining (i.e. having programs determine if there is important data is a study, paragraph or sentence). Studies may use a multitude of names for the same thing. For example, you may decided to use the latin name for herbs, Hypericum perforatum and then have the alternative names “St. John Wart” and “Saint John Wart”. The alternative names should be unique, hence the unique index is placed on this column.
Bottom Line
Above is the full solution, I have only partially implemented it and the only one of the table that I have been populating has been TaxonModifierCitation. Readers have asked question about TNF-Alpha, Interleukin 10 (IL-10), also known as human cytokine synthesis inhibitory factor (CSIF). My own resources could only stretched to review and processing this table. Ideally, a crowd-source efforts (or a wealthy patron to have Ph.D. students) would allow the full solution to be populated.
We have implemented a microbiome reference from ncbi data
We have implemented a medical condition reference from ICD
We have implement the ability to store personal microbiome values.
We have implement the computations on microbiome values (including non-parametrics, i.e. quantiles).
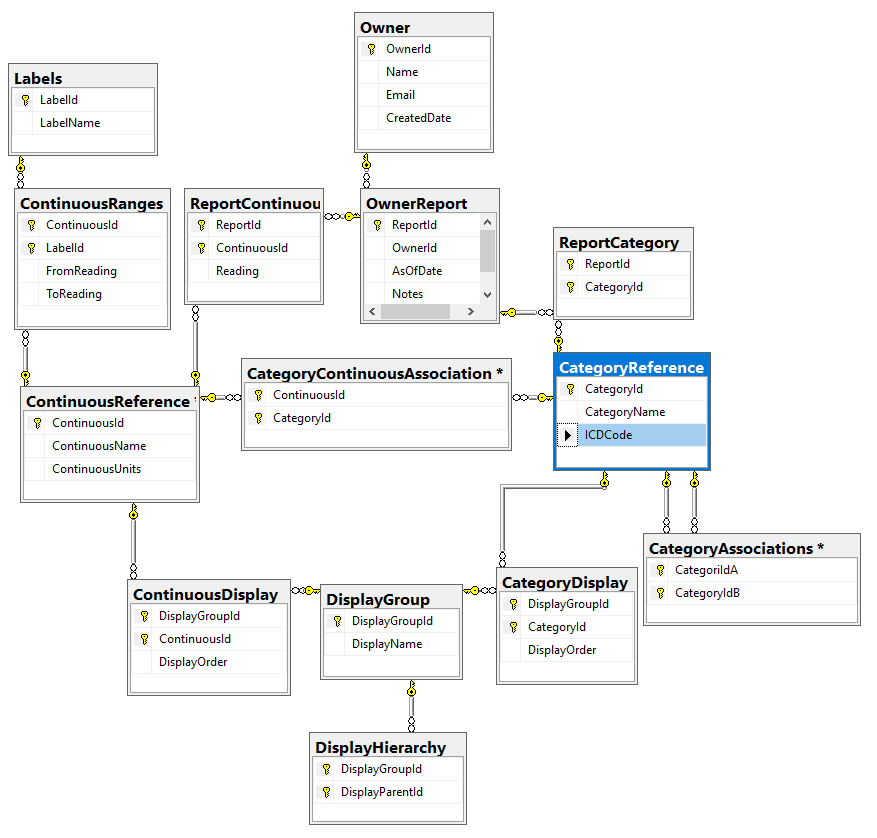
In this post we will look at storing personal medical conditions, lab results and symptoms. Medical parameters change over time, we need to date when these parameters is in effect (just like we date when microbiomes are done). All of the information at a particular time is a Report. I have my draft database diagram below (the SQL is uploaded at
We are also going to add two more reference types which are up the user to define. There is no reference sources for these like we have for ICD and NCBI.
At the data modelling level these reference types are:
Categoric, effectively Yes or No
Do I have this ICD diagnosis?
Do I have this symptoms?
Am I a male or female?
Continuous
What is my C-Reactive Protein result?
What level is my Vitamin 1,25 D
How old am I
I call these items: Continuous Factors and Category Factors. For processing simplicity, instead of giving a choice for eye color of {Brown, Hazel, Blue, Green, Gray, Amber etc) – each is an independent choice (in the database). You could group them in the DisplayGroup as ‘Eye color’ and in the user interface allow only one to be chosen (although some people do have different color eyes!)
You will note that ICDCode is an optional column Category because I expect most sites will only use a subset of them. Having an Id (Integer) makes processing a lot easier for some non-parametric techniques.
Also note that we have Associations, for example, you may to wish to associate certain symptoms with IBS or IL-10 levels with Chronic Fatigue Syndrome. Thus if someone selects IBS, you may wish to present a short list of appropriate symptoms to select from (more on that in a later post – I did a patent filing on that approach years ago).
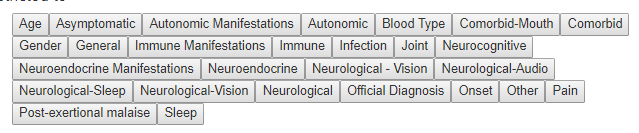
For the above tables we may wish to classify or group items for the sake of display. With this number of reports (from C-Reactive Protein to Brain Fog to DNA mutations) organizing the presentation on a web site can be a challenge.
On my current implementation, you will see that I have broken things into two large groups:
Symptoms
uBiome metabolism numbers
For symptoms, I ended up adding an additional layer as shown below. There can be poor UI designs – for example, hitting a person with 300 sequential questions often we result in the questions being only partially completed.
One way of handling a UI hierarchy
For common lab tests, I would suggest using Lab Tests Online as a starting point — remember each laboratory uses slightly different processes and have different reference ranges.
Continuous ranges also have ranges of values (with labels, for example on age: Infant 0-2, Toddler 2-5, Child 5-10, PreTeen 11-12 etc; or for other items: High, Normal, Low). The ranges help with interpretation and may often be used for the first cut with non-parametric techniques.
For symptoms, I strongly suggest for any ICD diagnosis, you search the web for symptoms often seen with each condition.
Bottom Line
Unlike prior tables where we can populate from prepared sources, we have to research, select and populate the table by hand. This can be a time consuming process to do right. Similarly, getting the user interface right is also time consuming.
Humans are human. Often a sample will get uploaded multiple times (perhaps the spouse uploaded the same data). Duplicate sample data can generate bias. In this post I will look at detecting duplicates and then eliminating all of them except for one (the last one uploaded). This is a recommended step before computing statistics as discussed in this prior post.
So how do you detect duplicate dataset easily? As a long time SQL developer I can think of some complex left joins and other pain, but as a statistician there is a simple elegant cheat – use standard deviation of the count column to create a hash that uniquely (at least until you get a few billion samples) identifies a sample.
Create Proc RemoveDuplicateUploads As
Declare @Rows int =1
Declare @ToDelete as Table (LabResultsId int)
While @Rows > 0
BEGIN
	Insert into @ToDelete(LabResultsId)
	Select Min(OldestId) From (
		SELECT R.[LabTestId],Min(T.LabResultsId) as oldestId
		, Cast(1000 * STDEV([BaseOneMillion]) as Int) as Hash
		FROM  [dbo].[LabResultTaxon] T (NOLOCK)
		JOIN [dbo].[LabResults] R (NOLOCK)
		ON T.LabResultsId=R.LabResultsId
		Group By R.LabTestId ) HashTable
	Group by Hash, LabTestId Having Count(1) > 1
	-- We cycle until we have deleted all
	SET @Rows=@@ROWCOUNT
	-- We need to delete the taxon before the test
	Delete from [dbo].[LabResultTaxon] Where LabResultsId in (Select LabResultsId from @ToDelete)
	--Now delete the test
	Delete from [dbo].[LabResults] Where LabResultsId in (Select LabResultsId from @ToDelete)
 END
The steps explained:
First we get a hash for each test’s measurements (as Hash)
Then we find all of the test data for a specific test that have the identical Hash and we have 2 or more tests with those values
We insert the OLDEST TestId into a table
We then delete the Taxon level data
We then delete the Test level data (we can’t delete the test and it’s data is deleted).
Once that is done, we repeat because there may be more duplicates – remember we only removed the oldest one.
That’s it. A needed cleanup of donated data to keep our data clean and unique.
Recent Comments