Post-Covid19 Syndrome

Most of the Post-Covid19 Syndrome symptoms has a strong match to the symptoms seen with Myalgic encephalomyelitis/chronic fatigue syndrome (ME/CFS). This condition has no conventional medical treatment known. Treatments attempt to mitigate symptoms.

There is evidence that some people develop a long-term fatigue syndrome from coronavirus infections, Dr. Anthony Fauci said Thursday.

“There may well be a post-viral syndrome associated with Covid-19,” Fauci told a news conference organized by the International AIDS Society. The group is holding a Covid-19 conference as an add-on to its every-other-year AIDS meeting.

Fauci said the symptoms resemble those seen in patients with myalgic encephalomyelitis, or ME, once known as chronic fatigue syndrome.

“If you look anecdotally, there is no question that there are a considerable number of individuals who have a post-viral syndrome that in many respects incapacitates them for weeks and weeks following so-called recovery,” Fauci said.CNN

I am very familiar with ME/CFS as anyone who knows my story can attest. And I believe that while the model of why these symptoms are there is simple, the treatment is complex, not cookbook and must be individualized for each person.

This image has an empty alt attribute; its file name is image-8.png
Persistent Symptoms in Patients After Acute COVID-19

The Model

COVID19 sends out chemical signals to the body to produce chemicals (metabolites) that its need OR which create a friendlier environment for it. The signals alters the microbiome (gut bacteria) to be a factory for its needs (Viralforming the gut). Once COVID is eliminated, the alterations should return to the prior state overtime— unfortunately a percentage that take a long time or never return. The best documented example is the Bergen’s Giardia Infection.

“Gastrointestinal symptoms are common in patients with COVID-19, and had an increased prevalence in the later stage of the recent epidemic in China. SARS-CoV-2 enters gastrointestinal epithelial cells, and the faeces of COVID-19 patients are potentially infectious.”Review article: gastrointestinal features in COVID-19 and the possibility of faecal transmission

The microbiome consists of many co-operations between bacteria. Often there are over 2000 bacteria involved in various dialogs. Identifying the bacteria that are at abnormal (too high or low) is the start. The next step is modifying the bacteria by drugs, diet, supplements. At this point, we need to point out that there may be 100 or more abnormal bacteria that needs to be adjusted. Naive adjustments may make more bacteria abnormal.

My Proposed Process

This is the process that I have done with ME/CFS and it is likely that it may also work for many people with post-covid syndrome:

  • Obtain a 16s analysis from an appropriate source
  • Look at the suggestions for correcting and make appropriate changes
  • Two+ weeks after making changes, repeat the 16s analysis and make the next set of changes.

This is an iterative process. Often the suggestions will cause one symptom to lessen or disappear while leaving others untouched. This is to be expected.

For more information, see

BiomeSight (UK) is now integrated with Microbiome Prescription

Rose Walbrugh and I are proud to announce one click sending of data from BiomeSight.com based in the UK to MicrobiomePrescription.com. After you get your BiomeSight data processed, you can send the data across without needing to download and upload. You will be sent an email with an automatic login link (no more making up and remembering passwords!).

How to Do It and get Expert System Suggestion

Log in to Biomesight then on left Menu:

  • Click Third Part App
  • Click Microbiome Prescription

Find the sample that you wish to send:

If you need to RESEND sample, see the bottom — there is an alternative way. A rotating circle will appear

When Complete, you will see this shown

Check your email. You should get one like below (it is sent to the email used by biomesight)

Click Link. You should see a page like below

Click on my Profile and then click “Just give me suggestion”

After a few minutes of calculation (over 2 million pieces of information is evaluated), a page like this will appear with usually 1-2000 items listed. Click on what type of item interests you most, for example [Probiotics] and they will be shown…. By default, best items are at the top and worse at the bottom but by clicking table titles you can change the sort order.

If you click the “books” on the right, you will see the precise logic used with links to clinical studies.

Other Options

The transfer is available as an external application on a mobile device, as shown above
Or with more details in a web browser.

Once the [Send] button is clicked, you will get an email like shown below that allows you to login and explore your data deeper.

Clicking the link will log you in automatically, and you will see your sample and it’s identified as originating with BiomeSight.

BiomeSight specific distributions of bacteria will automatically become available once there is a large enough sample.

DISCOUNT CODE

As part of this celebration, a discount code “MICRO” is offered on BiomeSight services. This results in £60 off, which brings the price down to £89 per kit ($110). Local USA fulfillment is now setup. Expedited 2 day delivery at £4.95.

Resend Sample

From Biomesight Support:

To be clear, there’s 2 ways to send it – on the row itself, the button will not be available it was sent already. But you can also do it by selecting the rows and using an alternative button that will send it again regardless. The screenshot below shows both.

New Feature

After transferring the data you will get two emails. One to log into the site. The second is a PDF analysis with suggestions and literature supporting the suggestions.

Bottom Line

Microbiome Prescription is dedicated to working with labs to enrich user experience and knowledge. BiomeSight has stepped up to the plate for cooperation and win-win attitude.

The pain of Lab Hierarchies

I am currently working with BiomeSight.com to add Taxon numbers to their downloadable reports.

At first sight, this should be easy, the sample of their complete taxonomy looks like this:

The problem is that their software have forced items into an unnatural structure to make presentation easy. An item that is under Class — when you go to NCBI Taxonomy Browser may be listed as:

  • Sub-Class
  • Super-Class
  • Order
  • Sub Order
  • Family

The result is that many many items have to be resolve by manual inspection of NCBI to find the apparent match and individually assigned. Example below, notice the “Group II” item which required working from existing matches for a line to identify probable candidates.

Update [MicrobiomeSight] Set OID=2731342 Where [Order]='Group II'
Update [MicrobiomeSight] Set OID=1643688 Where [Order]='Leptospirae'

Other issues concern differences of spelling and renaming, i.e. Cerasicoccales vs Cerasicoccus that was found….

While NCBI shows

We have a possible old/atypical name being used which obtuficates reports. This is one of the key reasons that I am pushing for taxon numbers in all uploads because without them, we would have massive inconsistencies.

After getting all of the Genus and Above resolved, I hit an issue with the species.. namely the list shown below remain unresolved. A few I did a google for and found no hits. Many had incomplete names.

Example:

Bacillus polyfermenticus in NCBI is Bacillus velezensis variant polyfermenticus
  • Acholeplasma ales
  • Burkholderia eae
  • Candidatus Methylacidiphilum infernorum
  • Cryocola poae
  • Dechloromonas fungiphilus
  • Desulfovibrio aceae
  • Enterobacter aceae
  • Enterobacter rottae
  • Erwinia dispersa
  • Haererehalobacter salaria
  • Haloterrigena gari
  • Herpetosiphon agaradhaerens
  • Megasphaera geminatus
  • Mycobacterium indicus
  • Oscillospira eae
  • Tessaracoccus terricola
  • Pasteurella eae
  • Stenotrophomonas retroflexus
  • Stenotrophomonas griseosporeus
  • Trabulsiella farmeri
  • Vibrio bacterium

Bottom Line

All Phylum, Orders, Classes, Families and Genus had matching taxon assigned. At the Species level, 6445 were identified and 21 were not. This means 99.7% of species were given taxon numbers. I expect BiomeSight.com to offer uploadable formats soon, ideally with automatic transfer from their web site.

Preventing Antibiotics Diarrhea

I just got out of the hospital for cellulitis where I was treated with IV antibiotics. My discharges notes said “take antibiotics to prevent diarrhea”. I asked which ones… blank faces. No one seem to have a concrete idea. So this is a review of the literature:

If you find any other studies that is explicit on the probiotic strains used with good results, please email me at Ken/at\lassesen.com

To help find which probiotics contain the above see this page.

Pycnogenol and Allergies/Mast Cells

A reader asked about this, which I have no covered yet. Increased allergies and mast cell issues often occur with microbiome dysfunction and chronic fatigue syndrome.

Bottom Line

The research to date suggests that it may take 2 or more months before significant benefits may be seen in some cases.

Symbioflor-1 A sinus probiotic

SOURCES: https://www.paulsmarteurope.com/ and https://www.naturitas.us/

“The probiotic Symbioflor 1 is a historical concoction of 10 isolates of Enterococcus faecalis. Pulsed-field gel electrophoresis revealed two groups: one comprising eight identical clones (DSM16430, DSM16432, DSM16433, DSM16435 to DSM16439) and a further two isolates (DSM16431, DSM16434) with marginally different profile” [2016]

“A double-blind, placebo-controlled multicenter study in 157 patients with chronic recurrent sinusitis investigated the occurrence of acute relapses during treatment of patients with a bacterial immunostimulant (3 x 30 drops/day), comprised of cells and autolysate of human Enterococcus faecalis bacteria (Symbioflor 1, n = 78) in comparison to placebo (n = 79)…. the occurrence of relapses (50 incidents) was about half (56%) the number observed under placebo (90 incidents)” [2002]

“the time span until occurrence of the first relapse was clearly longer under verum[Symbioflor-1] (699 days) than under placebo (334 days) and after the end of the observation period 91% of patients under verum experienced only one relapse compared to 62% in the placebo group (p = 0.01). ” [2001]

From PubMed

  • “Compared with the controls, probiotic intervention significantly upregulated the level of IL-10 and TGF-β, downregulated levels of IFN-γ, and increased progesterone level that reversed the trend of being Th1 predominance state ” [2020]
  • 1. E. faecalis stimulates the liberation of interleukin 1 (IL-1 beta) and interleukin-6 (IL-6) in a dose-dependent manner; the E. faecalis induced liberation of IL-1 beta and IL-6 is inhibited by dexamethasone (Dm) but not by cyclosporin A (CsA).”
    2. E. faecalis stimulates the liberation of gamma-interferon (IFN-gamma) in a dose-dependent manner, which is inhibited by both Dm and CsA.”
    3. Phytohemagglutinin (PHA)-induced liberation of gamma-IFN and interleukin-2 (IL-2) is inhibited by E. faecalis in a dose-dependent manner. ” [1994]
  • “For instance, Escherichia coli Nissle 1917 was a poor inducer of iNOS gene expression compared to the other E. coli strains, while Enterococcus faecalis Symbioflor-1 was more potent in this respect compared to all the eleven Gram-positive strains tested. ” [2014]
Symbioflor 1

Personal Experience

I have used this for sinus issues in the past and it has been effective in clearing them.

Source: https://www.paulsmarteurope.com/symbioflor-1-tropfen-drops-50ml/

Hafnia alvei 4597 Probiotic is available

A reader forwarded this to me with the following comment..

My mother is a health 58 years old women a little bit over weight she started to have after 2 weeks of use: headaches and feeling very fatigued so I think she has die-off, The interesting thing that happen she has swollen lymph nodes under her arm pits for about 25 plus years, the lumps started to regress, I cannot find the microbiome condition associated with this and this strain of probiotic she started to use.

Entero Satys

This is available from France. Link here. International availability is unknown. “Hafnia alvei is a psychrotrophic bacterium, it originates in raw milk and continues to grow in cheeses such as Camembert.  abundant levels of Hafnia alvei can be found in raw milk cheese ” [Wikipedia]


Ingredients:
 Corn starch; coating agent: hydroxypropylmethylcellulose; freeze-dried bacterial strain ( Hafnia alvei 4597 ); gelling agent: gellan gum; zinc (zinc bisglycinate, glycine, acidifier: citric acid, anti-caking agent: silicon dioxide [nano]); anti-caking agents: magnesium salts of fatty acids; chromium (picolinate).

Research

Hafnia alvei HA4597 Strain Reduces Food Intake and Body Weight Gain and Improves Body Composition, Glucose, and Lipid Metabolism in a Mouse Model of Hyperphagic Obesity 2019

  • “In conclusion, the present study showed that a daily provision of the H. alvei HA4597™ strain in genetically obese and hyperphagic ob/ob mice with HFD-exacerbated obesity decreased body weight gain, improved body composition, decreased food intake, and ameliorated several metabolic parameters, including plasma glucose and total cholesterol levels. “

Commensal Hafnia Alvei Strain Reduces Food Intake and Fat Mass in Obese Mice-A New Potential Probiotic for Appetite and Body Weight Management 2020

  • “Finally, the low abundance of ClpB gene expressing Enterobacterales species found in the microbiota of obese subjects in the present in silico analysis may indicate insufficient anorexigenic signaling from the gut microbiota to the host, further providing the rationale for supplementation of commensal bacteria expressing the ClpB protein with an α-MSH-like motif. “

Role of the Gut Microbiota in Host Appetite Control: Bacterial Growth to Animal Feeding Behaviour, 2017

Bottom Line

There was no detail microbiome information cited in studies above. The mechanism of operation was increase production of a metabolite from this bacteria that alters the number of meals.

The daily dosage is 50 million CFU ** / 100 billion cells, i.e. 5 x 10^7. Some (made in France) Camembert are reported to exceed this level in 1 gram (especially the surface).

It is available as a specialized cheese starter.

Details on Bacteria Selection

People have asked why going different suggestion choices give different results – sometimes contradictory ones! The suggestions are determined by the bacteria included to alter. There is no magic way to select the bacteria. The site gives you a variety of choices/methods reflecting various requests expressed. This post attempts to explain these choices. Remember a typical microbiome result may be 600 bacteria – picking a dozen bacteria at random will give different suggestions every time. Many of the bacteria are ‘noise’ with no health impact in most cases

Quick Suggestions

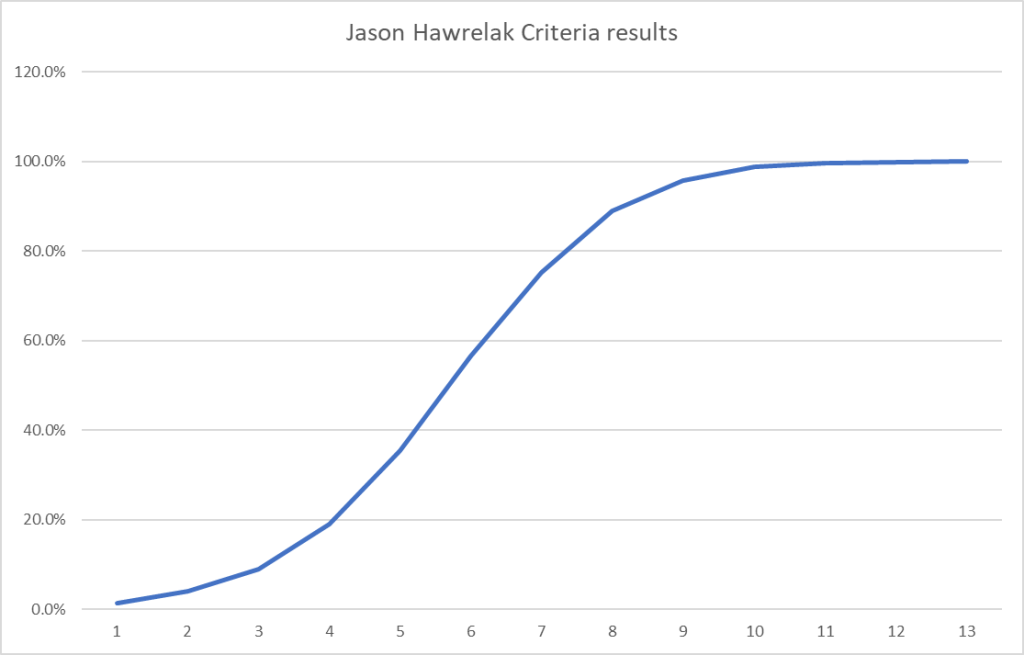
This looks at only the bacteria in Dr. Jason Hawrelak criteria for a healthy gut. If you are outside of his ranges then low values are attempted to be increased and high values are decreased.

Number of Bacteria Considered: 15

If any other published author care to provide their criteria and grant permission to use, it can be added.

Medical Conditions

When you click on one of the items on the “Adjust Condition A Priori” link there is no microbiome to refer to so one is synthetically created. This is done by looking at the reported shifts and computing one.

From the Autism Profile

We apply some fuzzy logic here.

  • If just one report, we run with that value
  • If equal number of high and low we ignore.
  • If different number of high and low, we compute the difference, and deem the winner to be included

We then create a profile using the 12%ile value for low and 87% for high value.

The resulting synthetic microbiome is then processed using the 50%ile as our reference, scaling. The data to be processed may look like this:

Example for Autism

Number of Bacteria Considered: depending on condition: 5- 300 bacteria, typically 30

Advance Suggestions

This is the workhorse which gives many options to both increase and decrease bacteria included. It takes all bacteria (regardless of possible medical significance) as a starting point and adjusts them.

Add in all those I am missing that are seen in % of other samples

No bacteria is seen in every samples. Some people have none of some bacteria and they are concerned about this. This allows you to include very common bacteria that you are missing with a zero value. It is questionable if this philosophical belief have significance. The most common bacteria is listed below.

Limit to Taxonomy Rank of ….         

It appears that often the real health significant items are at the lowest level of the bacteria hierarchy. There are good Lactobacillus strains and there are bad Lactobacillus strains (which have been reported to be fatal). This allows you to focus only the bottom levels. The more levels, the more bacteria are targeted – and the greater that ‘noise’ may hide what is significant.

A simple analogy. A kid at a school did some vandalism, you have a vague idea of who (the Species). Do you proceed to punish him with all of his friends (i.e. the Genus)? Do you punish those in classes that he is in (the Family) – keeping all of the classes in for detention. Do you push the entire grade in that school (the Order)? The entire school (the Class). Morale and school performance will change for those impacted.

Number of Taxa at different ranks seen in at least 10% of uploads

Bacteria Selection Choices

This attempted to filter to outliers before the [My Taxa View] was created which allowed hand selection. The philosophical reasoning is that very high and very low are the most probable cause of health issues. This discards bacteria that are in the middle range. You specify if you want to focus only on:

  • top/bottom 6% – Example Count: 6
  • top/bottom 12% – Example Count: 35
  • top/bottom 18% – Example Count: 66

Filter by High Lactic Acid/Lactate Producers

This was a special early request from a reader. It will filters to those bacteria that are lactic acid producers where the values are above the 50%ile. Everything else is excluded. This functionality has been improved using EndProducts Explorer and hand picking the taxa (thus you can do it for any end product in our system). Values are scaled from the difference to the median value.

This was retained because lactic acid issues often result in cognitive impairment, hence a simple route for those people.

Deprecated: Filtering by….

Filtering by medical conditions, symptoms have been deprecated and replaced by hand picked taxa. This allows unlimited combinations of conditions and symptoms to be handled.

Where to go to pick shifts matching end products, symptoms, medical conditions

My Biome View

This is for people that wishes to ‘eye-ball’ the choice of bacteria. This shows the relative ranking/percentile and how many samples have it. For a bacteria that is seen in only a dozen sample (like Legionellaceae below) or with a count of 100 or less, is unlikely to have any significance.

How are Hand Pick Taxa Handled?

We maintain the same pattern: What is the difference from the median/50%ile (NEVER the average) and we then scale it and feed those values into the suggestion engine.

How are Lab Results handled

The original approach of giving every bacteria equal weight has been updated recently. Like with Medical Conditions above, we create a synthetic microbiome using

  • 1 down arrow for 18%ile value
  • 2 down arrow for 12%ile value
  • 2 down arrow for 6%ile value
  • 1 up arrow for 82%ile value
  • 2 up arrow for 88%ile value
  • 3 down arrow for 94%ile value

Bottom Line

We always use a provided range (Jason Hawrelak) or the difference from the 50%ile/median. We never use Average — and feel that any lab that reference averages do not really understand the data and lack adequate statistical staff. Once upon a time, in the early days we used average but as we got familiar with the data we realized how wrong that approach was — the data is not a bell curve/normal distribution. A simple example is below.

Almost 80% of people have below average counts.

A series of post looking at the microbiome overtime

While the medical condition is autism, the same approach may be applied to other conditions.

  • Technical Study on Autism Microbiome – comparing citizen science to published science. There is little agreement between published studies, but citizen science agrees with some published studies.
  • Child Autism microbiome over time – Part 1 – Using the bacteria taxa identified above, we look at 11 samples over 2 years to see how these key taxa varied.
  • Child Autism microbiome over time – Part 2 – We look at the predicted symptoms for each of these 11 samples and how certain bacteria cluster that are associated with autism
  • End Products and Autism, etc – We look at citizen science identification of end product shifts associated with autism. Often the pattern is not too high Or too low BUT too high and too low — that is, out of balance
  • Child Autism microbiome over time – Part 3 – we examine the end products over the two years and saw that Camel Milk with L.Reuteri made a significant change in the microbiome. A side effect was that Eubacteriaceae started to climb and kept climbing until it was very extreme. This bacteria produces formic acid which alters the pH of the gut and is hostile to many bacteria, including Bifidobacterium.

Distribution Charts by Lab/Source

This is the next step of dealing with the Taxonomy Nightmare before Christmas. On the taxa detail pages, allow people to view the distributions be specific labs. For illustration I will be using Lachnospiraceae http://microbiomeprescription.azurewebsites.net/library/details?taxon=186803 because it is reported in almost all sources.

You will see a new drop down

Log of Values

20% below 12
15% below 12
40% below 12
55% below 12
68% below 12

Actual Values

We will use Ruminococcaceae, http://localhost:42446/library/details?taxon=541000 . Again, something everyone reports

Because most are uBiome, then the shapes above and below are similar
The highest value found was still below the average values of other tests

Bottom Line

There are oddities with some taxa between labs. These charts will help determine better if your readings are atypical or not.