This is a follow up to my blog post of Dec 30, 2021. Rosacea, Circulation and mild CFS. The person has tried the suggestions, and now we will attempt to see what the consequences are and the next set of suggestions.
Remember, the suggestions are based on mathematical modelling using clinical studies on study populations, so they may work or not work for individuals.
I am a computer scientist and a statistician. I am not licensed to practice medicine, and where I live has strict laws about ‘appearing to practice medicine’. What I can do for readers is to write a public blog (anonymous) from your data and back story as an education post on using the software and the statistics it produces. I cannot consult. The content should be reviewed by a medical professional before implementing.
High Level Measures
- Bacteria Reported
- Prior: 427
- Latest: 591 (38% increase in taxonomy)
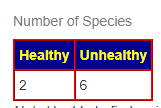
- Health Status
- Prior: Healthy 1, Unhealthy 8
- Latest: Healthy 1, Unhealthy 9
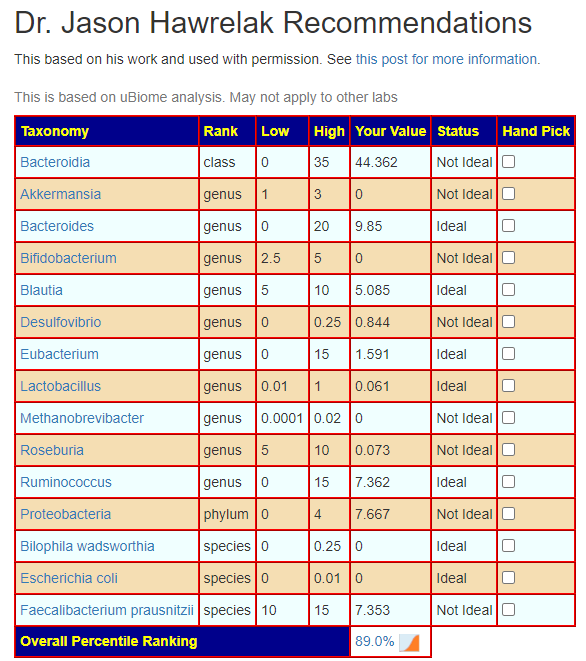
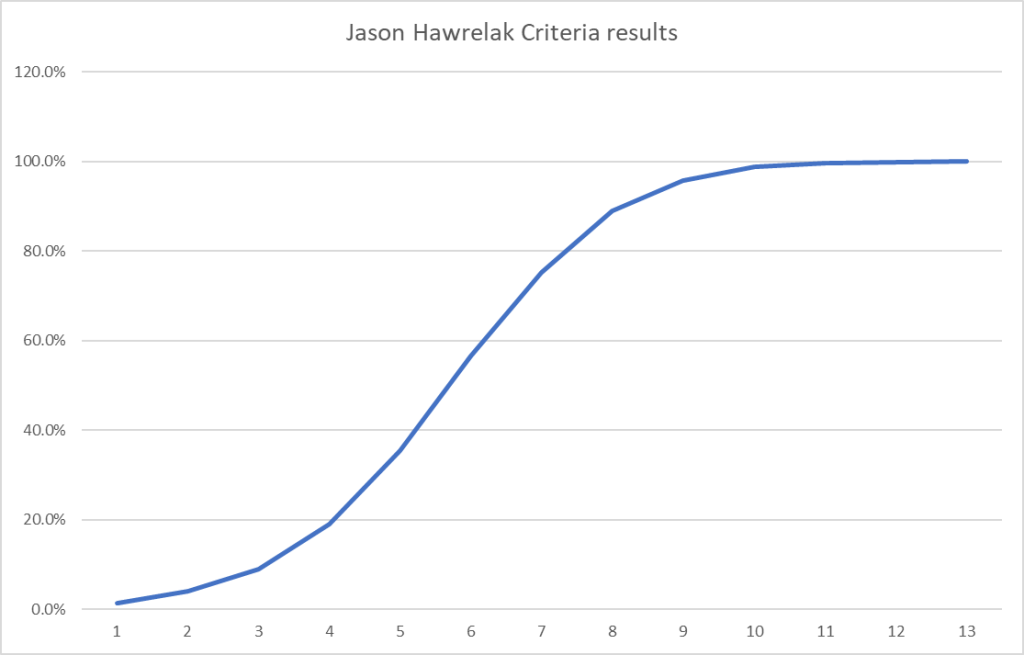
- Dr. Jason Hawrelak Recommendations
- Prior: 99.7% (effectively excellent!)
- Latest: 75.3%. What left ideal is below, nothing moved to ideal
- Bacteroidia went up
- Bacteroides went up
- Methanobrevibacter went down
- Roseburia went down
- Faecalibacterium prausnitzii still not ideal but went up significantly
- Unhealthy Bacteria: here we had a definite improvement, less ones, lower value
- Ruminococcus] gnavus dropped off list
- Anaerotruncus colihominis decreased
- Bacillus decreased
- Blautia producta decreased
- Clostridium decreased
- Collinsella decreased
- Corynebacterium dropped off list
- Dorea decreased
- Eggerthella lenta dropped off list
- Legionella drop off list
- Streptococcus australis decreased
- Streptococcus vestibularis dropped off list
- Veillonella atypica joined the list
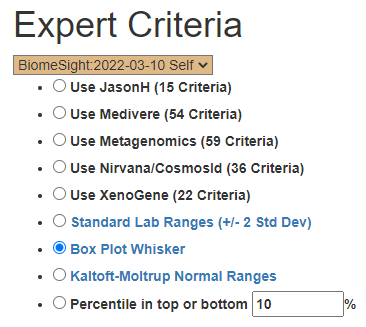
Bacteria Selected using Expert Criteria
| Method | Prior | Latest |
| Use JasonH (15 Criteria) | 5 | 6 |
| Use Medivere (54 Criteria) | 5 | 6 |
| Use Metagenomics (59 Criteria) | 5 | 6 |
| Use Nirvana/CosmosId (36 Criteria) | 5 | 6 |
| Use XenoGene (22 Criteria) | 5 | 6 |
| Standard Lab Ranges (+/- 2 Std Dev) | 8 | 6 |
| Box Plot Whisker | 30 | 27 |
| Kaltoft-Moltrup Normal Ranges | 78 | 84 |
| Percentile in top or bottom 10 % | 63 | 99 |
My impression is that the microbiome has become more diverse, in one sense, unstable. The increase in the number of bacteria types reported (591) moved it just above the typical count for BiomeSight (578). My personal experience is that this is a good sign, the microbiome is changing, I experienced this spike is variety before my microbiome settled down into a new, healthier normal.
Symptoms Change
“This things has improved:
- Less bloated
- Seborrhoeic dermatitis is gone
- Better stool
- Better libido“
Using the regression for all symptoms we had regressions for, we had 154 improved out of 209 items, or 74% had improvement in the prediction of symptoms.
Overall: Appears to be Improved
This person was a challenge originally because there was no dominate shifts or “smoking guns”. Being at the 99+% for Dr. Jason Hawrelak recommendations and the same items returned from other expert suggestions (many with more criteria) had no significant change. Supporting improvement: Increase in bacteria types closer to typical; significant decrease in number of Unhealthy Bacteria; improved symptoms; and last, prediction of symptoms had a major improvement.
Next Round of Suggestions
After the above sample, he actually started two more items:
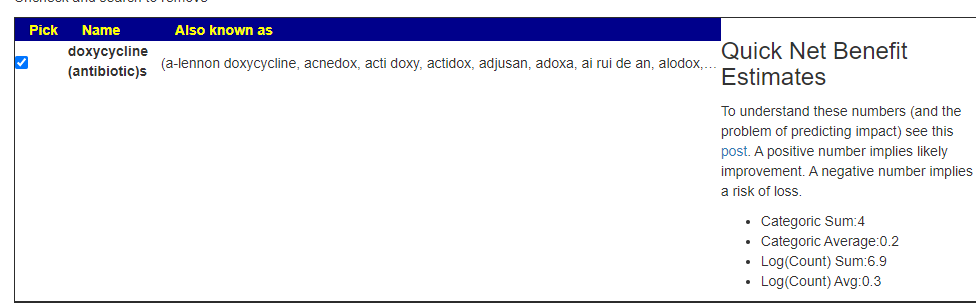
- 10 days with doxycycline
- started to take rosemary “Feels pretty good taking it. ”
Probiotics
There are many Ways of Choosing Probiotics, I will look at two below:
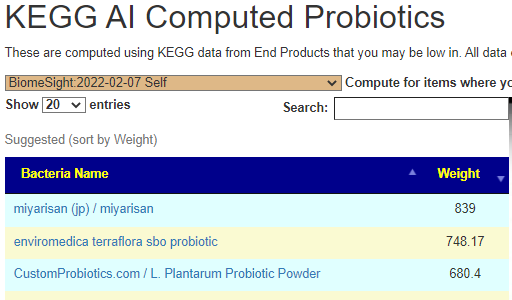
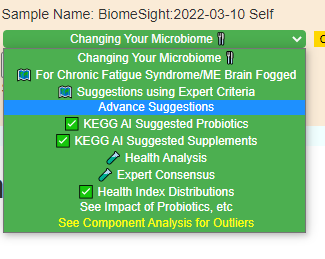
KEGG AI Computed Probiotics
The differences actually shocked me, a very very dramatic difference. On the current sample I see what is often on ME/CFS patients list appear at the top: miyarisan (jp) / miyarisan with also L. Plantarum Probiotic Powder. This suggests that he is moving towards/through a more typical ME/CFS microbiome. Given that he has issues but everything appeared normal or good, I take this as a good sign – we are exposing the issues.
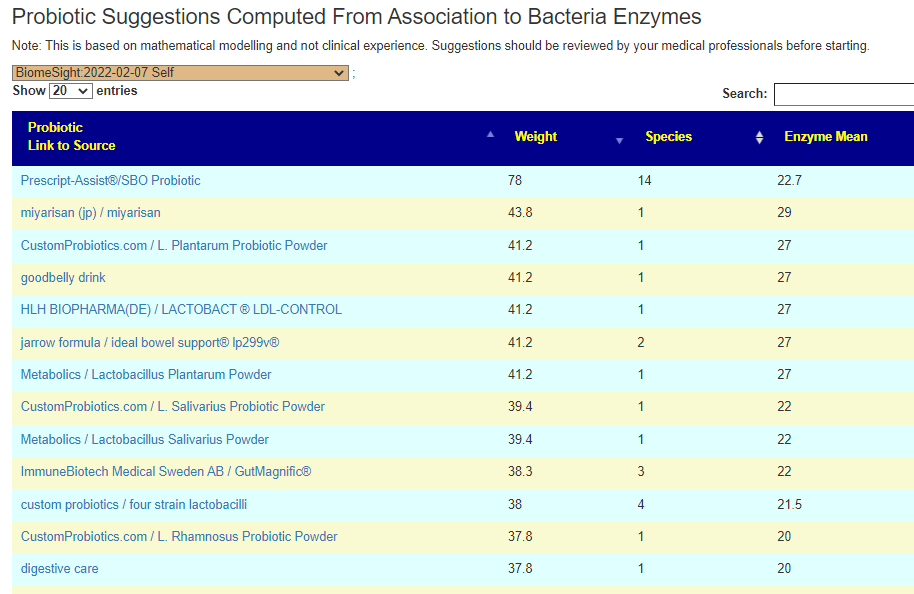
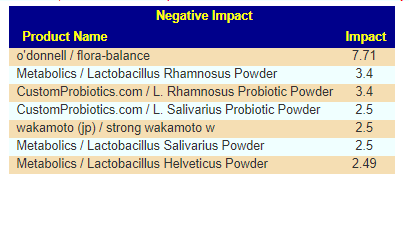
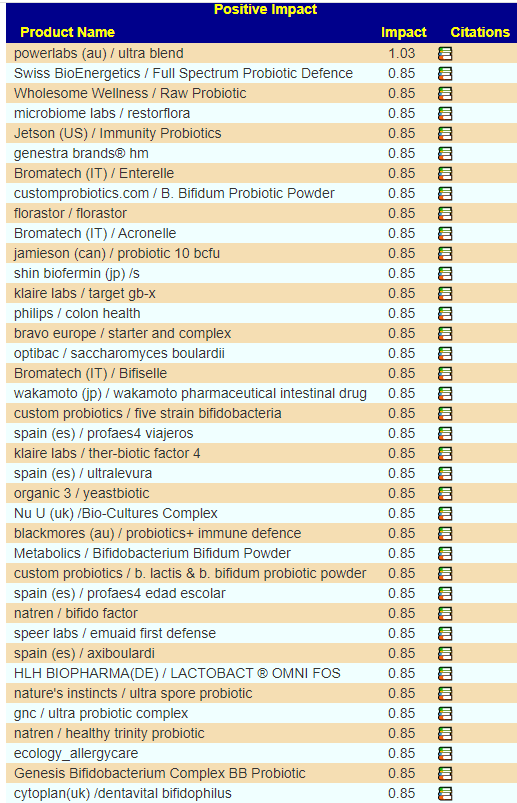
We also have the option of probiotics based on symptoms (adjusted for the microbiome). See Using Samples and Symptoms to Suggest Probiotics post. The data is shown below in decreasing weight order. The nice thing to see is the decrease in the weight of everyone. One totally disappeared (the sole enterococcus faecalis one). It is interesting to note that while above using only the microbiome and resulted in major shifts between samples, when the symptoms are combined the suggestions are very similar and actually reflect improvement of the microbiome.
Suggestions
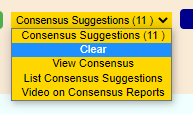
I am going to do my current practice of relying on consensus reports because they are now quick to generate. I will be doing a consensus from:
- Standard Lab Ranges (+/- 2 Std Dev)
- Box Plot Whisker
- Kaltoft-Moltrup Normal Ranges
- Percentile in top or bottom 10 %
I will be including everything, since the reader is able to persuade his medical professional to prescribe.
Consensus Results
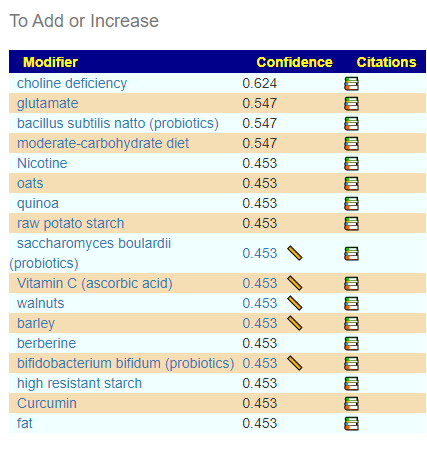
The following are my picks from the options presented. I provided some links to where it helped ME/CFS –i.e. the suggestions are reasonable
- On all Safest Suggestions (Take:avoid ration)
- Cacao (21:1) — you likely want 85% chocolate or higher [2010]
- lactobacillus casei (probiotics) (8:1) [2009]
- polymannuronic acid (6:1) impacts restless leg syndrome
- bacillus subtilis (probiotics) (5:1) see 2016 post
- high fiber diet (5:1)
- garlic (allium sativum) (5:1)
- rosmarinus officinalis (rosemary) (3:1)
- lauric acid(fatty acid in coconut oil,in palm kernel oil,) (7:1)
- Only take – no negatives
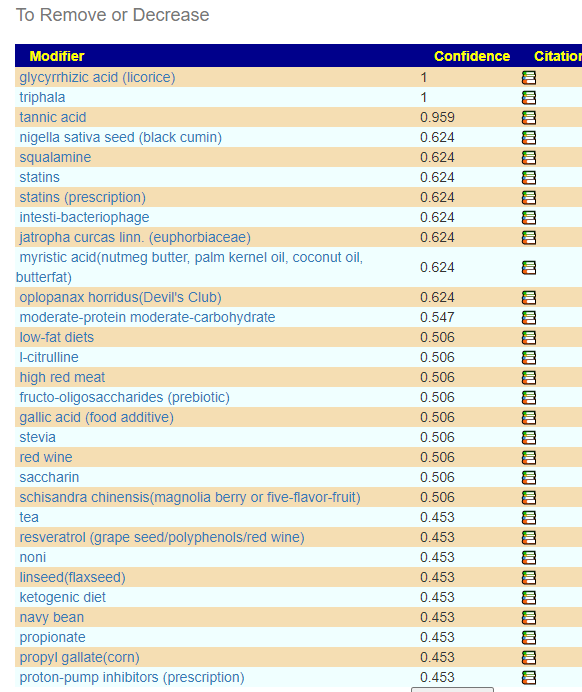
Items to reduce or avoid
- stevia
- xylan (prebiotic)
- high sugar diet
- sugar
- galactose (milk sugar)
- low fodmap diet
- high-saturated fat diet
- rare meat
- low fiber diet
- high processed foods diet
- vegetable/fruit juice-based diets
- nuts
- white button mushrooms
- partially hydrolysed guar gum,fructo-oligosaccharides (prebiotic)
- cranberry bean flour
- kefir
- kombucha
- Prescript Assist (Original Formula)
Remember: These are suggestions, items that improve odds.
Prescription Suggestions
This is done using advance suggestions and flipping the selections:
The top suggestions were:
- rifaximin (antibiotic)s
- piperacillin-tazobactam (antibiotic)s
- loracarbef (antibiotic)
- benzylpenicillin sodium (antibiotic)
- clindamycin (antibiotic)s
- benzathine benzylpenicillin (antibiotic)
- clarithromycin (antibiotic)s
Secondary positive suggestions are:
Dangers of Filtering
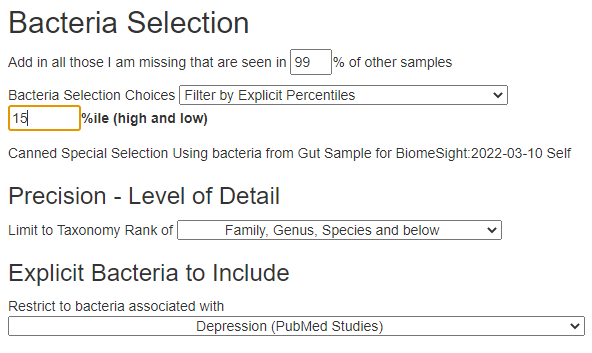
The person tried using the ME/CFS filter and got very different results. This person has mild ME/CFS; the studies on the US National Library of Medicine are for ME/CFS are typically severe and matches a yard of criteria for inclusion in the study. It is often not safe to use there filters when you self-diagnosis or are mild/controlled.
Bacteria Selected using Expert Criteria
| Method | Filtering By ME/CFS | Latest |
| Use JasonH (15 Criteria) | 4 | 6 |
| Use Medivere (54 Criteria) | 4 | 6 |
| Use Metagenomics (59 Criteria) | 4 | 6 |
| Use Nirvana/CosmosId (36 Criteria) | 4 | 6 |
| Use XenoGene (22 Criteria) | 4 | 6 |
| Standard Lab Ranges (+/- 2 Std Dev) | 3 | 6 |
| Box Plot Whisker | 5 | 27 |
| Kaltoft-Moltrup Normal Ranges | 12 | 84 |
| Percentile in top or bottom 10 % | 8 | 99 |
My usual criteria has been to have at least 1-2 dozen bacteria. With the new consensus report, having a large number of bacteria seems to produce clearer results.
Bottom Line
Suggestions to be discussed with their medical probiotics
- miyarisan (jp) / miyarisan
- bacillus probiotics (enviromedica terraflora sbo probiotic contains 5 different one)
- L. Plantarum Probiotic
In terms of prescription (doing rotation with breaks between):
- rifaximin (antibiotic)s see this post.
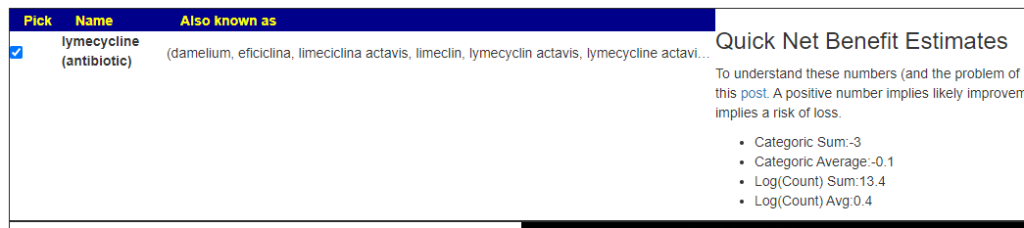
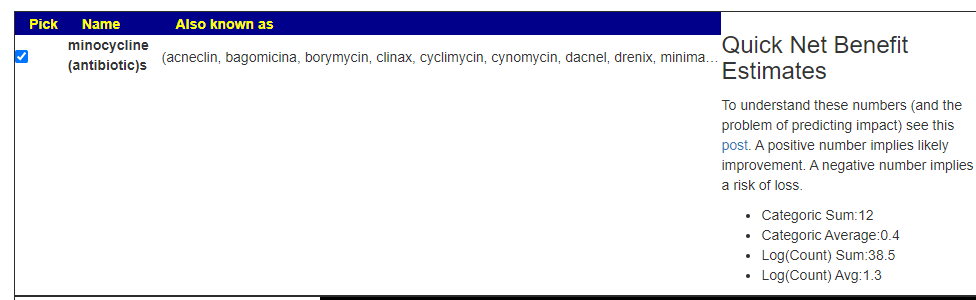
- lymecycline (antibiotic) or minocycline (antibiotic)s There is a long history of successful tetracycline (this family of antibiotics) use with ME/CFS
Supplements to try:
- Monolaurin (lauric acid(fatty acid in coconut oil,in palm kernel oil,)
- Fish Oil – if you love herring… go to it
- High Fiber Diet
We saw improvements between the sample when this reader implemented some of the suggestions. Remember, the suggestions improves the odds, they do not guarantee nor is there any requirement or protocol to follow.
Follow up Comments from the person
Watched the video you uploaded – it was great to get a video and watch how you did for my test.
Quercetin and resveratrol seems to be something to avoid when I did it your way – so I will cut that out.High red meat and high beef diet seems to be something to avoid (felt it myself also).Been cutting out all red meat for some days now – feels pretty good.
One thing to avoid is also “vegetable/fruit juice-based diets”. I drink like 1-1,5 liter juice a day. I will try to reduce it but it’s really hard – do not feel good eating to much meat, fat or starch. So when cutting out juice I do not get enough calories. Calories are really important to me – which I also see now on my avoid-list – “low energy diet/ calorie restriction” is on it.
One other thing that is interesting is that potatoes is on the “Highest Adverse Risk”-list. I eat potatoes every day.


Recent Comments