Using the five methods described in Technical Note: The Four Winds of Microbiome Analysis, I ran these method on all of the data on the citizen science site of Microbiome Prescription testing for all symptoms that have been self-reported from users of Ombre Labs and Biomesight retail microbiome tests. The data from each lab was done is insolation (you cannot mix data from different processions flows, see The taxonomy nightmare before Christmas… for how the results from the same FASTQ files are reported by 4 different processing flows).
My criteria for deeming a genus significant was:
- At least one method reported P < 0.01
- At least two methods reported P < 0.05
The 2 @ P < 0.05 is a bit of shooting from the hip; I expect some correlation between methods but not sufficient to have that adjusted P value to be outside of the range 0.0025 and 0.01. The statistics on significant genus found is below. The 2 @ P < 0.05 produce only a small contributions,
| Significant Count | P < .01 | P < .05 |
| 2312 | 0 | 2 |
| 241 | 0 | 3 |
| 5 | 0 | 4 |
| 55576 | 1 | 1 |
| 17714 | 1 | 2 |
| 10835 | 1 | 3 |
| 6280 | 1 | 4 |
| 711 | 1 | 5 |
| 28660 | 2 | 2 |
| 4361 | 2 | 3 |
| 12876 | 2 | 4 |
| 3646 | 2 | 5 |
| 13523 | 3 | 3 |
| 6636 | 3 | 4 |
| 4700 | 3 | 5 |
| 49501 | 4 | 4 |
| 9004 | 4 | 5 |
| 29060 | 5 | 5 |
326 Symptoms Had significant Statistical Associations
An example of symptoms with a number of associations is shown below. You may examine them here Citizen Science Symptoms To Genus Special Studies.
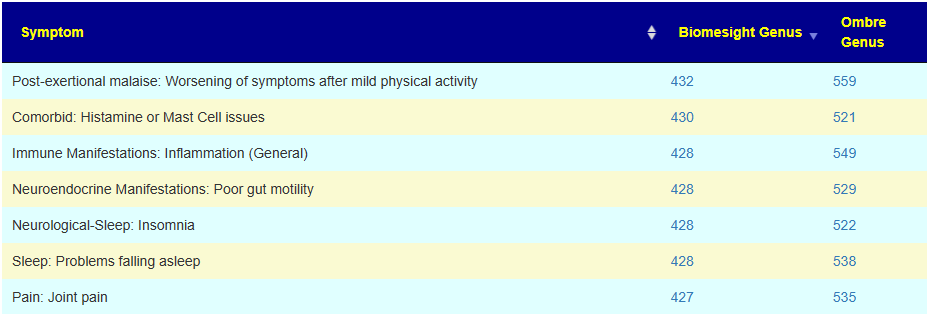
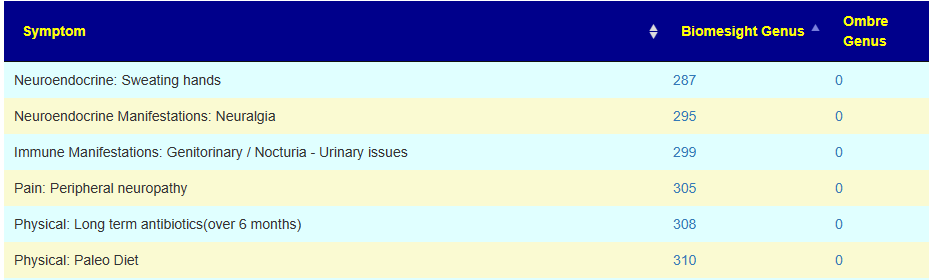
There are some great contrasts between these two labs
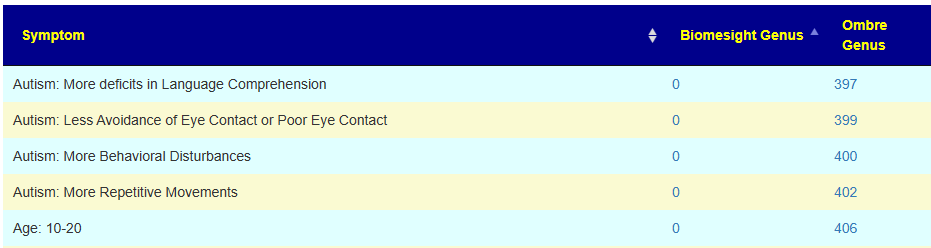
With the next set being very interesting. I know that there is a significant subset of 0-20 years old autistic children whose parent have done their microbiome and uploaded. This appears to be reflected in the data. It does call into questions the 10-20 yo associations because of the likely over-representation of autism in this range group.
All of this data is freely available at:
Drilling Down to Genus Involved
If on the above page you click on the count, you will be taken to a sortable table showing the genus. In the example below, we look at the most significant (i.e. P < 0.01 for all five methods).
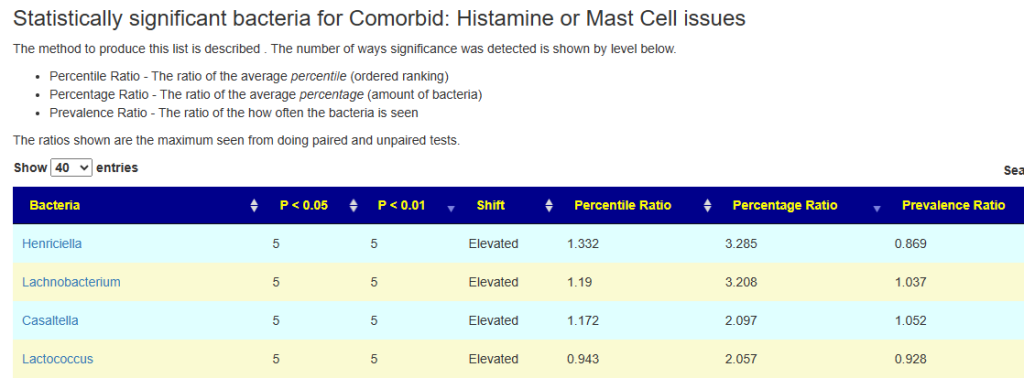
Looking at Lachnobacterium, we see the expected pattern
- The odds of seeing this genus for people with mast cell issues in slightly elevated (1.037)
- The percentage seen is 3.2x what the average for others are
- The percentile is about 1.19x higher
Looking at Lactococcus we see a more confusing picture
- The genus is seen less often (0.928)
- The amount seen with this genus is found is actually much higher (2.057)
- The percentile ranking is slightly lower (0.943)
Both Percentage and Percentile numbers are the maximum using paired and unpaired statistics which may partially account for an apparent contradiction.
Bottom Line
The purpose of this post was to illustrate the data produced from using the five different ways of finding statistically significant association of genus to symptoms. For many readers, this data may be difficult to accept because it disagree with the common sense view of the microbiome that they are working with.
For example, if a genus is seen more often, then you would expect the average amount to be higher. This is often false looking at real data. Understanding the microbiome means discarding simple mechanical models and understanding a complex world of interactions with cascading consequences.
Note: Why we have so many association… Sample Size!
For each of these analysis we have over 1000 annotated samples. As sample size increases, the ability to detect significance goes up significantly.
Pending Work
Tuning parameters:
The numbers will be changing as I tune thresholds. At present:
- I raised the number of times that a genus need to be reported in annotated samples to 36 (i.e. around 0.3% prevelance)
- Number of cases with symptoms reported to 30
This reduced the volume of results (we are not saying less significance — we are filtering by rarer occurrence).
The next step is applying this to an individual microbiome result for a person with one or more symptoms. This means determining which bacteria are the greatest probable contributors and the weight to be given to each for determining a course of microbiome modification.
Recent Comments