I was not happy with the first series of special studies. I left them alone and as a result of doing the Histamine Release – Literature Review And Speculation I changed the methodology and build out more infrastructure to do analysis with more statistical rigor (with thanks to Chat_GPT to speed building the new additions).
To use this feature, you need to upload a 16s sample (Ombre/Thryve, uBiome, BiomeSight) to Microbiome Prescription.
The new special studies are all done on Symptoms that could have sufficient data to detect statistical significance at p < 0.01 or p < 0.001. Many studies on the US National Library of Medicine report significance with p < 0.05. I prefer to reduce the risk of false positive results given that we have so many bacteria possible. 800 bacteria with p < 0.01 would expect 8 items by random chance. p < 0.001 would expect just 1 or less item by random chance.
I also did a more formal presentation showing the t-score, degrees of freedom and probability.
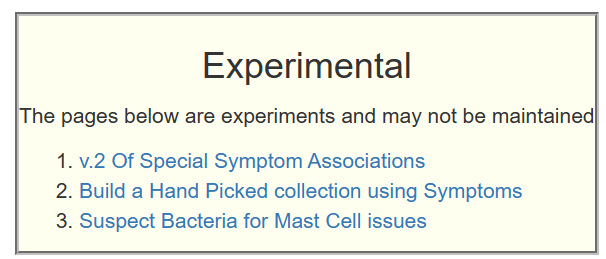
How to Find These Special Studies
Click the Research Tab and scroll to the bottom, you will see:
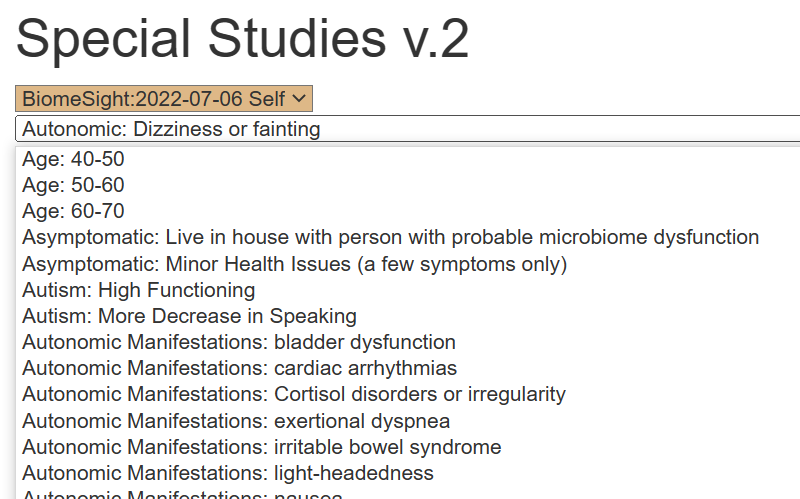
On this new page, select your sample and then the symptom that you are interested in. There are a lot more symptoms than in the original version
The table below show all of the taxa from the same lab that you also had reported.
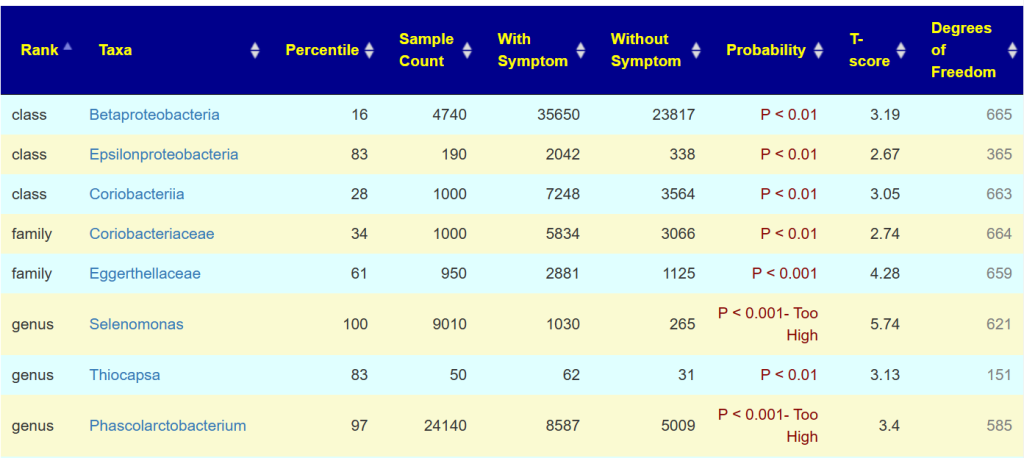
If something is clearly significant, you will see P < 0.001- Too High displayed. The Degree of Freedom is the number of samples that have this bacteria. For example Thiocapsa is seen in just 151 samples, thus a rare bacteria. Look at Phascolarctobacterium, this sample has 24000, people with the condition averages 8500 and people without this symptom averages just 5000. It is clear that you have an increased risk of this condition.
You also have age range… which indicates how much you microbiome agrees with an age range (sorry, getting older is not curable!).
For a few items, you may get no rows. That means that none of the bacteria you have matched the list of ones that were found significant.
There is a lot of data there. I am planning to add hand picking bacteria to these pages eventually.
The Difference Between Version 1 and 2
One of the challenges with earlier attempts to find clear associations between bacteria and symptoms has been insufficient data. Earlier attempts made best efforts with the data that was available. Thanks to people uploading more samples, and annotating them with symptoms, we have entered a time of sufficient data for better analysis. The table below shows the difference between the penultimate version and the current version.
| Aspect | Prior “V1” | Current “V2” |
| Sample of people with condition | Reported a specific symptom | Reported a specific symptom with Source Lab |
| Control Group | Everyone that did not report symptom. Including people that did not report any symptoms. | Only samples with symptoms reported, but not those with a specific symptom. |
| Weight for suggestions | z-score | Different between sample and mean for control group. Difference is scaled by a linear monotonic function. |
| Handling of multiple symptoms | “Clumsy” – bacteria get double counted often | Allow one pass to get bacteria shared across symptoms. No double counting |
Nota Bene: The control group is not healthy people, just people without the specified symptoms. This is a two edge sword that many would debate.
Post Script
All of the data used is available for download at: Microbiome Prescription Citizen Science Data Share
2 thoughts on “Special Studies on Symptoms caused by Bacteria – v.2”
Comments are closed.