I forwarded these on to a friend suffer from MCAS. She responded that she was mentally lost in the studies. She decided to ask Perplexity. to explain. She was delighted with the response and I thought that Perplexity should have a guest post!
This abstract describes how mast cells, which are key players in allergic reactions, release inflammatory substances through a process called degranulation. Here’s a simplified explanation:
Mast Cell Degranulation Process
Mast cells contain small packages (granules) filled with inflammatory chemicals.
When triggered, these granules fuse with the cell’s outer membrane to release their contents.
This fusion is controlled by a set of proteins called SNAREs, including Syntaxin4, SNAP23, and VAMP8.
Normal Degranulation Mechanism
A protein called IKKβ attaches to and modifies (phosphorylates) SNAP23.
The modified SNAP23 then joins with Syntaxin4 and VAMP8.
This three-protein complex drives the fusion of granules with the cell membrane, releasing the inflammatory substances.
Effect of E. coli on Degranulation
The researchers discovered that exposing mast cells to E. coli bacteria interferes with this process:
E. coli prevents IKKβ from interacting with and modifying SNAP23.
As a result, SNAP23 doesn’t join with Syntaxin4 and VAMP8 as effectively.
This disrupts the formation of the protein complex needed for granule fusion.
Consequently, the release of inflammatory substances from the granules is reduced.
In essence, the study shows that E. coli can suppress the allergic response of mast cells by interfering with the molecular machinery responsible for releasing inflammatory chemicals.
Similarly, I was ping by a reader who said “You can’t buy these in the US” — That is correct in that you will not find them in your local health food store. I live in the US and have no trouble getting them by internet order shipped to my door:
This is a preview of the next generation of analysis. I described a mathematical model in Microbiome Guilds, Metabolites and Enzymes. I mentioned a concept in it and over the weekend tried the concept out. It worked and is very sweet.
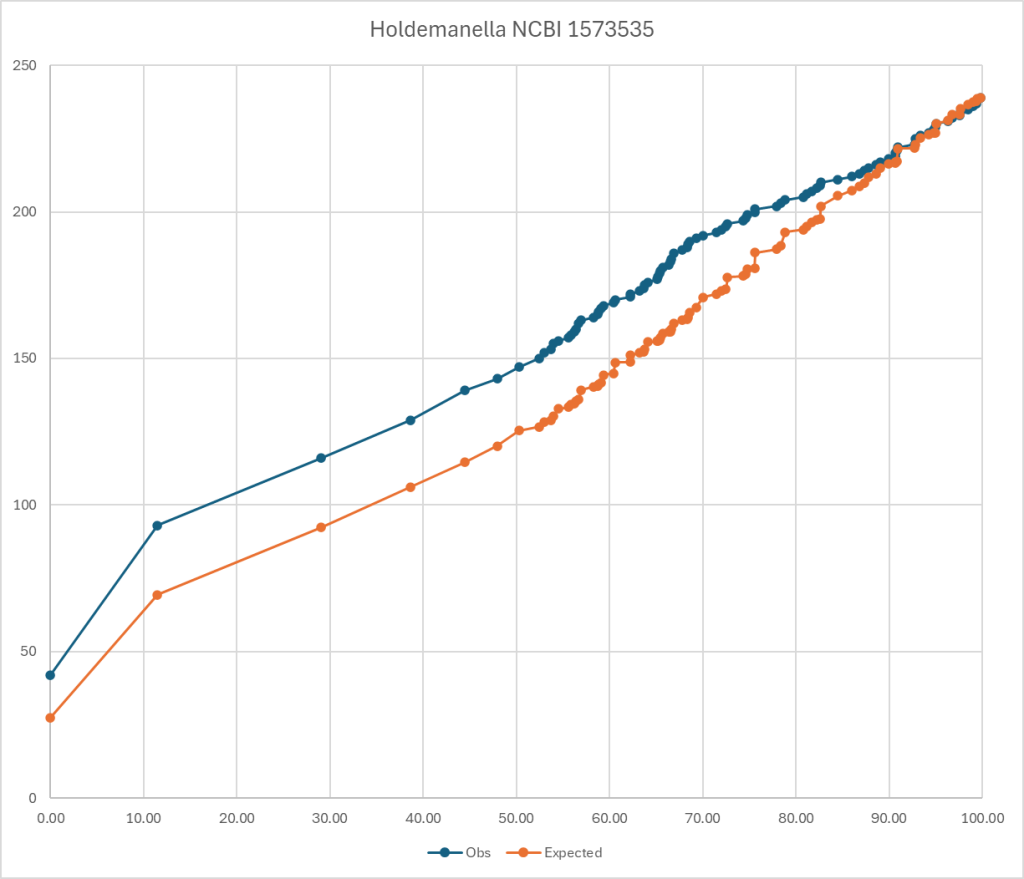
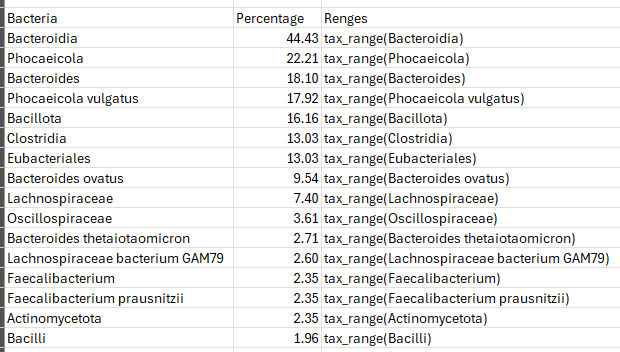
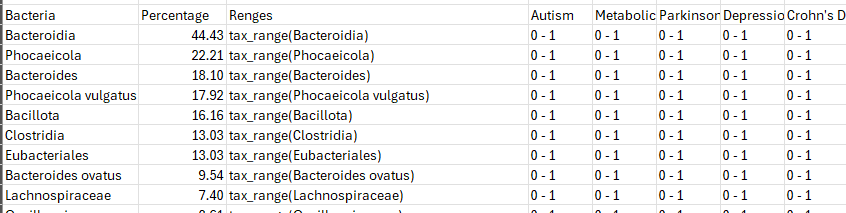
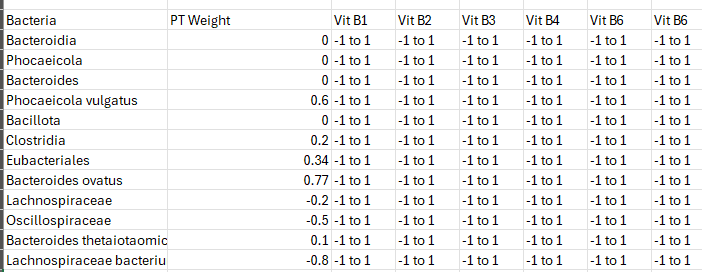
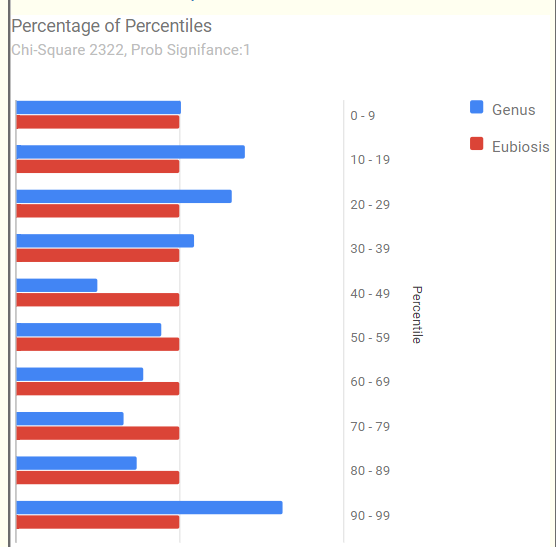
To explain it, look at the chart below. The blue line is for those that have a symptom and the orange line is what is expected. If you divide observed by expected for different percentiles, you get an odds ratio. Most people know odds ratio (OR) from things like:
For current male smokers consuming >30 cigarettes daily:
This pattern does not determine that you will absolutely get it. It means that your are more likely — odds. (My native environment as a statistican)
Biomesight Bacteria
The genus bacteria listed below, each have at least an odds ratio of 1.5 for general fatigue using Biomesight data if your percentile is below the amount show. I stopped listing at 10%ile items
Bifidobacterium <= 48.7
Collinsella <= 41
Coprococcus <= 39.3
Desulfosporosinus <= 38.7
Lachnobacterium <= 37.6
Oribacterium <= 35.8
Lactobacillus <= 30.5
Pseudobutyrivibrio <= 29.5
Legionella <= 28.9
Roseburia <= 28.3
Faecalibacterium <= 27.8
Lachnospira <= 27.3
Turicibacter <= 27.1
Mycoplasma <= 25.8
Peptococcus <= 24.3
Coraliomargarita <= 23.8
Sedimentibacter <= 23.7
Rhodothermus <= 23
Tindallia <= 22.4
Thiothrix <= 21.8
Eubacterium <= 21.7
Thermicanus <= 21.6
Sutterella <= 21.5
Alkaliphilus <= 21.5
Luteibacter <= 21.1
Sphingobacterium <= 21.1
Candidatus Phytoplasma <= 20.5
Anaerostipes <= 20.4
Haemophilus <= 19.9
Moorella <= 19.1
Catenibacterium <= 18.7
Olivibacter <= 18.5
Novispirillum <= 18.4
Butyricimonas <= 18.3
Natronincola <= 17.9
Macrococcus <= 17.3
Runella <= 16.6
Tepidanaerobacter <= 16.1
Caldicellulosiruptor <= 15.7
Enterococcus <= 15.4
Serratia <= 15.3
Salinicoccus <= 15.2
Gemella <= 14.9
Odoribacter <= 14.7
Thiohalorhabdus <= 14.6
Dorea <= 14.2
Escherichia <= 14.1
Chlorobaculum <= 14
Parabacteroides <= 14
Calothrix <= 13.8
Megasphaera <= 13.8
Selenomonas <= 13.6
Acetobacterium <= 13.6
Slackia <= 13.4
Pseudoclostridium <= 13.4
Peptoniphilus <= 12.4
Tetragenococcus <= 12.2
Johnsonella <= 12
Akkermansia <= 11.8
Veillonella <= 11.5
Holdemanella <= 11.5
Streptococcus <= 11.2
Pectinatus <= 11.2
Pedobacter <= 11.1
Klebsiella <= 11
Dysgonomonas <= 11
Erysipelothrix <= 10.9
Desulfurispora <= 10.7
Dolichospermum <= 10.5
Mogibacterium <= 10.4
Bilophila <= 10.2
Ruminiclostridium <= 10.2
Finegoldia <= 10.1
If you have 10 of them then 1.5 ^ 10 = 57x greater odds of having general fatigue. It is NOT one bacteria causing it, or even a specific group of bacteria, but different combinations of possible bacteria.
I should mention that these numbers only applies to Biomesight data. “results from one pipeline cannot be safely applied to another“. For background see: The taxonomy nightmare before Christmas.
Ombre Equivalent Bacteria
If you have Ombre’s microbiome results, these are the critical bacteria:
Collinsella <= 44.2
Erysipelatoclostridium <= 41.8
Bifidobacterium <= 41.1
Thomasclavelia <= 39.2
Lactobacillus <= 30.1
Dorea <= 27.4
Fusicatenibacter <= 24.1
Gemmiger <= 23
Terrisporobacter <= 17.9
Sutterella <= 16.1
Coprobacter <= 15
Coprococcus <= 13.7
Haemophilus <= 13.6
Flavonifractor <= 13
Casaltella <= 13
Ruminiclostridium <= 12.5
Faecalicatena <= 12.3
Mediterraneibacter <= 11.9
Slackia <= 11.8
Paraprevotella <= 11.5
Eubacterium <= 11.3
Subdoligranulum <= 11.2
Lachnospira <= 10.3
Phocaeicola <= 10.2
uBiome Equivalent Bacteria
This illustrates well the fact that ranges will differ a lot between tests.
Subdoligranulum <= 43
Faecalibacterium <= 38.9
Pseudobutyrivibrio <= 26.2
Veillonella <= 22.4
Dorea <= 21.4
Fusicatenibacter <= 21.1
Hespellia <= 19
Oscillibacter <= 18.6
Roseburia <= 18.2
Odoribacter <= 17.9
Collinsella <= 15.9
Intestinibacter <= 15.8
Bifidobacterium <= 15.1
Clostridioides <= 14.6
Papillibacter <= 14.5
Actinomyces <= 14.2
Sutterella <= 12.9
Blautia <= 12.8
Parabacteroides <= 11.9
Marvinbryantia <= 11.6
Anaerotruncus <= 10.8
Bottom Line
This transforms the ability to determine if a bacteria is too high or low. Given a symptom or condition, we can determine the bacteria likely involved and if the level is likely (odds) to contribute to the symptom.
We can thus focus on exactly the bacteria of concern and ifnore the noise elsewhere.
Stay tune, there is a lot of coding to do to implement this.
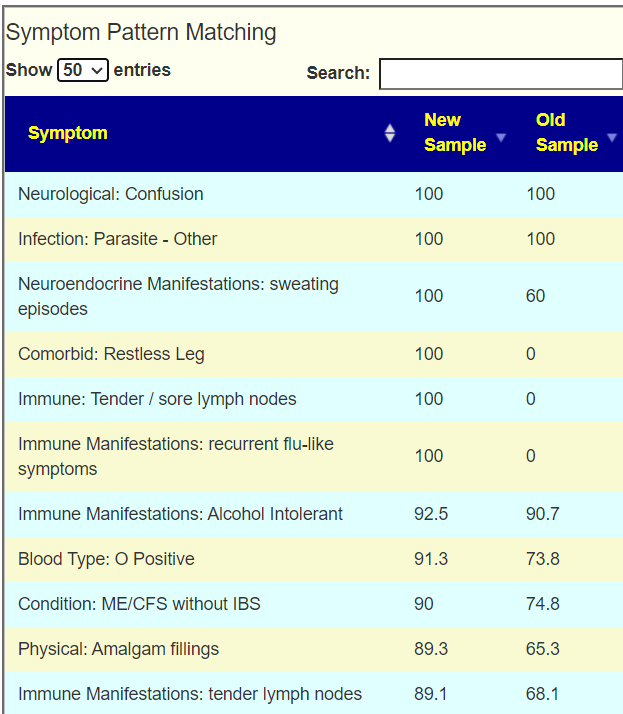
Trial of algorithm
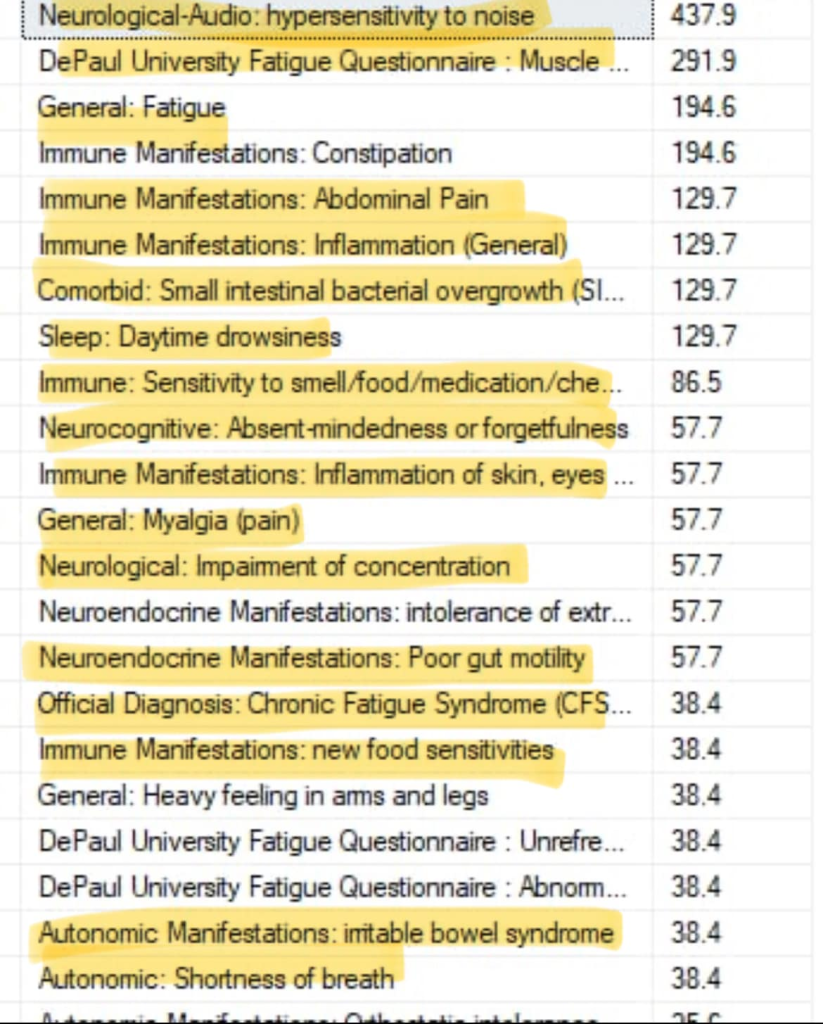
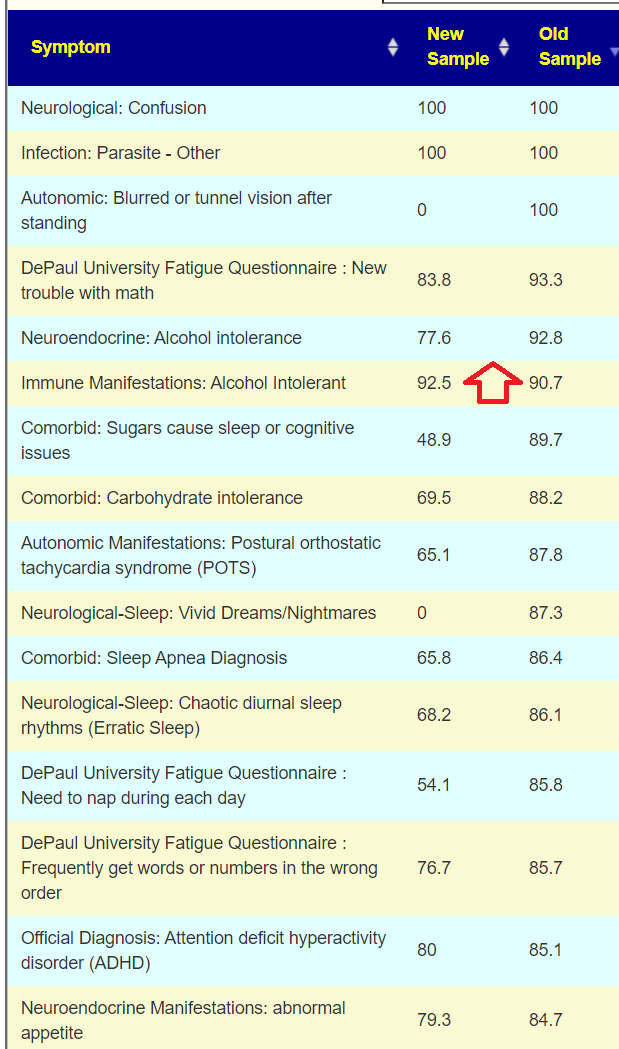
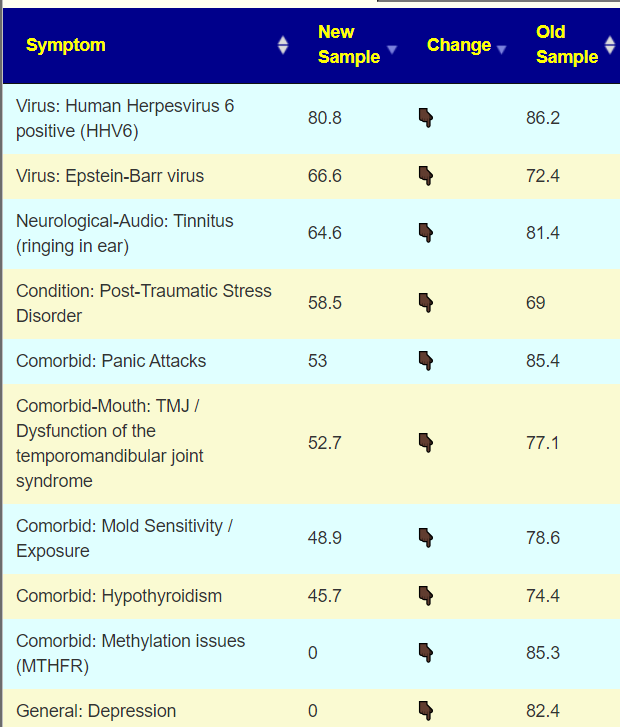
I was helping someone transfer data from biomesight.com and decided to run their latest sample thru the odds ratio I had derived this weekend. She marked their symptoms, see below. The numbers are the odds ratio.
The evidence that hypersensitivity to noise is likely microbiome dysfunction based is sweet — since there is no conventional treatment for it.
Hello, I’m a 21-year-old with a moderate case of CFS. Currently, I’m having serious problems with concentration, reading, memory, and executive function to the extent of needing a caregiver. I react to any food with neurological symptoms and gas, and my energy production is so impaired that I get hungry just two hours after a large meal. I would like to hear your analysis of the sample, especially your opinion about the sky-high amounts of Bilophila wadsworthia.
At 13 years old, I started having hemiplegic migraines with aura, including paralysis, speech, vision, and orientation loss due to an ATP1A2 mutation. These were thought to be incurable until I randomly found an off-label local medicine, metamizole, which is prohibited in the US, Canada, and the EU but is available in my home country, Ukraine. This medication was effective in mitigating the aura. I started taking it every day for four years starting at age 16. Recently, I learned that it increases prostaglandins and has an immunosuppressant effect like NSAIDs in general. I suspect that my daily use of this medication may have contributed to developing CFS and hypersomnia through unchecked mucosal infections.
I was also diagnosed with 160,000 copies of HHV6 in my blood via PCR, which persisted for years (I stopped testing for it). I tried valganciclovir, artesunate and IFN-a, which did nothing but further worsened my baseline. A year and a half ago, I started Joshua Leisk’s Born Free protocol (https://bornfree.life/download/BF_Protocol.pdf), which improved my metabolic situation significantly. However, I coincidentally started living in an unhygienic, mold-infested environment, and subsequently had GI and Eustachian tube infections. After taking nifuroxazide, amoxicillin, and metronidazole a year ago, my condition worsened to a moderate level, and I haven’t recovered since.
I suspect that gut issues are the cornerstone of my problems, but I am quite lost lost regarding how to handle them. I am eager for any new information.
The model that I use for ME/CFS is some event (stress, food poisoning, virus, inoculation or dozen of other possible events) cause the microbiome to shift in response. The shifts can result in a feedback loop that keeps this “evil microbiome” shift going. A percentage recover naturally over time, and we have a longitudal study from Bergen Norway to illustrate this. The trigger was giardiasis for a large number of people. A medicine like metamizole on a continuous basis can easy cause this to happen.
Analysis
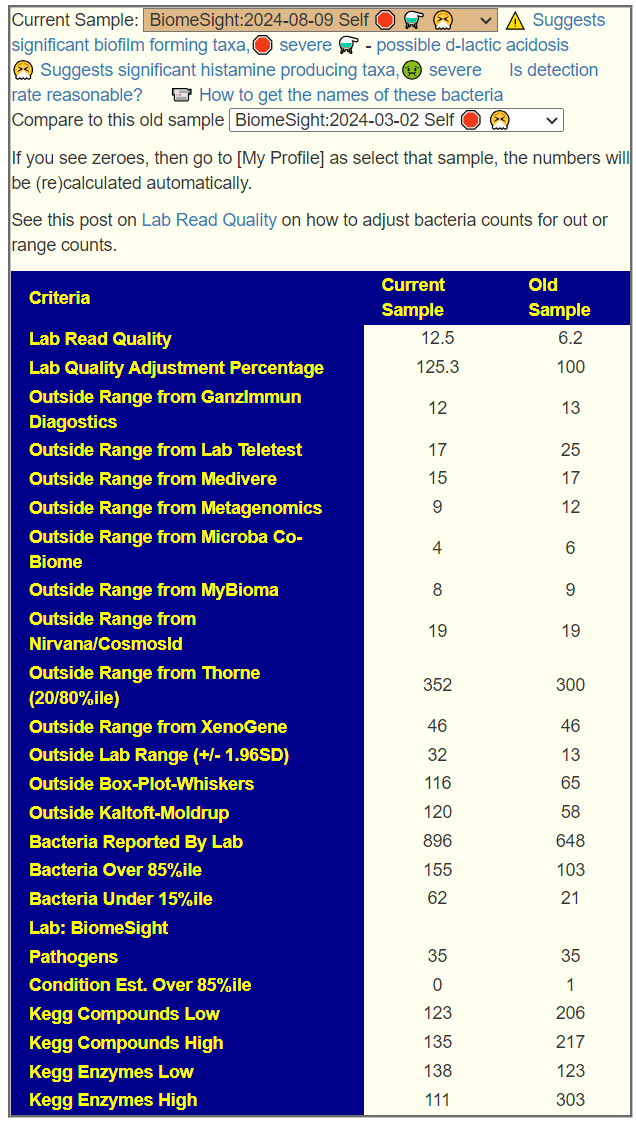
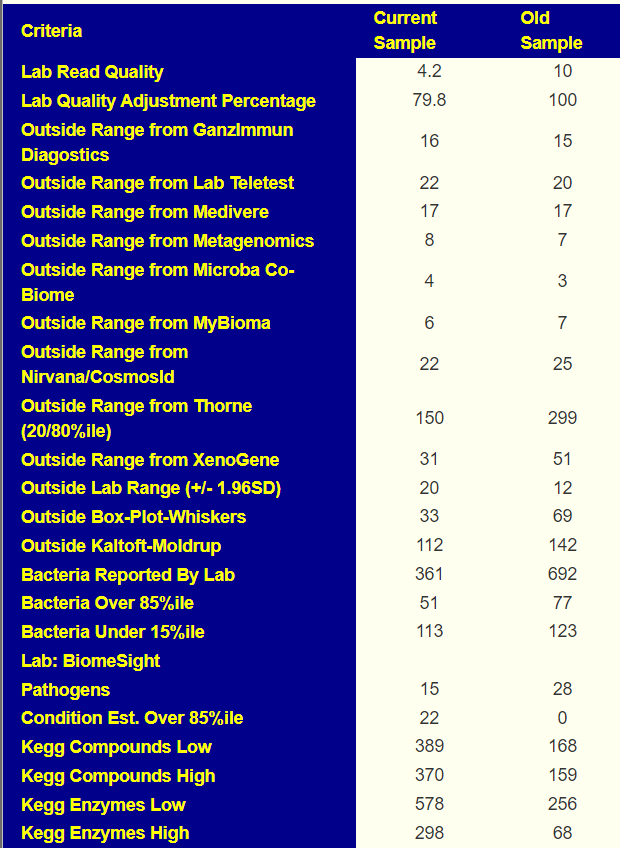
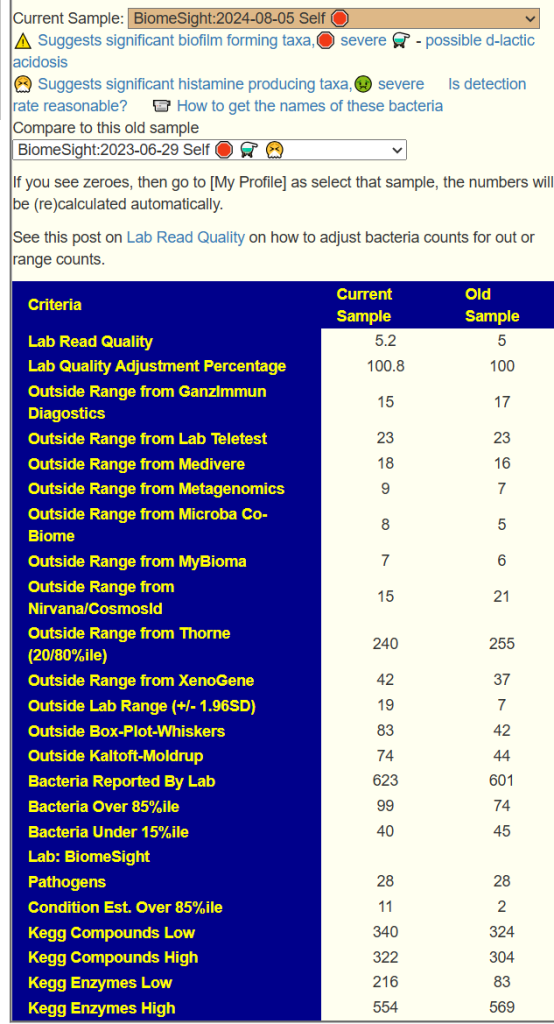
We have two samples available, so let us look at the before and after antibiotics comparison. My impression is that the antibiotic made things worse. The latest sample has more items out of range despite having ~20% less bacteria reported
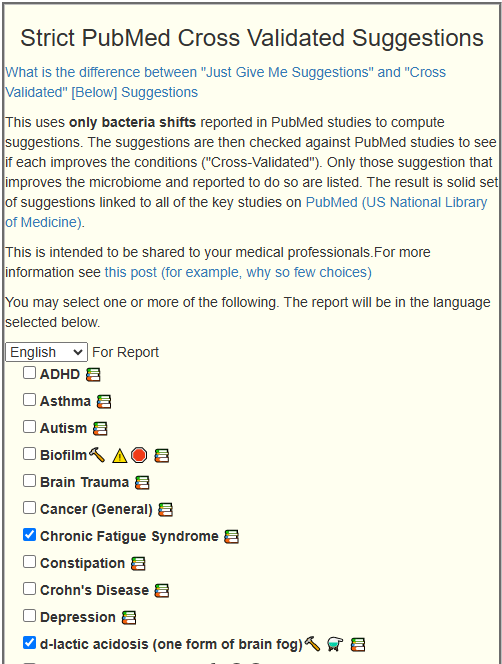
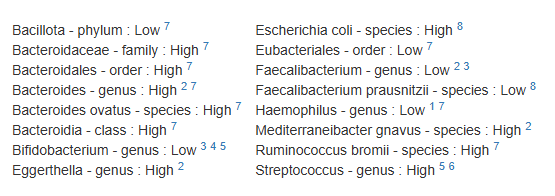
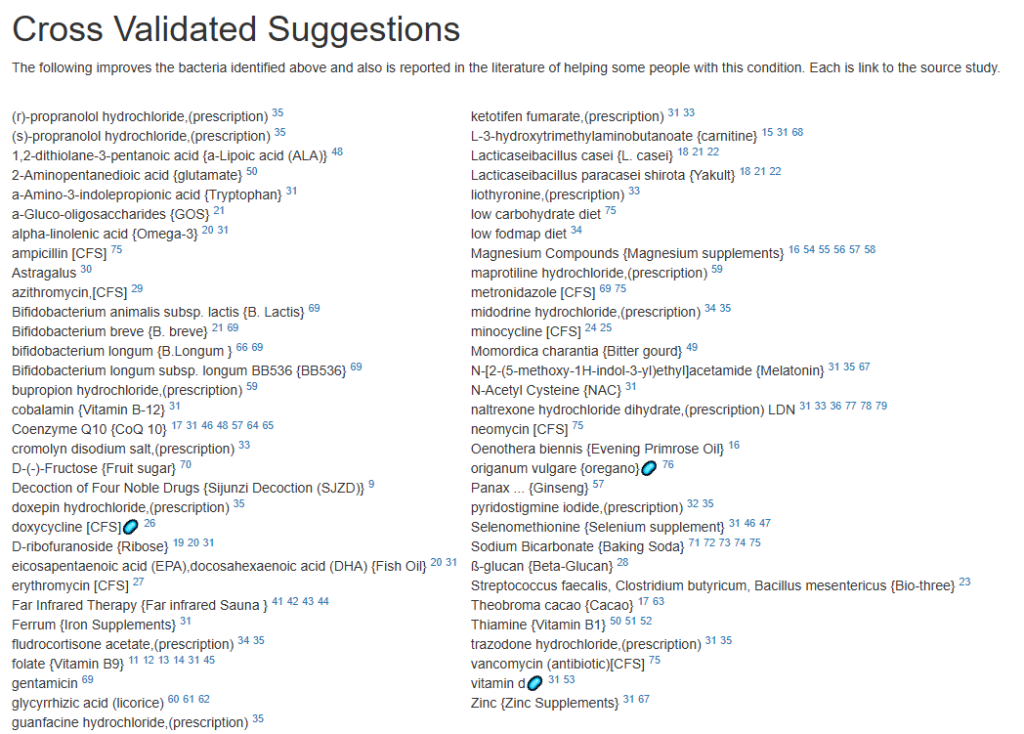
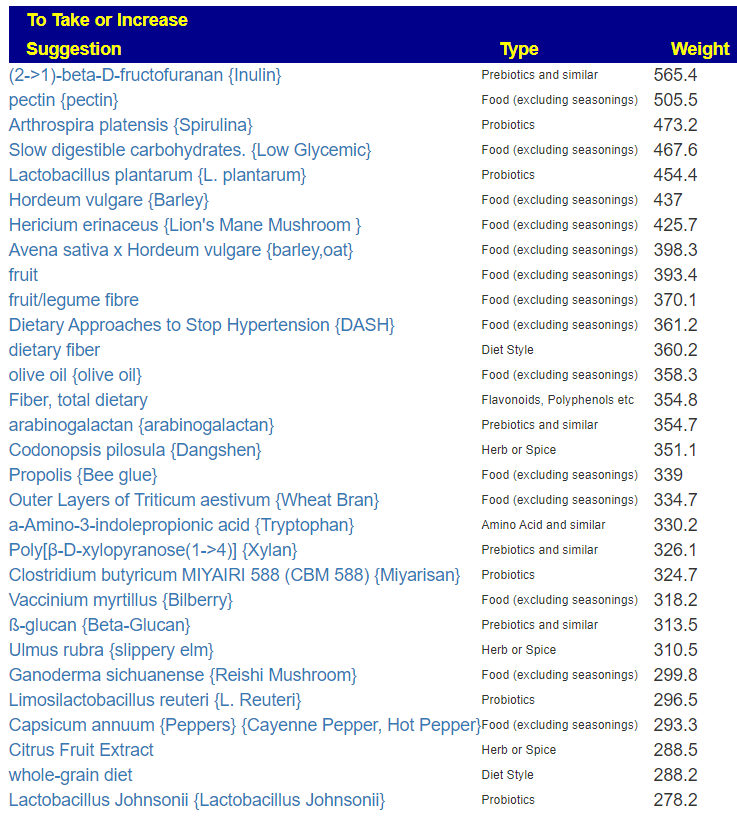
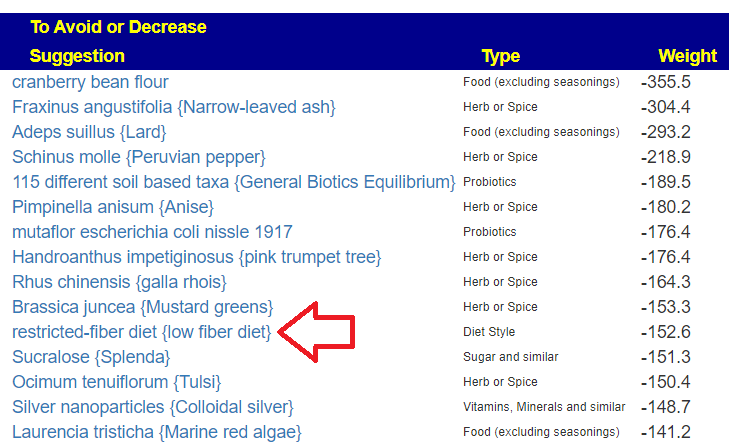
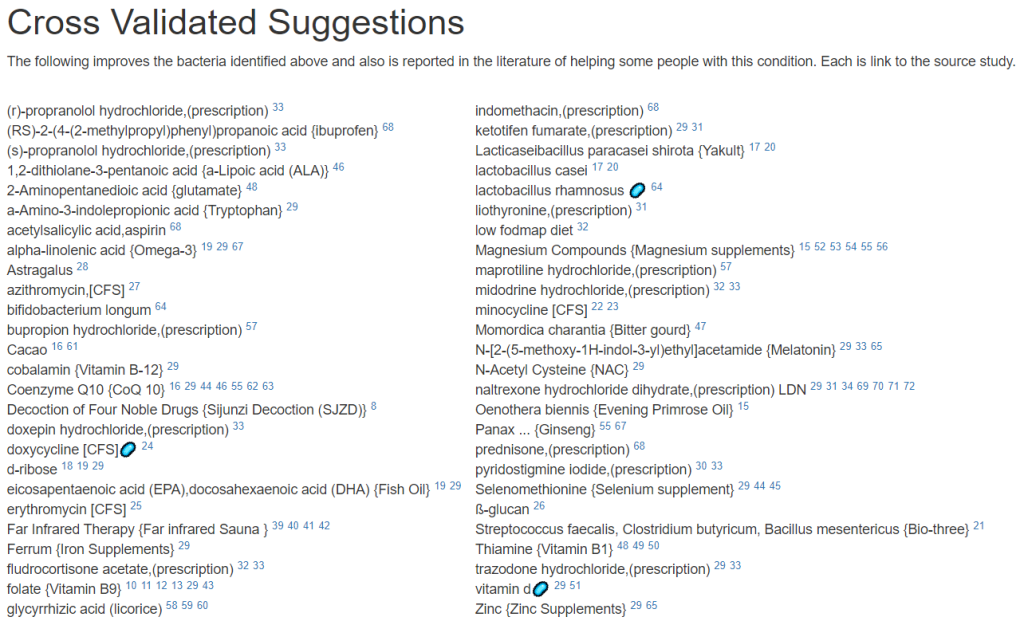
Since we are nominally dealing with ME/CFS, we can use the cross validated suggestions to get conservative suggestions of what may help
The result is a massive list!
We will backtrack to “Just Give Me Suggestion Including Symptoms” so we can rank order these suggestions.
The top items are antibiotics, with 60% being those used to treat ME/CFS (i.e. on the above cross validated list). I tend to follow Jadin’s approach so, do one of those marked [CFS] for a course (7-10 days) and the next month(3 weeks off), move to a different one. After the 3rd one, get a new microbiome test to see the next course adjustment.
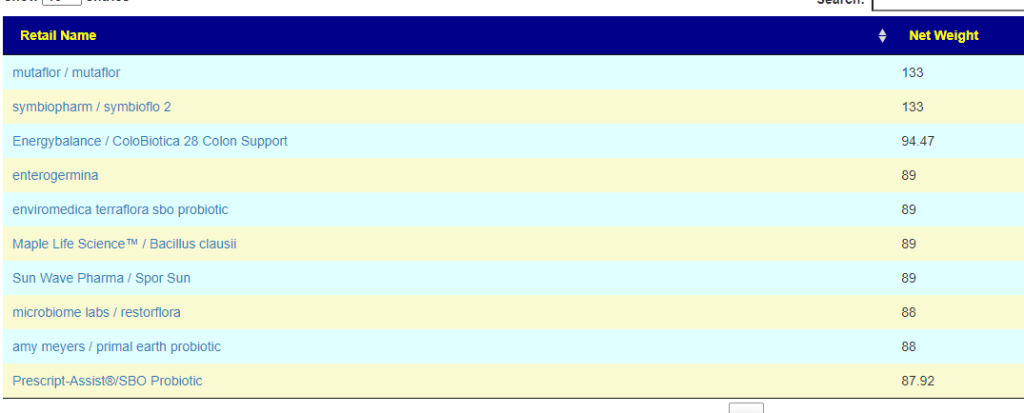
Probiotics are dominated with Bifidobacterium species. I would tend to do 3 weeks on one strain between antibiotics, working up to a dosage of 50 BFU. At present, my favorite source is Maple Life Science™: they ship worldwide, typically the packages arrive with manufacture dates 4-6 weeks before (thus LIVING probiotics), and very reasonable cost. Yakult and Kefibios can be difficult to obtain in some countries.
Going over to KEGG suggested probiotics and although we are approaching it from a totally different path, we have consensus.
For prebiotics, just three stand out, take them with the above probiotics
For vitamins (can be taken continuously), I would suggest adding them one at a time (every 3-4 days) in case some create significant (good or bad) reactions.
For flavonoids, the list is very ME/CFS typical.
Second Pass – Cross Validated Suggestions
I picked these from the short list of options in the old UI.
The number of bacteria matches were relatively few.
The suggestions are shown below. Note that Lacticaseibacillus casei and Lacticaseibacillus paracasei shirota. Are on this list, just as they were above. Avoid other lactobacillus probiotics.
Questions and Answers
Some questions: — what are your thoughts on the sky-high levels of Bilophila (any specific advice on managing that?) and the very low overall species diversity. I did some troubleshooting with a CGM, and every time I eat some animal fat—and to a lesser extent, animal protein—after carbs, I experience a hyperglycemic spike. I attribute that and my brainfog to a Bilophila overgrowth (H2S & acetaldehyde). When I’m on a vegan diet, my blood sugar is generally perfect, except for one hypoglycemic event at night but it’s really problematic to sustain this diet long-term. — also, which advice here is aimed at increasing lactobacillus abundance as the recommended probiotics are mostly bifido?
Response
Here we hit a philosophy crossroad.
The road most travelled is focusing on the bacteria most heard about and trying to address them one by one.
The road that I take is to ignore this chatter, and aim to adjust everything in one pass using mathematical models.
Often I have read that something like Lactobacillus increases for a subset of people if other bacteria are present, (or absence).
I view this approach is most likely to cause desired changes and not chasing this bacteria or that bacteria.
Microbial Interdependence
Microbial interdependence occurs when different bacterial species rely on each other for growth or survival. This can happen through various mechanisms:
Metabolic cross-feeding: One species produces metabolites that another species uses for growth.
Signaling interactions: Chemical signals from one species trigger responses in another.
Modification of the environment: One species alters the local environment in ways that benefit another species.
Given that concentration is an issue, there is a high probability that high d-lactic acid is involved. This would cause me to suggest avoiding lactobacillus probiotics entirely. It is impossible to determine which retail brands produce d-lactic acid.
Bottom Line
Go slow, slowly increase dosages, keep track of your reactions on paper (or electronically). Some suggestions will have no effect, others may have dramatic effects.
Postscript and Reminder
As a statistician with relevant degrees and professional memberships, I present data and statistical models for evaluation by medical professionals. I am not a licensed medical practitioner and must adhere to strict laws regarding the appearance of practicing medicine. My work focuses on academic models and scientific language, particularly statistics. I cannot provide direct medical advice or tell individuals what to take or avoid.My analyses aim to inform about items that statistically show better odds of improving the microbiome. All suggestions should be reviewed by a qualified medical professional before implementation. The information provided describes my logic and thinking and is not intended as personal medical advice. Always consult with your knowledgeable healthcare provider.
Implementation Strategies
Rotate bacteria inhibitors (antibiotics, herbs, probiotics) every 1-2 weeks
Some herbs/spices are compatible with probiotics (e.g., Wormwood with Bifidobacteria)
Verify dosages against reliable sources or research studies, not commercial product labels. This Dosages page may help.
Individual health conditions may make some suggestions inappropriate. Mind Mood Microbes outlines some of what her consultation service considers: A comprehensive medical assessment should consider:
Terrain-related data
Signs of low stomach acid, pancreatic function, bile production, etc.
Detailed health history
Specific symptom characteristics (e.g., type and location of bloating)
My journey to how I ended up where I am now is that I’ve always been one to catch illnesses like colds, flus, and stomach bugs easily. I was also frequently medicated with antibiotics for many years as a kid. Looking back, of course my microbiome is a mess.
To date, I have had COVID 6 times (that I know of/positive tests – there was probably more that didn’t “show up” or that I may have dismissed as a cold).
The first time I had Covid was January 2020, before it was “a thing”. It was later confirmed that it was indeed COVID, with an antibody test sometime in February-March 2020 when I donated blood. I was the sickest I’ve ever been in my life (26yo then, I’m 30 now). My main symptoms were feeling out of breath and lightheaded, as well as gastrointestinal (diarrhea and vomiting) – which at the time, no one was acknowledging that COVID could have any gastro symptoms, so I kept getting dismissed that it couldn’t have possibly been COVID. I was sick for a solid week and a half and it took me about 8 weeks to get back to feeling somewhat normal and not out of breath etc.
I’ve missed so much work because of this illness and I just keep catching it – the most recent time being just a month ago.
I developed the skin condition Rosacea around late 2022-early 2023 which I believe is microbiome related – I’ve tried many topical prescriptions that don’t do a dang thing, and it has since spread to my eyes and I now have Ocular Rosacea as well.
I’ve always had chronic constipation but it is worse since 2020. I have fatigue and am always tired, no matter how much I sleep. At one point I had high iron, so I was told to donate blood to lower it, but then my iron and ferritin fell so low that I was told to stop and instead take iron supplements to get my iron and ferritin back up – which I cannot tolerate, because it causes stomach issues for me.
I’d love to figure out how to really improve my microbiome and finally heal from all of this. I’m constantly living in fear that I’ll catch COVID again and lose any progress I’ve made.
Analysis
Rosacea is a chronic inflammatory skin condition that can have systemic effects and comorbidities. While not directly linked to ME/CFS or long COVID, it shares some characteristics of chronic inflammatory conditions. I have encountered several ME/CFS with it
Constipation is commonly associated with ME/CFS (Myalgic Encephalomyelitis/Chronic Fatigue Syndrome).
Both are suspected to be cause by imbalance of gut flora (microbiome).
We see a lot of pattern matching to other people with the same symptoms.
But since we are dealing with a situation with some cross-validation data being available (i.e. lists of things with studies that helps with the symptom/diagnosis), I like to start there. On [Changing microbiome tab].
Updated Analysis
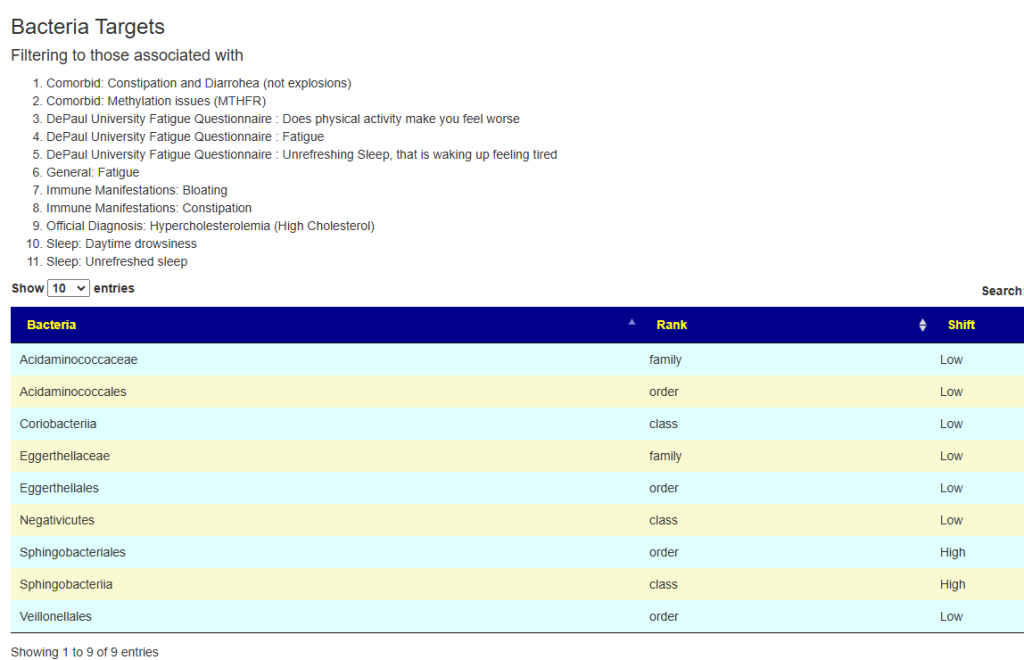
The original draft was done before the Simple UI was released. There was 6 forecast matches over 70%, so I went with symptoms, Despite having 11 symptoms, only 9 bacteria was selected.
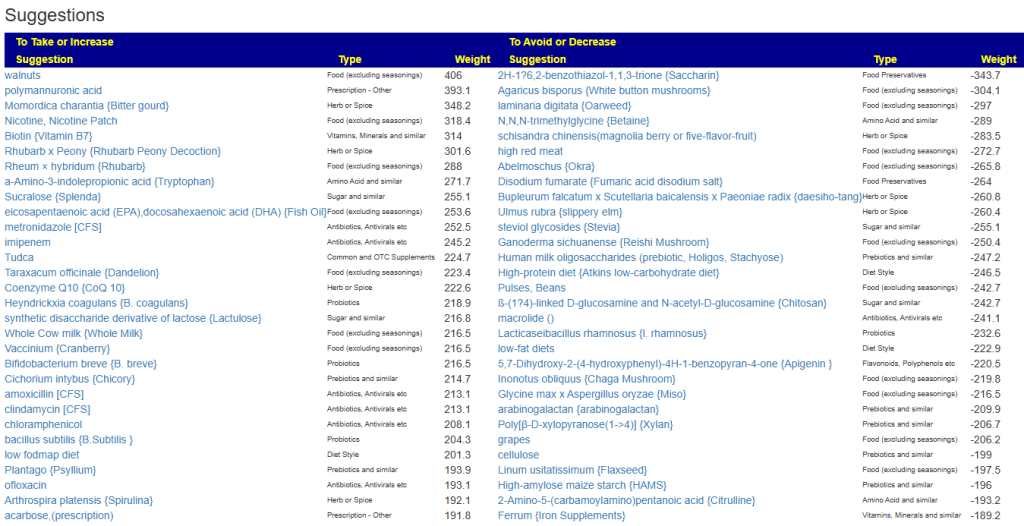
The suggestions are shown below
Probiotics
These are the top items, some can be hard to get. Some of my usual sources are:
The above are based on how they are known to alter other bacteria from published studies. Next I swing over to KEGG to see which probiotics can provide metabolites and enzymes that the person is low in. This is a complimentary approach that does not depend on a study being done, rather working from the DNA of the microbiome. I have annotated the above with their [Metabolite/Enzymes] scores above. The highest lactobacillus was 4, Bifidobacterium [7]. One bacillus ranked high, but is not easily available as a probiotic: Bacillus thuringiensis -[15/9]. My preferred sequence would be to start with B.Subtilis and then B. Coagulans.
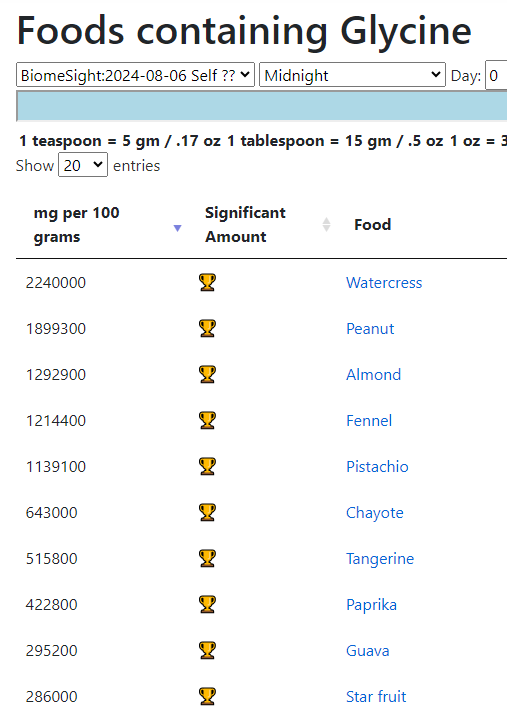
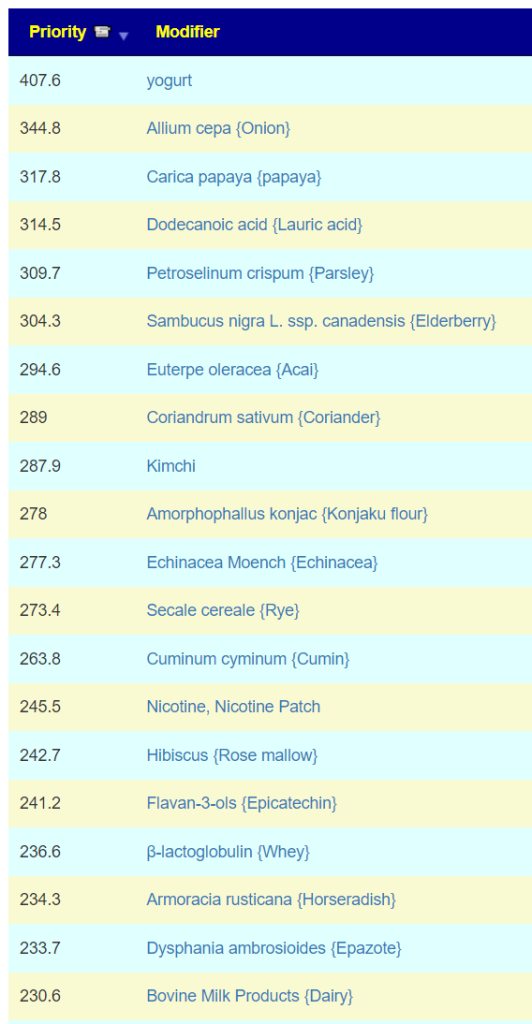
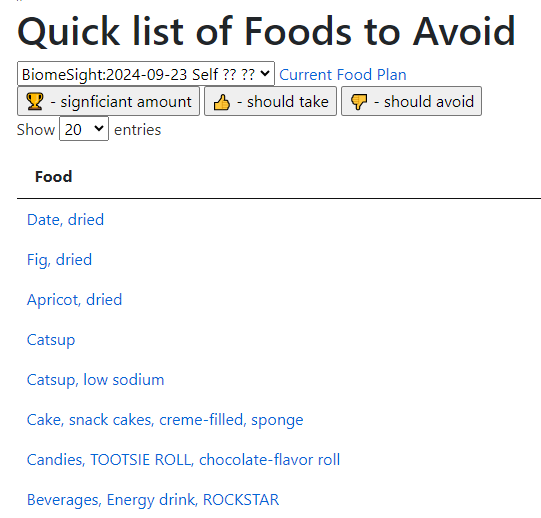
Foods
The food menu suggests that Turkey and Chicken are the best meats. Kiwis and Soy are next. To avoid: carrots, beans, sweet potatoes,
Vitamins are the usual for ME/CFS
One word of warning — do not use B-Complex. They contain some B-vitamins that are to be avoided. Get the specific B-vitamins shown.
Postscript and Reminder
As a statistician with relevant degrees and professional memberships, I present data and statistical models for evaluation by medical professionals. I am not a licensed medical practitioner and must adhere to strict laws regarding the appearance of practicing medicine. My work focuses on academic models and scientific language, particularly statistics. I cannot provide direct medical advice or tell individuals what to take or avoid.My analyses aim to inform about items that statistically show better odds of improving the microbiome. All suggestions should be reviewed by a qualified medical professional before implementation. The information provided describes my logic and thinking and is not intended as personal medical advice. Always consult with your knowledgeable healthcare provider.
Implementation Strategies
Rotate bacteria inhibitors (antibiotics, herbs, probiotics) every 1-2 weeks
Some herbs/spices are compatible with probiotics (e.g., Wormwood with Bifidobacteria)
Verify dosages against reliable sources or research studies, not commercial product labels. This Dosages page may help.
Individual health conditions may make some suggestions inappropriate. Mind Mood Microbes outlines some of what her consultation service considers: A comprehensive medical assessment should consider:
Terrain-related data
Signs of low stomach acid, pancreatic function, bile production, etc.
Detailed health history
Specific symptom characteristics (e.g., type and location of bloating)
ME/CFS has many causes, a very common cause are virus (in the case of Long COVID, the COVID virus).
Back Story
A quick summary of my story: I got ME/CFS after two viruses about a month apart in late 2016, when I was 27 – one upper gastrointestinal and one upper respiratory. After struggling to work for a couple of months after my body eventually gave up and I had to be signed off sick, and then eventually let go. I haven’t returned to any work since. I would say I am at the moderate end of the spectrum – able to socialise outside of the house on occasion as long as transport isn’t too strenuous, but not well enough to do things on a consistent basis, with obviously lots of rest all the time. Since then I’ve been on a journey seeing various doctors mostly to no avail, although not for a few years now.
My main symptoms now:
Fatigue
Muscle weakness
POTS
Unrefreshing sleep
Various mild / moderate pain
Very prone to overheating / sweating
I take 40mg Duloxetine once a day, ostensibly for nerve pain although it has helped significantly with my overall energy levels and wellbeing, moving me from severe to moderate from when I started taking it a few years ago.
It’s worth pointing out that over the course of my illness I have tried several probiotics and things suggested with the gut. These are as follows (if I remember correctly):
Optibac
BioKult
Generic acidophilus probiotic
GI Synergy antimicrobials
Yakult (more on that in a minute)
Every single one of these has caused these symptoms of varying severity:
Increased blood pooling
Sore throat
Flushing
Fatigue
Disorientation
General malaise
So in general I have stayed away from things to do with the gut because of these bad experiences. Yakult is actually something I stopped only recently – I read your blog post about d-lactate and given it’s so cheap and easy to get hold of decided to give it a go. I would say that while the other probiotics caused those symptoms almost on the first or second dose, with Yakult it took a lot longer to set in. I took it for 3 weeks before I finally realised that I was at the same place symptom-wise as the others, it just took me much longer to get there. A shame as it i was a low-cost and easy thing to try. They’re obviously all doing something! Just not what I’d like, haha.
I did the simple suggestions option since the number of symptom matches to symptoms prediction was low. We found 43 bacteria out of range. None of the following probiotics were on the recommended list: Optibac, BioKult, Generic acidophilus probiotic, GI Synergy antimicrobials, Yakult
Going over to KEGG Computed Probiotics Report, we have these being the top one
Limosilactobacillus reuteri – On main suggestion list
Since economics is cited, I would suggest ordering one bottle of each from Maple Life Science. They are direct from factory to retail customers; ships world wide; no shipping costs. Cost per bottle is around $9
Limosilactobacillus reuteri
Lactiplantibacillus plantarum
Lacticaseibacillus rhamnosus
Bacillus Subtilis
For the other ones, see how you react to these first. My usual suggestion is one capsule for ONE of these on the first day, increase according to your reaction. If adverse reaction, move on to the next one. Once the bottle is empty, go to the next one.
Personally, my own ME/CFS experience favors Mutaflor — but it created a massive herx for 2 weeks; so I tend to suggest moving it to the very end.
Other issues
I have no information on Duloxetine impact on the microbiome. Other suggestions have many familiar in treating ME/CFS over the last 30 years. The include:
Unusually, B-vitamins are not high on the list. If you take them, keep to Vitamin B1,B2 and B12.
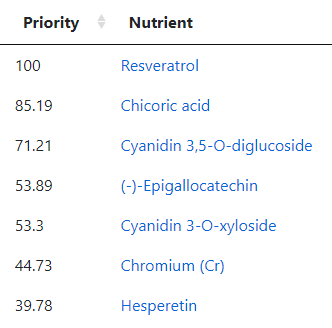
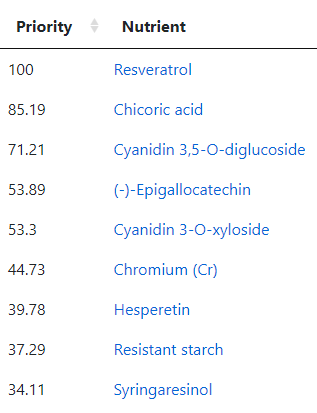
Going over to the Food Site we have these nutrients at the top
The first one, Resveratrol, is found in fresh grapes in the supplement form is not desired. The second one is mainly in raw Chicory . The third one is found in Black elderberry (and a small amount in Pomegranate). The fourth item, (-)-Epigallocatechin, is found in Green/Oolong Tea and Broad Beans. The next one, Cyanidin 3-O-xyloside, is mainly in Black chokeberry (and a small amount in Blackberries). Hesperetin is found in Lime and Oranges (not orange juice). Resistant starch is in Broad Beans, Lentils and Peas. Syringaresinol is found in Rye (i.e. whole 100% rye bread) and the Swedish Cloudberry (likely out of season now). Diosmin is found in Hyssop (I tend to buy it as a supplement).
As a FYI, my regular “ME/CFS preventative” diet is usually heavy in grapes or Resveratrol (depending on season and price); 100% Rye Bread; Broad Beans and Lentils; Hesperetin and Diosmin.
Questions And Answers
Q: The herx / die off stuff do you have any guidance on that? What I meant was: given my adverse reactions to any probiotic I have tried – whether that’s on the same day after initially taking, or eventually building up after several doses – how can I tell the difference between a reaction that’s bad and should cease taking it, or supposed “die off” symptoms, if you see what I’m saying. Basically how to tell the difference between stopping needing to stop taking a probiotic due to the symptoms its producing, or pushing on, and seeing if it tails off. Does that make sense?
Your question makes a lot of sense. I have done a few posts on that:
The issue is more complex for probiotics because often extra ingredients are included which some people react to.
A short version for probiotics is this:
If the adverse effect is ongoing 18 hours later, it is likely an adverse reaction or feeding bad bacteria. Many studies find that some probiotics are not detectable after 24 hours (not true for all of them).
The duration of the reaction should be decreasing each day. You should feel a little better after the effect ebbed each day. Often, there can be a quick ending of the reaction. If it increased or do not change, it is likely an adverse reaction or feeding bad bacteria.
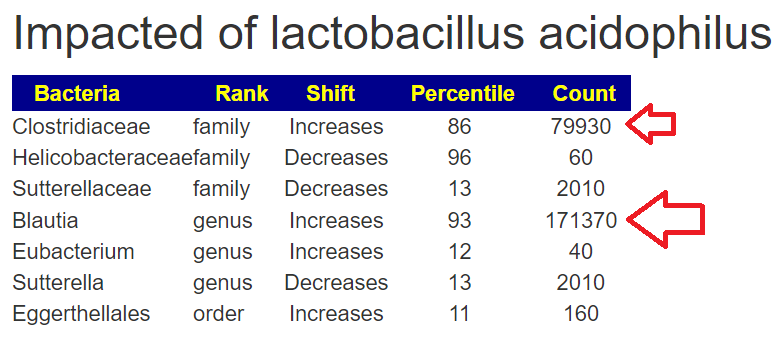
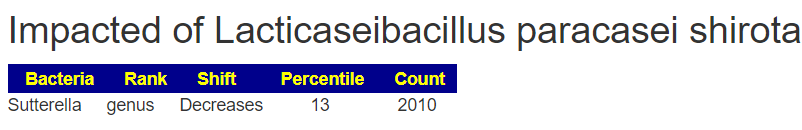
I have improved the Lookup Modifier Page to flag what a probiotic is impacting. You need to break a mixture apart and examine it parts. Most of his probiotics were mixtures containing L. Acidophilus. Note that Sutterella is in common with both
Postscript – and Reminder
I am not a licensed medical professional and there are strict laws where I live about “appearing to practice medicine”. I am safe when it is “academic models” and I keep to the language of science, especially statistics. I am not safe when the explanations have possible overtones of advising a patient instead of presenting data to be evaluated by a medical professional before implementing.
I cannot tell people what they should take or not take. I can inform people items that have better odds of improving their microbiome as a results on numeric calculations. I am a trained experienced statistician with appropriate degrees and professional memberships. All suggestions should be reviewed by your medical professional before starting.
The answers above describe my logic and thinking and is not intended to give advice to this person or any one. Always review with your knowledgeable medical professional.
As I’ve been suspected to have Lyme disease, I have taken antibiotics for several months which have damaged my microbiome. Now I am taking antibacterial herbs. * As my brain fog severely increased, I need your help to adjust my strategy. In addition, there are some specific questions: I am contacting you as I have done a new microbiome analysis with BiomeSight. I haven’t been doing well in addition to my previous health issues. As I’ve been suspected to have Lyme disease, I have taken antibiotics for several months which have damaged my microbiome. Now I am taking antibacterial herbs. As my brain fog severely increased, I need your help to adjust my strategy. In addition, there are some specific questions: ❔mutaflor isn’t among the suggestions done. Would it be a good thing to add it ? ❔how long should I wait between probiotics and antibacterial herbs ?
From Email
Analysis Of Data
I have a pretty fixed attitude to Lyme
It’s Lyme only with a very clear laboratory result (i.e. tests for actual Borrelia species and strains and conforms to the rest of CDC criteria).
“Chronic Lyme” is likely post-infection syndrome and the use of “Lyme antibiotics” can often do more harm than good. “Suspected Lyme” is a red flag that the medical practitioner is outside of their depth.
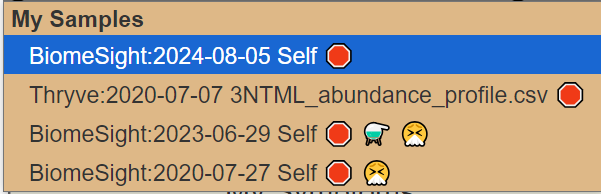
We have three samples available. There was some apparent improvements from earlier samples (
Comparing current sample to the first sample is shown below. The number of bacteria reported is almost half of the prior test, making comparison difficult, but my impression is that there was some improvement.
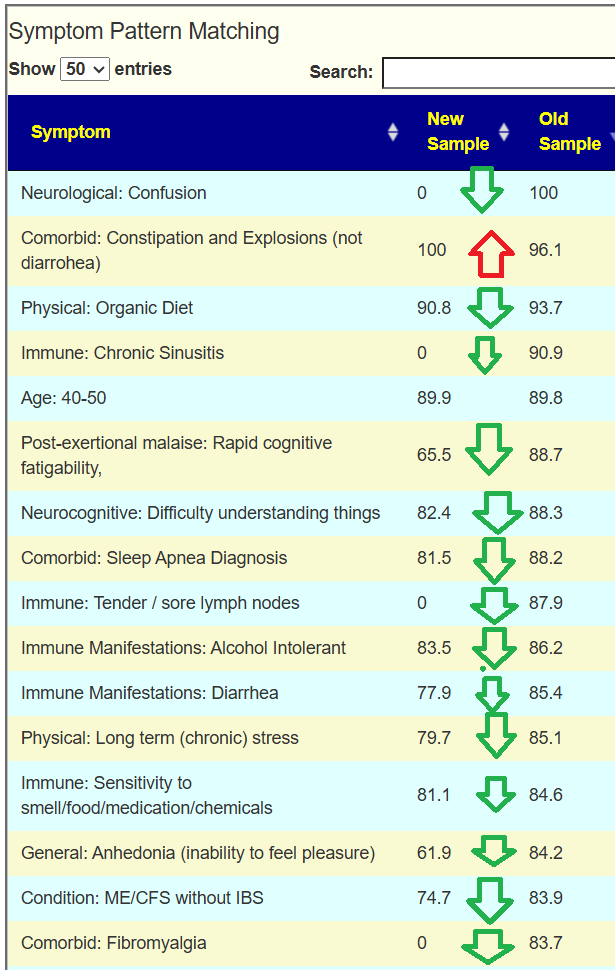
Looking at the new symptom matching comparison , we see some significant drops.
Going Forward
Since symptoms have been entered, we will go with [Beginner-Symptoms: Select bacteria connected with symptoms]. This results in 29 bacteria being identified (about 8% of the bacteria – my preferred range is 4- 12% being flagged to be of concern).
The top suggestions are below which are heavy in fiber and beta-glucan. A common pattern with post-infection syndrome.
The numbers in the [ ] are the number of compound that are low that the probiotic produces. Enzymes shortage usually leads me towards probiotics because they are producers of many enzymes. Most of these enzymes are not available as supplements. When there are shortages, bacteria misbehaves… “when the manager is empty, horses bite”
My suggestion for rotations (1 probiotic for 1-2 weeks and then move on to the next)
At this point, we branch into two additional paths — one by using Kyoto Encyclopedia of Genes and Genomes (KEGG) data on compound being produce and consumed by your microbiome. With KEGG we look for probiotics that can provide enzymes etc that you are deficient in. Why these alternative paths? Simple, there is not enough data available so we use inference.
The second path is going to the food site to identify foods rich in suggested nutrients. The foods may not have been used in studies, but the dominant nutrients in the foods may have been studied.
KEGG
The top suggestions are below. #1 item is common for ME/CFS, Mutaflor is available in some countries in Europe, I warn people that it may cause a major die-off / herx reaction. Symbioflor 2 is the same probiotic species but at ~ 1/100 of the BCFU and unlikely to cause die off. These are reasonable “2nd rank” probiotics to try. The evidence is by inference and not direct study.
Food
Going to the food site, we find walnuts, almonds,cocao/dark chocolate, and beef at the top of the list. The following food groups should be added to the menu also:
Questions
❔ Brain fog
Usually this is due to d-lactic acid which is produced by some Lactobacillus species but not by Bifidobacterium and others. You may wish to skip those in the above list. Thick blood is another common cause for brain fog. Other things to try (assuming d-lactic is the cause):
Sodium Bicarbonate (baking soda)
Thiamine (Vitamin B1) – Low on Avoid list
Calcium Supplements – Low on suggestions list
❔mutaflor isn’t among the suggestions done. Would it be a good thing to add it ?
Mutaflor is at present on the avoid list but top of the KEGG list. It is worth doing a short trial to resolve if it is good or bad for you. I put it at the bottom of the list, in the hope that the other probiotics would cause changes that it can use.
❔how long should I wait between probiotics and antibacterial herbs ?
Typically I suggest 2-3 weeks of probiotics and then a switch. Above we have a variety of nuts (remember peanuts are not nuts) and other foods that are not deemed antibacterial. My general impression of the suggestions is that encouraging good bacteria (instead of killing bad bacteria) is the desired direction.
Postscript and Reminder
As a statistician with relevant degrees and professional memberships, I present data and statistical models for evaluation by medical professionals. I am not a licensed medical practitioner and must adhere to strict laws regarding the appearance of practicing medicine. My work focuses on academic models and scientific language, particularly statistics. I cannot provide direct medical advice or tell individuals what to take or avoid.My analyses aim to inform about items that statistically show better odds of improving the microbiome. All suggestions should be reviewed by a qualified medical professional before implementation. The information provided describes my logic and thinking and is not intended as personal medical advice. Always consult with your knowledgeable healthcare provider.
Implementation Strategies
Rotate bacteria inhibitors (antibiotics, herbs, probiotics) every 1-2 weeks
Some herbs/spices are compatible with probiotics (e.g., Wormwood with Bifidobacteria)
Verify dosages against reliable sources or research studies, not commercial product labels. This Dosages page may help.
Individual health conditions may make some suggestions inappropriate. Mind Mood Microbes. outlines some of what her consultation service considers: A comprehensive medical assessment should consider:
Terrain-related data
Signs of low stomach acid, pancreatic function, bile production, etc.
Detailed health history
Specific symptom characteristics (e.g., type and location of bloating)
This person has ME/CFS and is familiar with Cecile’s Protocol (see her 2023 presentation here). So my focus will be atypically on antibiotics.
I have just uploaded a new sample and I wanted to ask you if “just give me suggestions” is enough in order to get suggestions regarding a new antiobiotic therapy? Or is there anything else you would recommend me to check on your site?
From Email
Antibiotics Analysis
First, we have multiple samples available. Given that the microbiome is always changing. A first sample in the morning and last sample in the evening will rarely agree, I will actually review the suggestions from all 4 samples.
The table below contain only antibiotics that have been tried (with some degree of success) for ME/CFS
My impression is that a round of metronidazole, followed by amoxicillin, followed by a short round of ciprofloxacin appears to be consistent with the pattern of suggestions. From perplexity, I got:
Amoxicillin showed a moderate risk with an adjusted odds ratio of 2.29 (95% CI, 2.02, 2.60). However, it’s important to note that amoxicillin/clavulanate had a much higher risk than amoxicillin alone
Ciprofloxacin, a fluoroquinolone, had a risk level closer to later-generation cephalosporins with an odds ratio of 6.83 (95% CI, 6.56–7.10).
Since we have two samples over time from the same labs, I usually like doing a high level compare. First, the classic comparison which shows the two samples do not have major shifts. An increase of low enzymes usually points me to probiotics via KEGG computations.
Looking at the new Symptom Pattern Matching, we see a definite improvement (defined as having less bacteria matching symptom patterns). The amount was not huge, but it shows positive change.
A quick check of symptoms entered versus forecasted had a low match ratio and identified just 7 bacteria, all low: Streptococcus, Rhodospirillaceae, Oribacterium, Natronincola, Lactobacillales, Blautia and Bacilli.
The suggestions to correct these 7 are below. Because all of these are LOW, antibacterial herbs are usually on the avoid list.
Going to the default Novice choice, we get 38 bacteria with both highs and lows. As expected, we have some things changed from avoid to take – for example Neem. The bacteria selected makes a major impact on the suggestions (and why I keep working on better ways of selecting bacteria).
The Food Site is now working again so we can see the suggested best nutrients. The purpose of the Food Site is to transform scientific chemical names (nutrients) into foods.
All of these are based on the nutrients in these foods and the good/harmful nutrients calculated.
Postscript and Reminder
As a statistician with relevant degrees and professional memberships, I present data and statistical models for evaluation by medical professionals. I am not a licensed medical practitioner and must adhere to strict laws regarding the appearance of practicing medicine. My work focuses on academic models and scientific language, particularly statistics. I cannot provide direct medical advice or tell individuals what to take or avoid.My analyses aim to inform about items that statistically show better odds of improving the microbiome. All suggestions should be reviewed by a qualified medical professional before implementation. The information provided describes my logic and thinking and is not intended as personal medical advice. Always consult with your knowledgeable healthcare provider.
Implementation Strategies
Rotate bacteria inhibitors (antibiotics, herbs, probiotics) every 1-2 weeks
Some herbs/spices are compatible with probiotics (e.g., Wormwood with Bifidobacteria)
Verify dosages against reliable sources or research studies, not commercial product labels. This Dosages page may help.
Individual health conditions may make some suggestions inappropriate. Mind Mood Microbes outlines some of what her consultation service considers: A comprehensive medical assessment should consider:
Terrain-related data
Signs of low stomach acid, pancreatic function, bile production, etc.
Detailed health history
Specific symptom characteristics (e.g., type and location of bloating)
I have had a long history of consuming high sugar and high carb junk foods. Recently, in October 2022, I noticed significant weight loss and developed chronic constipation.
Other Ideas: Considering FMT using my 1.5-year-old breastfed son’s stool for microbial diversity after screening his poop using biomesight16s testing.
Current Symptoms:
Constipation
Weight loss and unable to gain weight.
No stomach acid
As an amusement, we have the microbiome suggesting some patterns that are in agreement. (India is very very eastern Europe!)
Looking at the new revised Simple UI we see a number of matches at the top of the list.
Analysis
Eubiosis is a shocking 0.3%ile with the following chart, note that there are a large number of very high %ile bacteria.
Looking at Health Analysis we see Overall Volume Percentile 17.3%ile | By different Taxa 92.6%ile – higher values indicates more leak. That is, the mouth may be really over-seeding the gut bacteria. This hints that a FMT may not last because the mouth bacteria will just move back in! The dominate leaked bacteria at the family levels OVER 90%ile are:
Scanning other factors, I see Rickettsia at the 100%ile and Morganella at 95%ile
In short, so many issues to chase!
Going Forward!
Since the person is in India where prescriptions are not needed for most antibiotics, I will include those. I am going with “Just Give Me Suggestions” — mainly because there are too many issues involved. KISS.
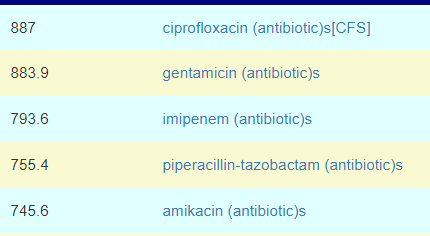
Top Antibiotics
Keeping with Cecile Jadin model, I would suggest trying one of these for 1 week each month. Rotating each month starting with Ciprofloxacin and then Piperacillin-tazobactam. You should discuss with your MD before starting.
Ciprofloxacin (a fluoroquinolone) is effective against Rickettsia [src]. Piperacillin-tazobactam (and most fluoroquinolone) is considered an effective first-line treatment option for Morganella infections [src]. Rifaximin (Protocol 1) is on the list but at 30% of the above weights. Fluconazole is at 10%
Other Substances
In the above protocols, there was a huge number of items tried — i.e. the herbal kitchen sink was tossed at you– probably without clear reasons for the choices. The effectiveness of the prior protocols may have been inhibited by the Rickettsia and Morganella.
S. boulardii is on the list (Protocol 1) but well down on the list.
I would suggest dissolving the powders in a glass of warm water (away from food),swish in mouth, gargling before drinking. This is directed at the Oral Bacteria.
The above was done with original UI (still there). Using just the 3 symptoms above, we have 21 bacteria identified that are associated to those symptoms. In terms of antibiotics, the top ones are all typically used with ME/CFS. The suggestions are changed from above because we are focused on only the bacteria associated with these 3 symptoms.
In terms of Probiotics, we have the following that are available from Maple Life Sciences (located in India, with a website too)
My current suggestion is to order one bottle of each (average cost $8-9) and start with one probiotic at one capsule, increasing slowly the dosage. When a bottle is empty, go on to the next bottle.
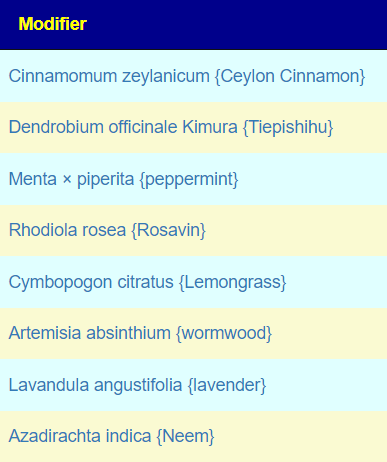
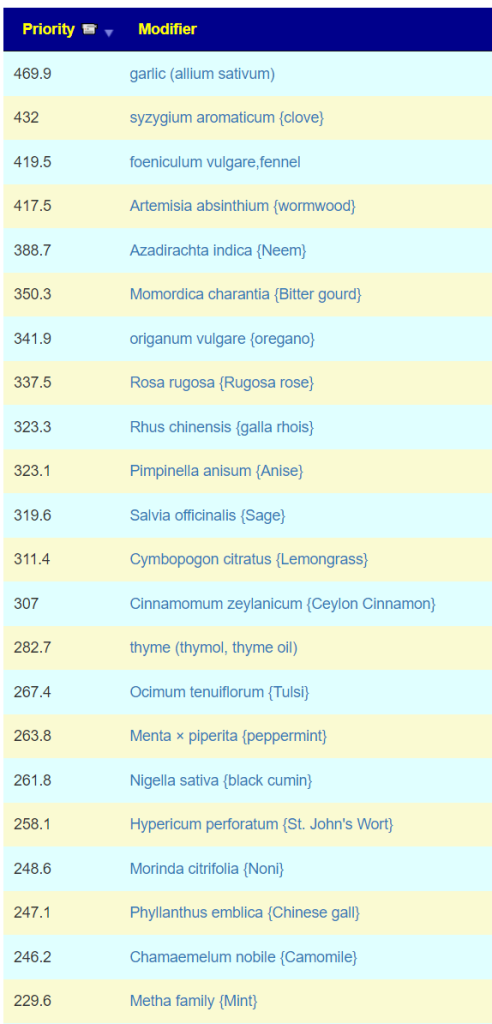
Top Herbs are:
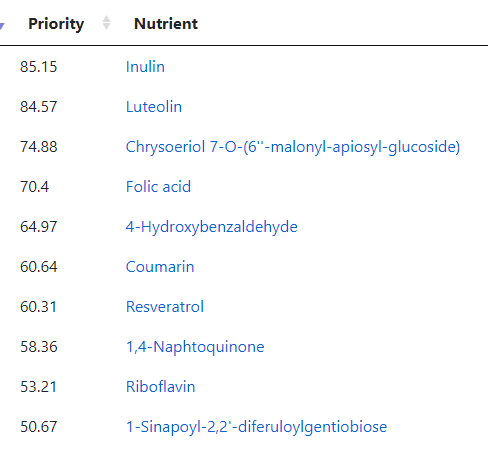
I jumped over to the food planner (which has been reactivated) and see these items:
Riboflavin — go supplements and/or Oats and Barley
1-Sinapoyl-2,2′-diferuloylgentiobiose: Raw Broccoli
Postscript – and Reminder
I am not a licensed medical professional and there are strict laws where I live about “appearing to practice medicine”. I am safe when it is “academic models” and I keep to the language of science, especially statistics. I am not safe when the explanations have possible overtones of advising a patient instead of presenting data to be evaluated by a medical professional before implementing.
I cannot tell people what they should take or not take. I can inform people items that have better odds of improving their microbiome as a results on numeric calculations. I am a trained experienced statistician with appropriate degrees and professional memberships. All suggestions should be reviewed by your medical professional before starting.
The answers above describe my logic and thinking and is not intended to give advice to this person or any one. Always review with your knowledgeable medical professional.
I have been struggling with my medical symptoms. After over a year of persistent fatigue, I found your blog, and would like some additional help with determining the issues in my gut microbiome.
I had mono(Epstein–Barr virus – EBV ) in high school. I have had COVID once, in December of 2021.
In November of 2022, I started feeling a bloating-like symptom in my stomach. I saw multiple doctors, and had two endoscopies and a colonoscopy done. Nothing was found. I was diagnosed with IBS, and told to take a probiotic. I took it (GBI 30, Bacillus Coagulans).
The very next day, and ever since, I have been dealing with chronic fatigue, along with associated symptoms such as headaches and joint pain (mostly in the legs).
I’ve seen a variety of doctors including GPs, GIs, a rheumatologist, and a naturopath. None have been of very much help. One GP thought I may have undiagnosed lyme due to the inaccuracy of lyme tests, so I took a four week course of doxycycline, which did not make me feel any better or worse. I have tried gluten free, dairy free, and added sugar free diets, none of which helped either. Various supplements from my naturopath also did nothing.
This is an interesting scenario. Typically the ME/CFS associated event is an infection, a vaccination, or antibiotic use. A probiotic being a trigger does fit the model — but definitely an edge case.
Analysis
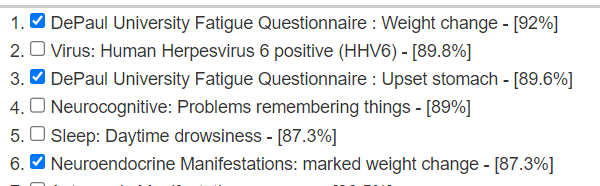
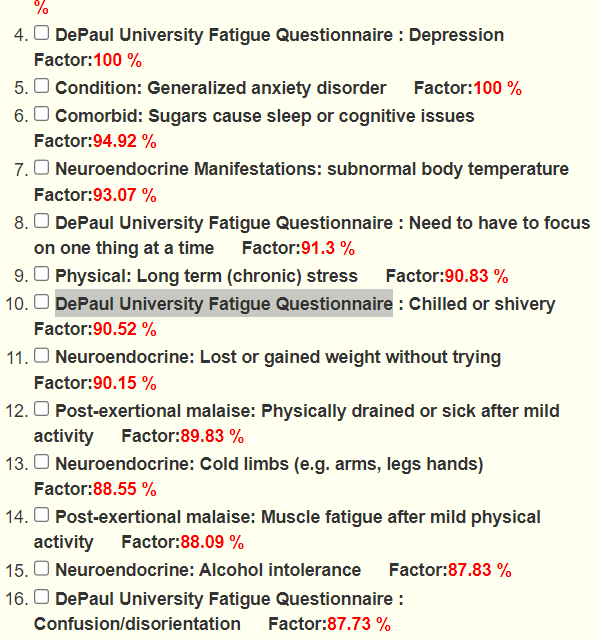
Looking at forecast symptoms, we see a lot of ME/CFS symptoms (DePaul University Fatigue Questionnaire was written for ME/CFS patients). A few is shown below.
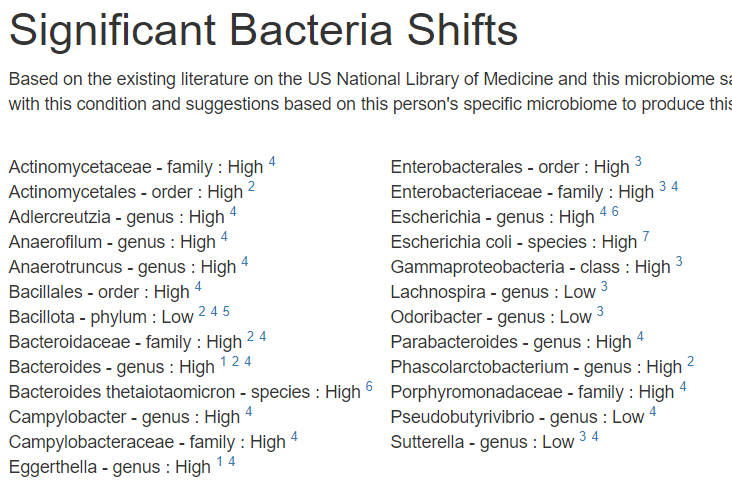
I am going to assume the ME/CFS is indeed a diagnosis and thus go to the cross validated suggestions. I am going to restrict to only ME/CFS-Long COVID. First, we see a lot of bacteria shifts match that reported in the literature for ME/CFS
We also get a lot of suggestions for things suggested by the microbiome shifts and also reported in published studies to help ME/CFS.
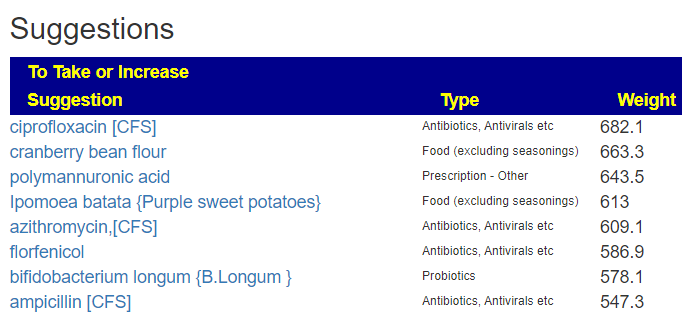
My reading of this reader is that antibiotics or prescriptions items are unlikely to be available. I then proceeded to [Just give Me Suggestions] so we can get priorities for the above.
All of the top items are a mountain of antibiotics (From a priority of 908 down to 433 when the first probiotic shows up). If the following does not make progress, the reader may wish to revisit that option.
My usual advice is to keep to items in the top 50%. Ignoring antibiotics, our preferred range is 210 to 433. Items below that are more iffy…
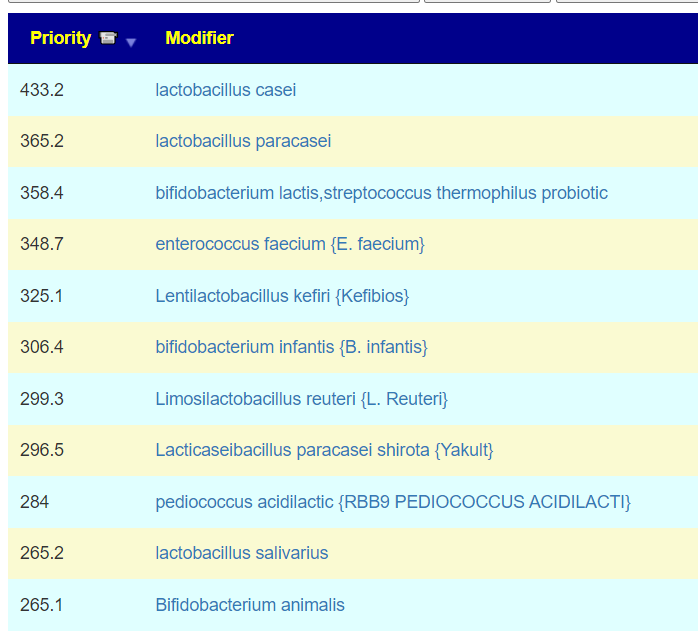
Probiotics
Many of these are related (L. Casei, L Paracasei, Yakult). Dosages should be around 50 BCFU with weekly rotation (i.e. do one each week and then move on to the next one).
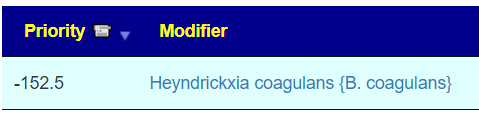
I then checked to see where Bacillus Coagulans ( renamed to Heyndrickxia coagulans) sit, and it is a definite avoid. B Coagulans triggering ME/CFS is very viable. Using KEGG, I hit the rare case of no probiotics being calculated.
We have a pretty rich list of foods. Rye and whole grain above go together strongest (Oats and Barley are weaker – WHEAT is a to be avoided). My suggestion for Rye is 100% Rye bread (NOT what is often labelled rye bread – a mixture of wheat and rye flour). Below is what I personally use (Amazon US) (Amazon UK equivalent)
Herbs and Spices
Again, a long list — often these have similar profiles to antibiotics, hence a lot of antibiotics suggestions often have a long list here. My own preference would to do:
1 Week of Neem, then
1 Week of Wormwood, then
1 Week of Tulsi, then
1 week of Oregano oil, then
etc
Wait, there’s more! Stuff to reduce or avoid
Lowest is -631, so items between 315 and 630 are definite avoids. All seaweeds related products
I favor Dr. Cecile Jadin approach of regular rotation and anything that inhibits or kill bacteria (antibiotics, herbs, spices and probiotic). This reduces the odds of the bacteria adapting around the mechanism that inhibits it. Always start with a low dosage and increase every second day — holding steady if die-off or other reactions appear. Once that has faded, resume the increase OR move on to the next item in the rotation.
Questions and Answers
Q: Although I do now notice that when I try to get the results again (I am using the simple UI), I see it is giving me different recommendations. Is this due to some sort of shift in the data used, some sort of difference between the Simple UI and the old UI, or am I misunderstanding?
The site is live data. There are several dimensions:
Adding new studies — recently I have been adding 20-30 per day. More studies should mean better suggestions
Associations of Bacteria to Symptoms are recomputed about once a week.
Thresholds for the reference range is computed about once a week.
The goal is to give the best suggestions at the time it is executed. I am aware that many people want absolute consistency from month to month; I am sorry but I prefer to give the best suggestions based on most current research.
Q: It’s interesting to see just how much of a shift has occurred- prescription antibiotics have gone from the number one recommendation, far outpacing everything else, to hardly on my top suggestions at all. That would make it easier for me to implement a plan, though, so I can hardly complain.
That shift is because of more studies being added to the database. One sweet study reported dozens of bacteria shifts for each antibiotic. The Algorithm counts the number of desirable or undesirable shifts for a modifier (i.e. antibiotic, probiotic, herb). Before the addition of more studies, the counts were very high for some antibiotics. Many of the probiotics went from 3 studies to 40 studies with the new additions, so the net weight of the probiotic or other modifiers went up and thus the antibiotics slipped down the list.
People can design algorithms in many manners — I tried many variations until I got one that had a strong cross-validation for ME/CFS (picked because I knew the literature well) and when I tested on a different condition, Nonalcoholic Fatty Liver Disease, I got 92% correct for substance to take and 83% correct for substances to avoid. In the machine learning/AI world those percentages are very, very respectable. Subsequent changes has been just increasing data volumes.
Postscript and Reminder
As a statistician with relevant degrees and professional memberships, I present data and statistical models for evaluation by medical professionals. I am not a licensed medical practitioner and must adhere to strict laws regarding the appearance of practicing medicine. My work focuses on academic models and scientific language, particularly statistics. I cannot provide direct medical advice or tell individuals what to take or avoid.My analyses aim to inform about items that statistically show better odds of improving the microbiome. All suggestions should be reviewed by a qualified medical professional before implementation. The information provided describes my logic and thinking and is not intended as personal medical advice. Always consult with your knowledgeable healthcare provider.
Implementation Strategies
Rotate bacteria inhibitors (antibiotics, herbs, probiotics) every 1-2 weeks
Some herbs/spices are compatible with probiotics (e.g., Wormwood with Bifidobacteria)
Verify dosages against reliable sources or research studies, not commercial product labels. This Dosages page may help.
Individual health conditions may make some suggestions inappropriate. Mind Mood Microbes outlines some of what her consultation service considers: A comprehensive medical assessment should consider:
Terrain-related data
Signs of low stomach acid, pancreatic function, bile production, etc.
Detailed health history
Specific symptom characteristics (e.g., type and location of bloating)
I’m writing because 8 months ago I got Covid and since then I have been very sick. My main symptoms are fatigue, exercise intolerance/pem, many histamine issues slash food intolerances, upset GI with alternating diarrhea and constipation, weight loss, headaches, anxiety and depression, panic attacks….the list goes on.
I know something is wrong with my gut but I’m having trouble fixing it because my diet is so limited and I have so many reactions to things. I know a limited diet is not good but I also feel so much worse when I eat certain foods especially carbs. I think I might have SIBO. I uploaded my profile to you site and would love any help. I’m giving permission to share.
Analysis
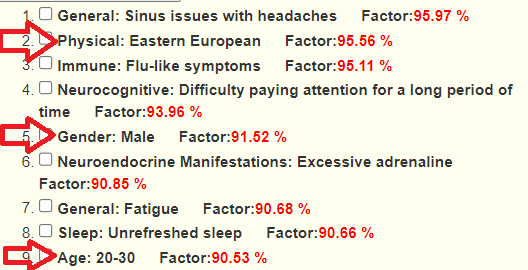
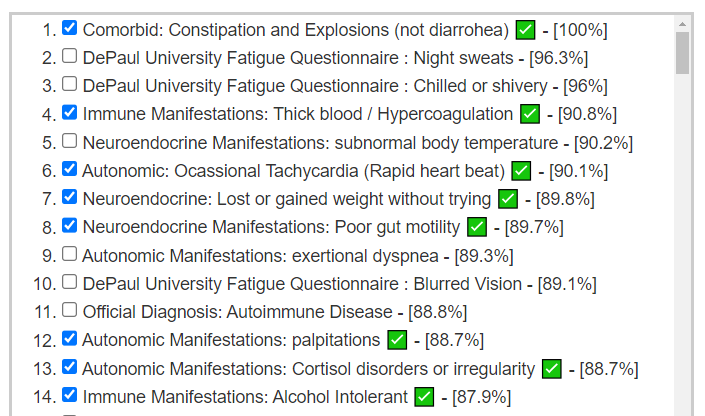
This person has added symptoms and we see a good match of bacteria shifts to reported symptoms
Further down, we have many more matches
Immune Manifestations: new food sensitivities ✅ – [86.7%]
We have 69 symptoms marked resulting in 44 bacteria flagged. This is common and shows that there is often bacteria overlap between symptoms. The other factor with symptoms is a person’s DNA.
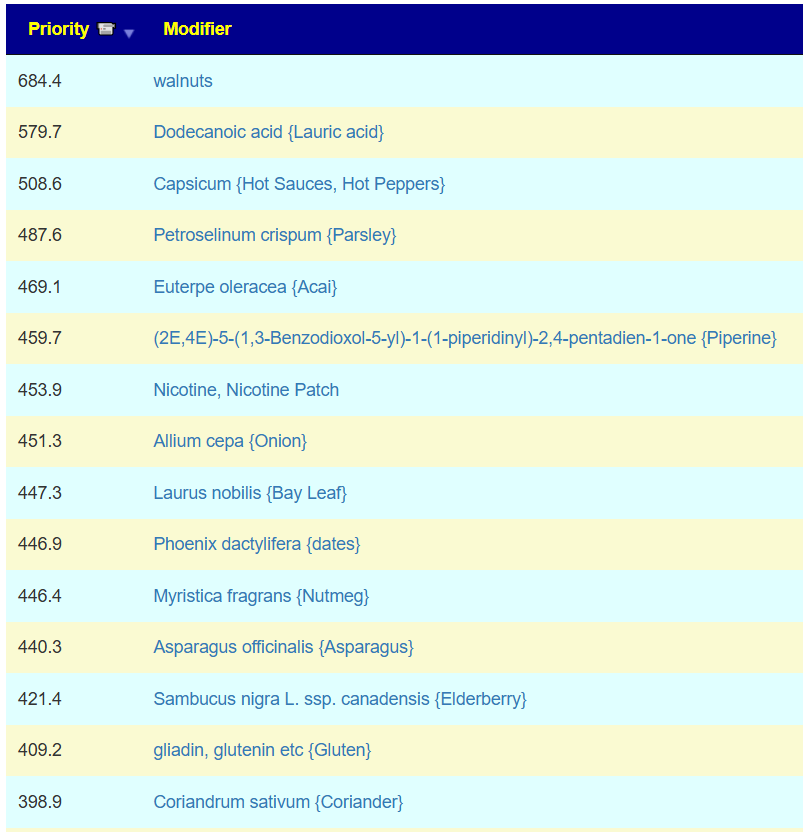
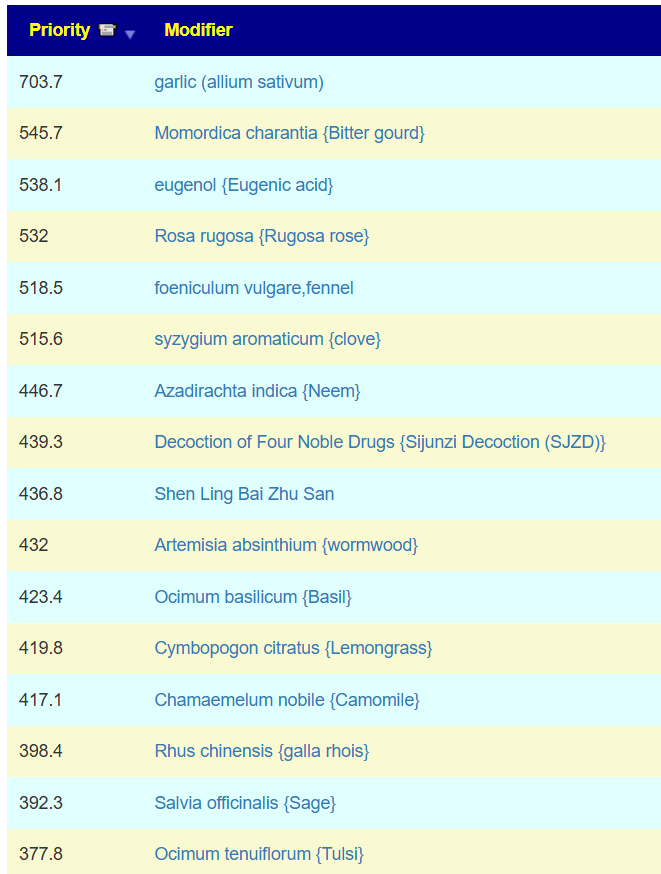
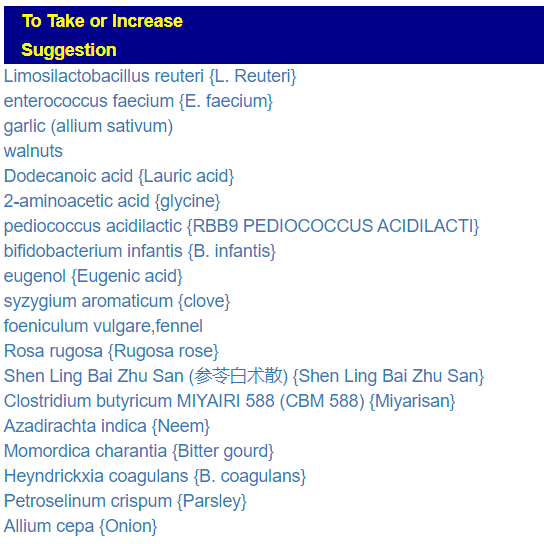
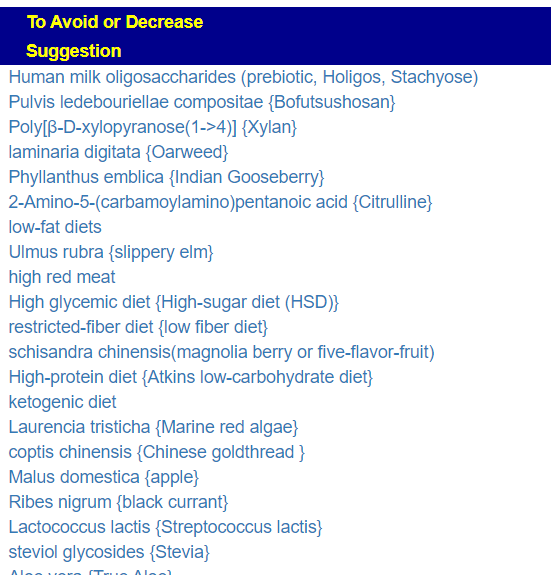
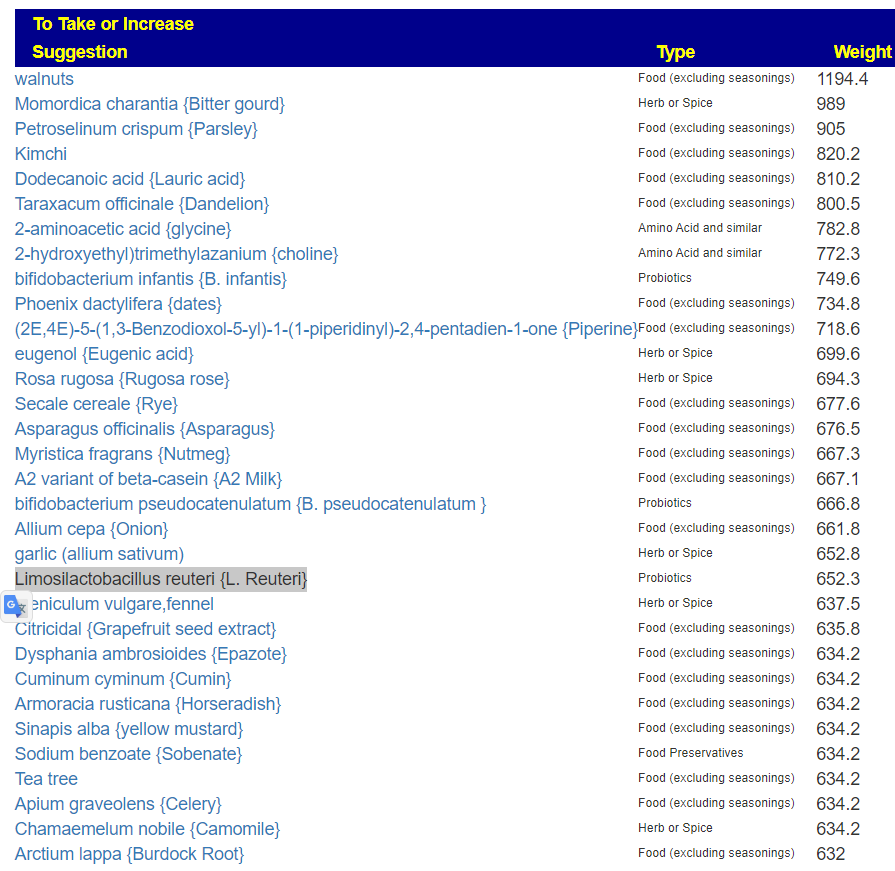
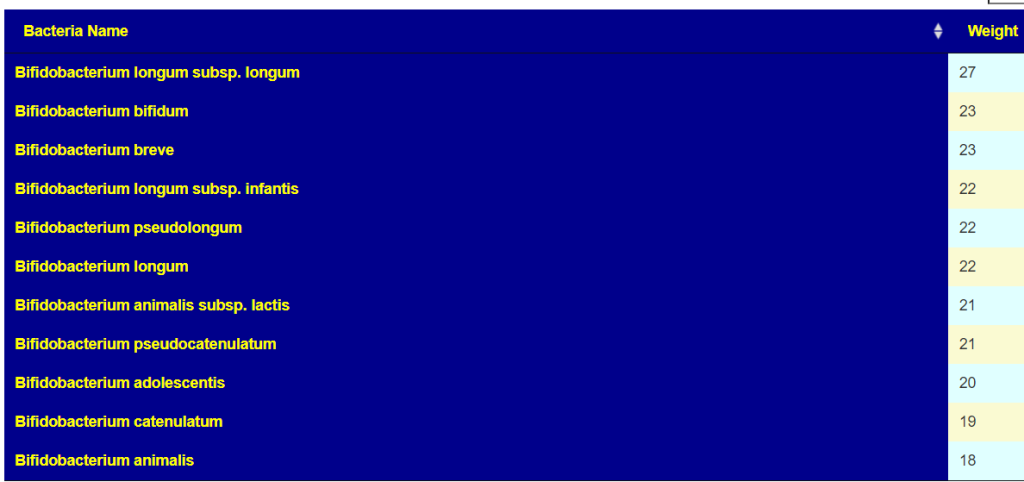
The best suggestion is walnuts. Looking at the probiotics, I was not surprised at the top ones:
Why am I not surprised…. because my own post COVID symptoms cleared rapidly when I did high dosages of fresh Bifidobacterium (manufacture date was the month before). The top of the list is below.
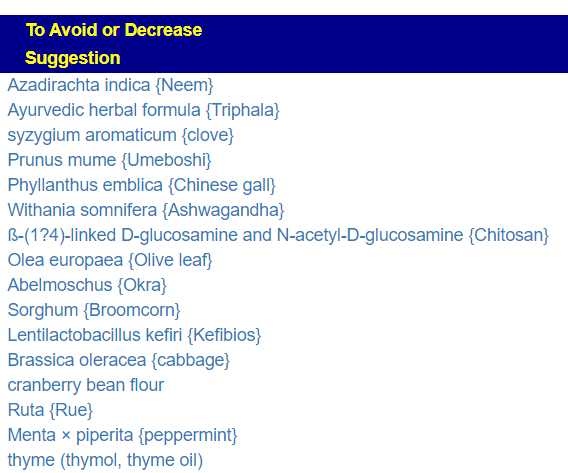
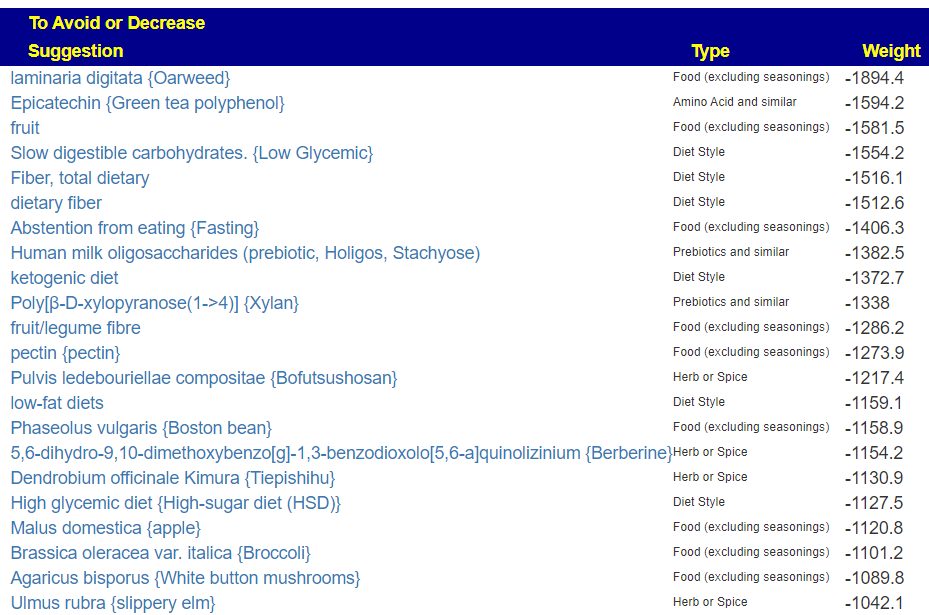
On the avoid list are many items that appear related to carbs (fiber) — what this person reacts to
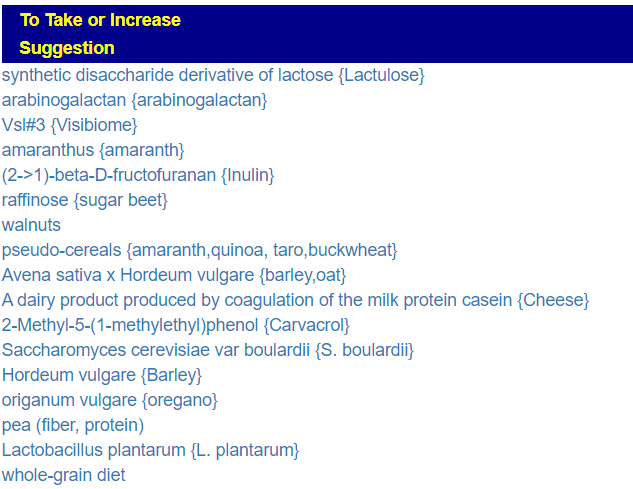
My take away for no known-risk probiotics are these items suggested
Various Bifidobacterium above were on the list too.
Foods
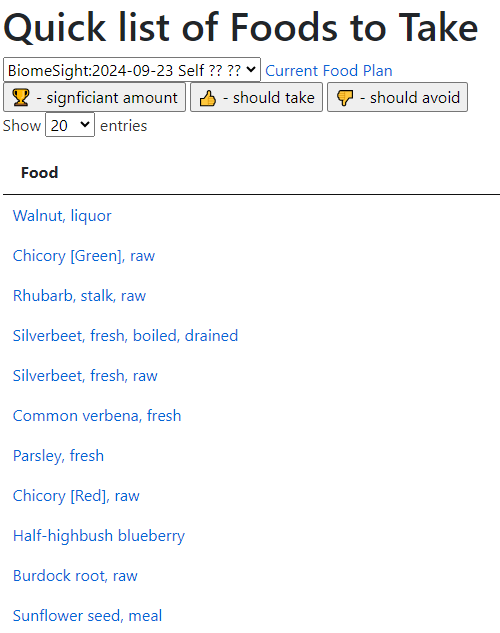
The “many histamine issues slash food intolerances” causes me to suggest looking at the foods suggested above, especially those that are not in a person’s typical diet. I.e. Walnuts, Acai, Burdock Root, Asparagus, Rye bread (100% – not wheat+rye mixture), Beets, papaya, etc.
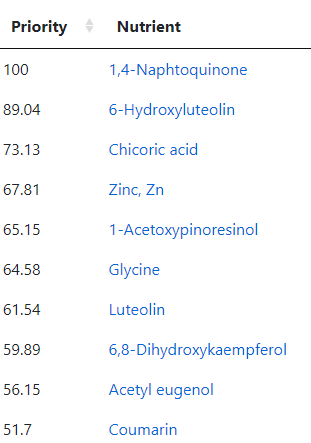
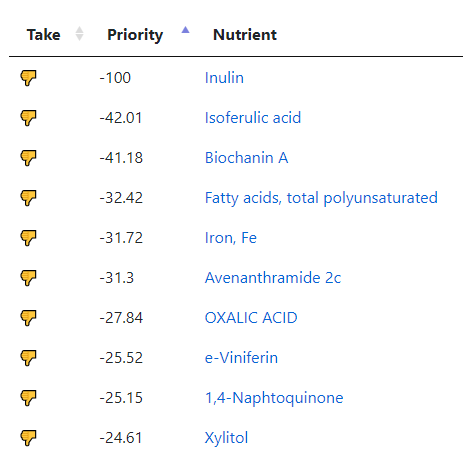
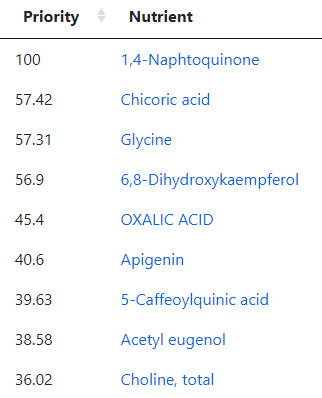
But wait! Those are based on studies of those explicit foods. When we go to the associated food sites, we see 116 nutrients identified as to take or avoid
The top to take are:
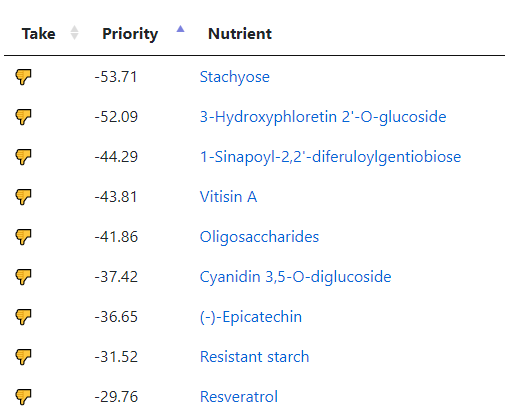
And to avoid:
With a quick list of food to take:
And to Avoid
My Approach if this was me
I would see about getting a bottle of only Bifidobacterium species probiotic as soon as possible to try to kick start things (i.e. a local health food store, or online with quick delivery). There is a risk that there may be no living or barely living bacteria in this bottle (background). So fingers crossed. At the same time I would order bottles of the following (which may take 3-4 weeks to arrive). Direct links to Maple Life Science’s Ebay site are linked below.
Those prices include shipping, so $44.00 total (which may be close to the price of the local purchase bottle). They ship worldwide! Why this source? My experience has been very good with them. Manufacture date is usually within a few weeks of shipping. Everyone that I have tried has had “kick”, that is, I see changes of stools (shape, size, frequency) and changes of fart smells within days of starting. I would start with just one, one capsule only and then work up to 5/day. Once the first bottle is empty, start the next bottle with the same pattern.
Next, I will try to incorporate as many of the above things — especially items that are not usually in your diet. With that, check the to avoid and reduce as much as is practical.
After 2-3 months, do another sample with the same firm — things are expected to change significantly and a new set of suggestions should occur.
Postscript – and Reminder
I am not a licensed medical professional and there are strict laws where I live about “appearing to practice medicine”. I am safe when it is “academic models” and I keep to the language of science, especially statistics. I am not safe when the explanations have possible overtones of advising a patient instead of presenting data to be evaluated by a medical professional before implementing.
I cannot tell people what they should take or not take. I can inform people items that have better odds of improving their microbiome as a results on numeric calculations. I am a trained experienced statistician with appropriate degrees and professional memberships. All suggestions should be reviewed by your medical professional before starting.
The answers above describe my logic and thinking and is not intended to give advice to this person or any one. Always review with your knowledgeable medical professional.


Recent Comments