When this site was started, there was one dominant player in retail-provider: uBiome. In June 2018, the first ThryveInside sample was uploaded, A year later, in May 2019, the first American Gut sample. A year later, in July 2020, BiomeSight started rolling in significant numbers — for 10 months, BiomeSight was the most frequent upload type every month. At present, I support 8 upload types and provide an API for any lab that wishes to do a direct transfer. BiomeSight lead the way here. Statistics are here for those interested.
In an early post, The taxonomy nightmare before Christmas…, The quote below says it all!
My #1 Measuring Stick
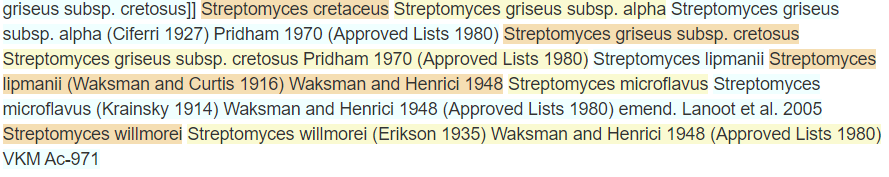
The first three labs, uBiome, Thryve and American Gut, all used the NCBI Bacteria Taxonomy systems. These are number and thus easy to store in the database and economic to do analysis on. This is a critical foundation. There are problems using names, because names change overtime. One bacteria has 237 different names. As illustrated below — same bacteria was discovered by many different people. Each person gave it a name and published papers using that name. In time (especially with DNA techniques) it was realized that they were all the same!!
NCBI is an unique identifier just like social security number is for American. Unfortunately, Canadians have SIN numbers. Other nations have Person Numbers. The same thing has happened with lab equipment. The problem is matching identities. With non-Americans in the US, some are issued TIN numbers (and thus we are good for US identity), others do not have TIN numbers. A person is like a bacteria.
Case Studies With Microba and BiomeSight
Microba does not use NCBI numbers. Microba uses the Genome Taxonomy Database (GTDB https://gtdb.ecogenomic.org/) for taxonomic classification. The question arises, who attempts the mapping of the GTDB identifiers to NSBI — Microba or MicrobiomePrescription or no-one?
With cooperation from them (namely, they provided a reasonably complete list of the GTDB identifiers that they used), I was able to create a mapping table between those names and NCBI numbers that was not 100%, but sufficient to give meaningful results.
With BiomeSight.com, they added the numbers to their database. I always prefer the lab to take ownership of the mapping – there can be many nuisances specific to the lab equipment that they are using.
Popular Medical Tests that cannot be added to the data
There are two main reasons that these cannot be added:
- They only measure selected bacteria (see below)
- Their unit of measure is different. One counts the number of hex nut in a mixture of 1000 nuts; the other counts the number of packages of hex nuts (with a different number of nuts per package) in a carton of nuts. They are simply too different.
| Lab Name | Bacteria Reported |
| Bioscreen (cfu/gm) | 17 |
| Biovis Microbiome Plus (cfu/g) | 40 |
| DayTwo | 76 |
| Diagnostic Solution GI-Map (cfu/gm) | 34 |
| GanzImmun Diagnostic A6 (cfu/gm) | 72 |
| GanzImmun Diagnostics AG Befundbericht | 25 |
| Genova Gi Effects (cfu/g) | 28 |
| Genova Parasitology (cfu/g) | 7 |
| InVitaLab (cfu/gm) | 23 |
| Kyber Kompakt (cfu/g) | 11 |
| Medivere: Darm Mikrobiom Stuhltest (16s limited) | 16 |
| Medivere: Darn Magen Diagnostik (16s Limited) | 16 |
| Medivere: Gesundsheitscheck Darm (16s Limited) | 17 |
| Metagenomics Stool (De Meirleir) (16s Limited) | 53 |
| Smart Gut (ubiome 16s – Limited Taxonomy) | 23 |
| Verisana (cfu/ml) aka (kbe/ml) | 11 |
| Viome (No objective measures) | 29 |
For these test, users must transcribe whether the test indicated too high(↑) or too low (↓) levels. I give the ability to indicate how much…
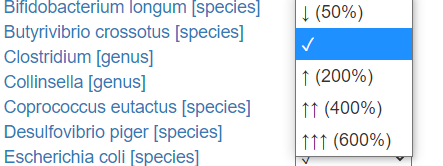
How the labs represents varies greatly. Their units are not compatible.
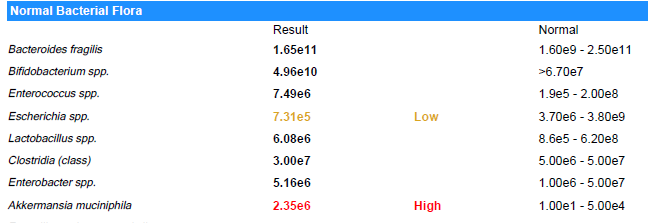
Suggestions are based on these rough values and uses the same logic. A key limitation is that their normal ranges are likely computed assuming a bell curve and not Kaltoft-Moltrup Ranges. You may be acting on items that are in the typical ranges seen.
Issue of Missing Hierarchical Layers
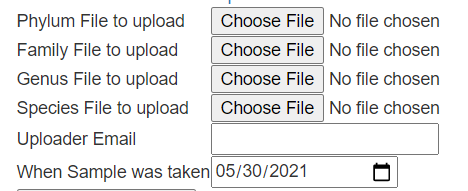
If you look at “My Biome View” on Microbiome Prescription, you will see the hierarchy (per NCBI). Most labs do not give the full hierarchy in their reports. Often they will skip layers. The clearest example is Microba. They provide information in only 4 files.
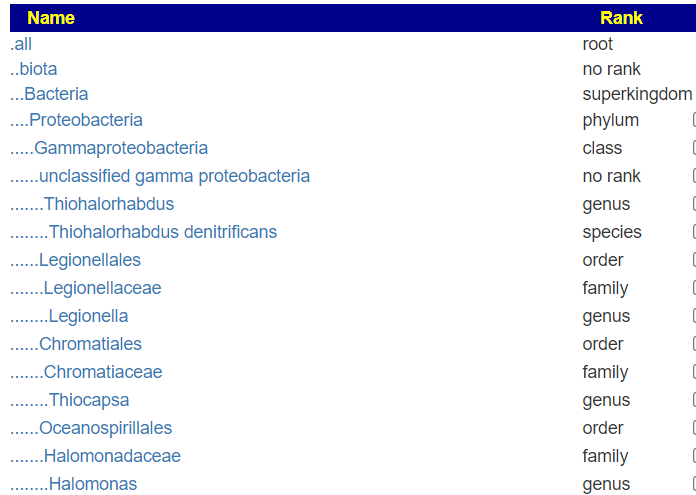
But when this upload is viewed, you see all of the levels!
A more extreme example is the CosmosID’s PDF files, where they only list the species and strains!
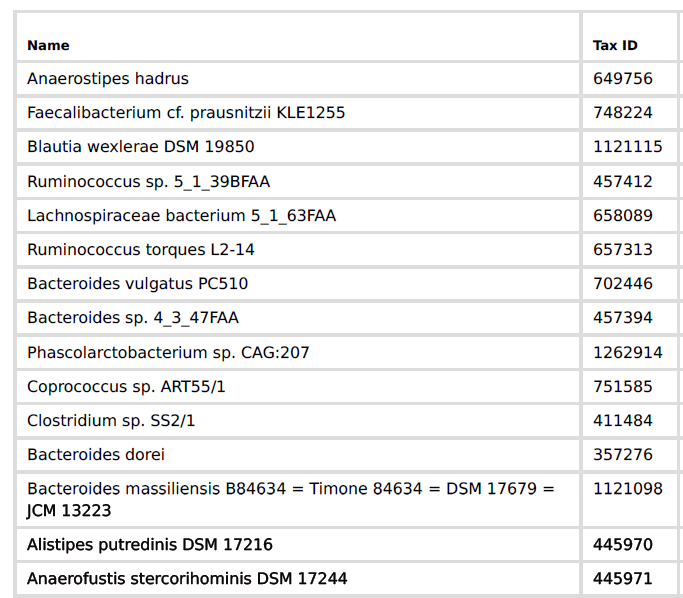
The user who submitted this would see the following My Biome View…
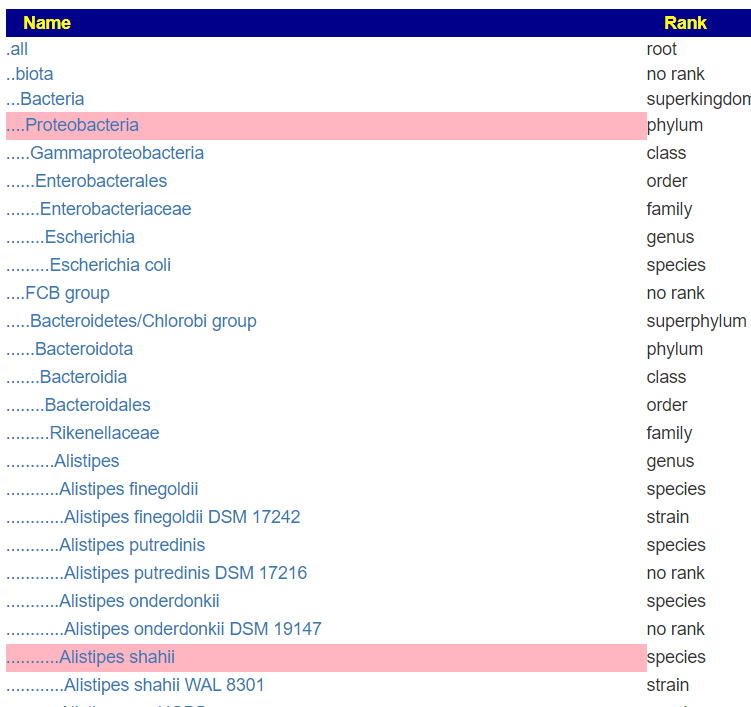
Microbiome Prescription “completes” the data by summing up each level into the level above if missing. So I sum the count of all of the species in a genus to get the genus count if it was missing from the upload. There is an unfortunate gotcha. you may have 8000 in a genus and the sum of the species is 6000. If the lab provided the genus count, then we are good — no need to create a record with 6000. If we must create this level, then we are missing 2000 and higher levels are underreporting!.
This issue is also seen in some lab results. They scale the numbers so that the species that they report adds up to the count for the genus. What they do not report on is dropped from all of the parent levels.
When you use the Krona Chart, if there are no “unknown section” the0n this ignoring the not identified is a possible issue with the lab results. You can also do this on the My Biome View by comparing the numbers of the parent to the sum of the children – if they always match, then assume that the not identified are ignored.
Inconsistent Numbers
Above we have the case of the genus count being more than the sum of it’s species. This is a good state, because the numbers are more accurate. We have the unidentified bacteria being identified as least at the genus level.
I have also found cases where the sum of the species exceeds the genus. This can legitimately happen when alternative hierarchies are used. It becomes a problem when we attempt to keep everything in one hierarchy (“There can only be one!”)

As a result, if the sum of the species (using NCBI hierarch) exceeds the genus, then we update the genus number for consistency (if we do not do that, then Krona charts can look bizarre — which a user emailed about).
Bottom Line
“Different strokes for different folks” is the problem. In accepting data from 9 different sources, I need to harmonize. The key that I play in is NCBI. This is a huge benefit because it is used with KEGG: Kyoto Encyclopedia of Genes and Genomes, which really enhances analysis.
Right Solution
It is simple, the labs should add to their websites equivalent pages seen on Microbiome Prescription — but only using their lab results. If their staff lacks the skills, I am a professional developer and can be contracted to do a lot of the backend coding (at my usual commercial rates ).
If you wish to be pro-active.
- Verify that every bacteria shown on my biome view is shown on the lab results page. If it is not, they are skipping elements of the hierarchy
- Verify that the count agrees, if not look at what is added up
- Contact the provider and ask for automatic transfer to be implements. Code wise it is very simple, a few hours of work at most for most developers. What is needed is documented here, including a test site!
I cannot fix the root issue — inconsistent data. You are their customers and by being vocal, you can make a difference. If the upload is correct and complete — I make no modifications, it is only for problematic uploads.
Recent Comments