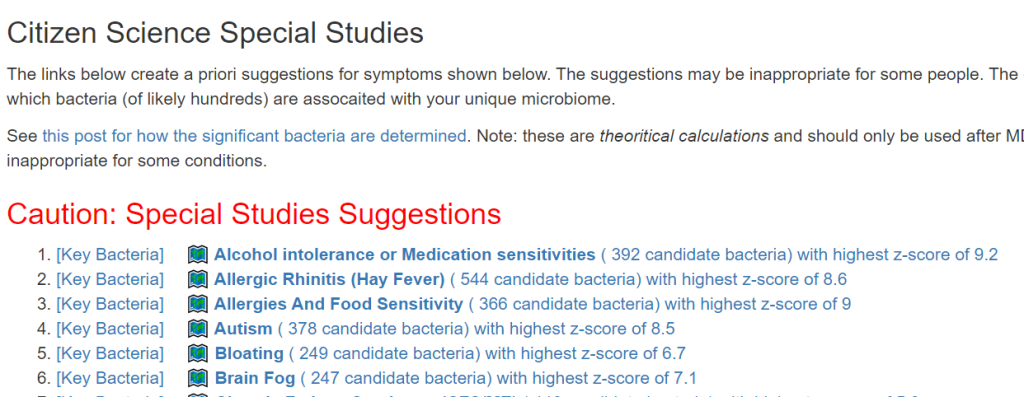
Revised Possible Medical Conditions Detected

A post on Facebook reminded me of an update from a recent data addition. We have added the prevalence of each condition. If you are at 75% ile for a condition that impacts only 5% of the population — there is low risk. But if the conditions impacts 50% of the population, you are at a significant risk.

Old display = items were picked on being outside of KM ranges.
The revised version … COVID-19 above suggests increased severity risk

Actions?

First, you should inform your medical professional that you are concerned about elevated risk for conditions that you do not have and inquire about any testing. Do not be surprised at some “rolling of the eyes” on how this risk was determined. Remember — many of the drugs prescribed for conditions do alter your microbiome in a favorable way (academic question: is this a possible mechanism of action?)

Second, for items of the greatest concern, you may wish filter by the bacteria associated with this condition to get suggestions that may shift your microbiome away from this profile.

Change Display Level to intermediate or higher to expose Advance Suggestions

Click on that link and then

Pick the condition that you are concerned about…

You may wish to play around with different filtering criteria

Microbiome Data is FUZZY not fixed

One reader keep coming back to me wanting definitive comprehensive answers. There is no such thing.

Let us walk thru all of the layers of randomness..

  • Your stool sample will vary according to time of day. The bacteria will change according to the last meal and the time since the last meal.
  • Where you sample your stool (outside, inside, front, back) will have different bacteria
  • The amount/quality of your sample will vary. uBiome did an informative: Count and then Count_norm
    • Count_norm is the count scaled to out of one million
    • Count is actual detected count… I have see that vary between 80,000 and 800,000
  • There is differences between the machines used (different primers etc) by the lab
  • The raw data file, FASTQ, (like a personal DNA sample) is interpreted by software.
    • If you have done your personal DNA, various sites will interpret what your ethnic inheritance is. The same applies to the software used to read the FASTQ file. See example below
    • Ombre and BiomeSight uses the same lab service but different software (in fact, Biomesight gives an option of a third software for interpretation.
  • Labs software disagrees about amount of each type of bacteria and even which ones are reported!
  • When we apply KEGG data, we have two randomness:
    • Does KEGG have data on the bacteria reported…. for some yes, at the strain level. We estimate genus level from strains… these are rough estimates and not necessarily accurate
    • Does the Lab report on those bacteria. In some cases yes, in other cases no.
  • Percentiles are based on the uploads. There is no question that there will be some bias in the samples, thus percentiles are reasonable but not accurate. When the number of samples with a specific bacteria is less than 200, then the percentiles reported may be easily off by 5-10%ile. This is due to the small sample size.
My DNA from Ancestry
My DNA from 23AndMe

Bottom Line

I understand that people want definitive, cast in bronze, answers. What is available is a fuzzy answer. IMHO, a fuzzy answer is far better than no answer or an answer by random reading of a posting on the web.

I describe the suggestions coming off Microbiome Prescription as being more lively to make the desired changes than trying random items or items suggested by web-self-reporting experience. It is like the stock market, AI can suggest stocks that are more likely to go up than down in purchase value. Buying gold or putting money under your mattress is also subject to changes in purchase value. Life is a random number generator, when you understand that, you can make better choices once you have done your homework.

Refactor “Changing Your Microbiome”

Often I am faced with requests to keep things simpler of the Microbiome Prescription site while getting requests to give more choices (often arising from people’s belief of what may work). I have just finished a revision attempting to balance these two (and set up infrastructure to give more choices in the future)

Old version menu of choices – with intermediate display
Revised version menu of choices – with intermediate display

The Expert Criteria takes you to a new page that has many criteria listed:

Expert Criteria Choices (more may be added as data becomes available)

There will be differences from each choice, because the bacteria selected will likely be different. For one sample:

  •  Use JasonH (15 Criteria) – 7 bacteria
  •  Use Medivere (54 Criteria) – 7 bacteria
  •  Use Metagenomics (59 Criteria) – 7 Bacteria
  •  Use Nirvana/CosmosId (36 Criteria) – 7 Bacteria
  •  Use XenoGene (22 Criteria) – 7 Bacteria
  •  Standard Lab Ranges (+/- 2 Std Dev) – 9 Bacteria
  •  Box Plot Whisker – 59 Bacteria
  •  Kaltoft-Moltrup Normal Ranges – 64 Bacteria
  •  Percentile in top or bottom %
    • 10% — 127 Bacteria
    • 5% — 55 Bacteria
    • 1% — 6 Bacteria

Why the differences? With only a few dozen bacteria with ranges, the chance of being picked is low. Box Plot and KM are computed for almost every bacteria. So with 700 bacteria, we have around 10% picked. With just 50 bacteria to be examined, we have around 14% picked.

These choices are also available in Advance Suggestions

What I do for gut health…

On facebook, I was asked:

Can you guys tell us beginners what do you guys do for gut health

If in unhealth…

My approach is simple, get a 16s (Biomesight or Ombre) microbiome test. Transfer or upload the data to https://microbiomeprescription.com/, get suggestions and do them for 4-8 weeks. Retest and repeat.

Here is an example of my applying this method (with 8 blog posts)

A key item is to rotate, rotate, rotate. Take the list of take suggestions and break into 4 groups. Do each for 2 weeks and then change to the next group. Attempt to remove ALL of the avoids (at least those with a value of 0.4 and higher). Simple enough? (Apart from the methodology to select the bacteria to alter — a new video on methodology is in progress)

If in health

Every 6-9 months, My approach is simple, get a 16s (Biomesight or Ombre) microbiome test. Transfer or upload the data to https://microbiomeprescription.com/, get suggestions. Look at rotating in (2 weeks on, 4 weeks off) any items over 0.8 on the take. Try to reduce any items on the avoid over 0.4.

If I am prescribe an ongoing medicine, then I will take a sample after 4 weeks and make modifications to counter any adverse effects. If the medication is in the existing database, I would check if there is an excessive shift (in terms of percentile) of the bacteria that it is known to shift.

For items like vaccinations and short term antibiotics, I will wait at least 8 weeks, preferred 12 weeks, to allow my immune system to settle down.

Bottom Line

That’s it. I do not do items exclusively from suggestions. I may take other items for diverse reasons — if they are not high in the avoid list, I just keep taking them.

Q&A

Q: Do you drink Kefir in general for gut health?

A: No, unpredictability of which bacteria are in it. I tend to keep to researched strains only. For yogurt: Activa is an example, or Yakurt probiotic drink. Custom Probiotics is a regular source.

Calculating Bacteria to Bacteria Associations

This is a note for software engineers out there.

I have moved on to rework the existing code. The processing is done on a dedicated server (32GB of memory, SSD drives for SQL Server. A little over 15,700,000 combinations of taxon needs to be made. Each combination needs to get all data on these taxons that are concurrent in any samples.

  • I.e. All samples that have Taxon 123 and Taxon 432 being reported.
The CPU Specification
Task Manager during the run
The Data Server Specifications

The computations are done using Parallel and Concurrent libraries. All indices have been tuned for this analysis. The SQL Server and the utility to calculate the associations are on the same server – so no latency or network impact.

I found that the CPU temperatures exceed the maximum recommended for the CPU chip.

Original Run load. The load was throttled to 85-90% to keep the temperatures lower. The log of the run is below. Elapsed time 50 hours with the computer running at 98%. This excludes time to calculate the monotonic transformation of the data (the association is neither linear nor Bayesian).
2022-03-27 20:12:08 Bacteria2Bacteria - 15,717,260 Items to Inspect
2022-03-29 22:48:34 Bacteria2Bacteria - 15,717,260 Items Inspected
2022-03-29 22:48:47 805,770 Items found

Bottom Line

This analysis likely qualifies for the “big data” label. So why is it worth it? The answer is simple, for some bacteria we have no information on what increases or decreases it. If we know which bacteria is associated with the bacteria growth or reduction, then we can synthesize modifiers of these bacteria that we lack information on.

This has not been implemented in suggestions (and will likely be available at the nerd level when it is).

Pending User Interface Changes

This year I have been focusing on a deep review of the code to improve accuracy and to address a variety of issues. The first item was redoing all of the KEGG Derived data (deriving compounds and enzymes at the species level instead of random strains). See KEGG Data being updated

The second item was cleaning up percentile computations on samples for:

  • Taxonomy
  • End Products
  • Compound Produced (KEGG)
  • Compound Consumed (KEGG)
  • Net Compound (Produced – Consumed) (KEGG)
  • Enzymes (KEGG)
  • Medical Conditions (US National Library of Medicine)

Combined with this was also implementing Display Levels across menu. See Display Levels.

Existing Menu Items

Original (overwhelming) menu

New Menu Items

Display Level: Public

Display Level: Beginner

Display Level: Intermediate

Display Level: Advance

Outliers Improved

In the earlier version, outliers and full data was on two separate pages. These has been combined into a single page with more options.

Are your abnormal?

Calculations are done for you to indicate the level where values may be out of range by random chance. This is illustrated below.

Display Level: Public — there are no options, top and bottom 5% is predefined
Example of clear evidence of microbiome issues. It looks like the production of Bacteriocins (natural antibiotics) is low, as well as low bile and butyrate production.
Display Level: Beginner – The Kaltoft-Moltrup ranges are an available filter
Display Level: Intermediate – Custom Percentiles ranges are an available filter
Display Level: Advance- All values is an available filter (this can also be done by setting Custom Percentile to 50%)

Bottom Line

I am hoping to have testing completed by the end of March and will then deploy

Comparing Probiotics using KEGG Data

While there is some research of probiotics (a little, tiny amount may be more accurate for most) with just 38 strains being researched and available for retail sale. While it is a known issue (with no enforcement) for the bacteria species in many probiotics being misidentified (see Deceptive Probiotic Labels or Assessment of commercial probiotic bacterial contents and label accuracy), for the page cited below, we will assume that they are accurate.

Fortunately due to the data on KEGG: Kyoto Encyclopedia of Genes and Genomes we know what products that most species produces, and can infer the quantity of these products/enzymes that are produced.

Emoji codes
  • 🍼 Probiotics
  • 🏭 Compound Produced – Factories
  • 🛍️ Compound Consumed (substrate) – Shopping basket
  • 🏗️ Enzymes- Constructs process
  • 🦠 Bacteria (general)
  • ⚖️ Compare items

Location of Pages

After login, change display Level (top left corner) to a higher level, you will see a new menu item appear with several new pages. This post focuses on the probiotic only.

Each page follows the same pattern. Compound listed on left, estimate of number of units produces by cell and alternative names. The Compound or Enzyme is link to the KEGG page providing more (usually very technical) information.

You can search by just typing the name in the search box. Some examples:

Does Probiotic-3 produce Hydrogen Sulfide?
Does Probiotic-3 generate histidine (which is then converted to histamine)
Does Probiotic-3 produce D-Lactic Acid (which is associated with brain fog)

Fast identification of Probiotics for specific purpose

This page shows the compound with links to lists of probiotics. On the far right is the ID from the Organic Acts Tests (OATS – where a match could be identified)

From MicrobiomePrescription : Probiotics to Change KEGG Compounds

An example of the linked to KEGG page is shown below. This page can be a good starting point for a long and steep learning curve.

Compare Probiotics Pages

These pages allows you to select two different probiotics and see what each produces.

Bottom Line

This provides information that bridges the gaps in published research. If you know what you are trying to increase or decrease, this should provide guidance for you to discuss with your medical professional.

Direct Links

Some Downloads Available in “Nerd” mode

Tonight I implemented some downloads of data as Comma-Delimited files which may typically just be double clicked and open in Excel. This information is intended for researchers who wish to develop and test their own models from the data available. If you have to ask what these are, you are a non-nerd. See KEGG for support, not me.

Note that the files download have “Trade Secrets” and (C) 2002 in the name indicating that further distribution of this data is not permitted without written consent. By accessing the data you consent to those restrictions and acknowledge the nature of the information received.

Example of file in Excel

What Probiotics Produced and Consumed (with amount)

As some of you are aware, I have spent the last few months refactoring how I handled data from KEGG: Kyoto Encyclopedia of Genes and Genomes. This weekend, I just finished pushing the data (over 8 millions rows of data) to the web site.

The computation is based on for each cell Sum(Sum(enzymes x compound produced by enzymes) over species), and the same number of cells of each species.

Nota Bene: There is a lot of rewiring from old tables to new tables that is in process. Some site pages may break.

From https://microbiomeprescription.com/library/ProbioticCompound
https://microbiomeprescription.com/library/ProbioticSubstrate
From https://microbiomeprescription.com/library/changeCompound?cpid=2&increase=1

Helminth and the Microbiome and Autism too

A reader asked for my opinion on this. This is one of those topics where emotions often run hot and reason can be forgotten. I usually avoid these topics — I hate flame wars.

All of these passion topics, tend to have the following critical factors:

  • If those that advocate also sell the product, there is a clear conflict of interest. I will usually assume that their primary motivation is profit that is clothed in the appearance of wanting to help.
  • If they do not sell, but often use it, then we have the nasty issue of rose color glasses, selected data picking of their patients. They may have a vested interest in wanting to be right or a pioneer. They usually ignore those that have adverse results (often those people do not return to the people treating — hence they do not see these adverse results or discount them to non-compliance to the treatment plan (blame the patient syndrome).
  • Last thing is desperation, especially when standard of medical care fails — people are willing to try anything, regardless of the risk and often very low success (which could have happen at random).

These risks applies to most items where feelings run high.

So, I go over to gold standards sources only (studies published on the US National Library of Medicine aka PubMed).

Helminth and the Microbiome

First item, is that there is risk: “Soil-transmitted helminth infections represent a large burden with over a quarter of the world’s population at risk. Low cure rates are observed with standard of care (albendazole)” [2022]. Hence, viable (living) helminthiases should be avoid. Killed ones (for their chemicals) would be preferred. If things go bad, you are looking at low cure rate!

This study suggests that it could be useful with some gastrointestinal dysbiosis — Helminth-Induced Human Gastrointestinal Dysbiosis: a Systematic Review and Meta-Analysis Reveals Insights into Altered Taxon Diversity and Microbial Gradient Collapse” [2021], that is two dysbiosis could result in less or more dysbiosis! Dysbiosis roulette anyone?

Helminth infection is included in my microbiome modifiers with 130+ bacteria impacted, see this page (I also include Round-Up! To include it in your suggestions, pick “Prescription – Other“. Remember NONE of the modifier suggestions should be done without medical review).

Please note also that if the treatment including killing them afterwards, that treatment alone may be responsible for positive effects

“There was evidence of treatment-specific effects among the selected studies, such as findings of treatment-associated taxa, including Sphingobacteriaceae and Flavobacteriaceae (26); increased and decreased Actinobacteria and Bacteroidetes, respectively, after placebo comparison (18); mebendazole treatment-induced changes in the diversity and abundance of Collinsella and Blautia (27);”

Helminth-Induced Human Gastrointestinal Dysbiosis: a Systematic Review and Meta-Analysis Reveals Insights into Altered Taxon Diversity and Microbial Gradient Collapse

Quick Review of an Advocate

The reader referred me to Lindsey Wells, a naturopath, page on Helminth Therapy. The Hygiene Hypothesis of Autoimmunity is cited which I have touched upon in the past 2015, 2018. To me, many advocates of this hypothesis both over simplify and commercialize it. If you wish to take this hypothesis seriously, then there is only one treatments: live on an organic farm, with a lot of different animals — if your boots are not covered in manure, every day — you are not taking the hypothesis seriously!

“The Amish and Hutterites are U.S. agricultural populations whose lifestyles are remarkably similar in many respects but whose farming practices, in particular, are distinct; the former follow traditional farming practices whereas the latter use industrialized farming practices….Despite the similar genetic ancestries and lifestyles of Amish and Hutterite children, the prevalence of asthma and allergic sensitization was 4 and 6 times as low in the Amish” – i.e. industrialized farming practices resulted in six times (600%) the rate of asthma and allergies. See Innate Immunity and Asthma Risk in Amish and Hutterite Farm Children(2016). This is also echoed in their farm products!!! Amish and Hutterite Environmental Farm Products Have Opposite Effects on Experimental Models of Asthma [2016]. Given a choice of buying groceries from a Hutterite farm or a Amish farm, buy the Amish (non industrialized) groceries!!!!

The bottom line of this page is simple — not a single clinical study was cited. The link to https://biomerestoration.com/hdc/ and where I would expect studies (under “The Science”), there was not one.

And the other site cited: https://helminthictherapywiki.org/wiki/index.php/Helminthic_therapy_research had links to a lot of self-published papers (i.e. not peer reviewed) and just 2 on PubMed.

  • Practices and outcomes of self-treatment with helminths based on physicians’ observations [2016]
    • As I stated at the start, this is among the worst form of study because it is prone to the placebo effect plus discontinuation of patients that are non-responders or who have adverse results. They do mention “1% of paediatric patients experienced severe gastrointestinal pains”. No objective measures (labs, etc) were cited. IMHO, a purely subjective report. Note that the journal that it was published in was Journal of Helminthology (I wonder if there is a bias with those doing peer review?)
  • Helminth–host immunological interactions: prevention and control of immune-mediated diseases [2012] Which is more of a position paper that was unable to cite any significant human studies, just case reports (which is prone to the same bias as cited above).
    • “Thus, it should come as no surprise that eradicating helminths can result in expression of diseases influenced by these pathways. There are now many animal models representing a diverse range of diseases for which helminths either prevent and/or reverse ongoing pathology. “

And now for Autism

  • Helminth therapy for autism under gut-brain axis- hypothesis. [2019] which is a theoretical proposal without any clinical results. It was published in the Med Hypotheses Journal.
    • “I hypothesized that a treatment with Trichuris suis soluble products represents a feasible holistic treatment for autism, and the key for the development of novel treatments. Preclinical studies are required to test this hypothesis.”

Bottom line: there are no clinical studies supporting it use for autism, it is all theoretical. Microbiome Prescription does include it in the options of gut modifiers — so you can objectively see if it is a good fit for an autistic child’s microbiome.

A Critical Criteria: If something has been proposed for 5+ years and fail to produce a positive clinical study then assume there have been several studies done with no positive results.

To me, it is not a rational choice — significant risk of known demonstrated adverse issues with no significant demonstrated positive impact. Odds are that going camping for 2 months in the woods will have a greater positive impact, or better still, work on an organic farm tending chickens, pigs and shoveling manure! Getting involved with 4H may be a good thing in many ways!