The typical pipeline processing finds the closest match of 16s or shotgun to a reference library. Conceptually this is fine, but when the closest match is not a bacteria found in humans (or very rarely), then the match may have zero value. It is speculative information for information sake.
Some examples from the taxon reported in retail microbiome reports:
Sharpea azabuensis: isolated from the faeces of thoroughbred horses in 2008
Clostridium chauvoei: causative agent of blackleg, a wide spread serious infection of cattle and sheep with high mortality
At the very least, the matching should be done to those reported in humans.
This creates a challenge for the clinician — there is no literature on these bacteria.
But to the capable statistician…
They can often be very useful for determining odds ratios for a specific condition or general good health. A suitably large dataset is needed (thousand of samples). This leaves the clinician between the rock (no literature or studies) and a hard place (“magical” statistical odds ratios).
Recently, I released Odds Ratio–based suggestions and reports, such as the example shown here.
The underlying concepts are straightforward:
If you are in an unhealthy range, the goal is to move out of that range.
If you are not in an unhealthy range but fall outside a defined healthy range, the goal is to move into the healthy range.
For healthy ranges, interpretation is simple—you are either too high or too low, so the direction of adjustment is clear.
If the range is 10%ile to 30 %ile and you are at 29%ile, should you increase or decrease?
If the range is 70%ile to 90 %ile and you are at 85%ile, should you increase or decrease?
Unhealthy ranges, however, are more nuanced.
For example:
If the unhealthy range is the 10th to 30th percentile and your value is at the 29th percentile, should you increase or decrease?
If the unhealthy range is the 70th to 90th percentile and your value is at the 85th percentile, should you increase or decrease?
The core issue is understanding why the range is considered unhealthy—specifically, whether the problem arises from having too little of something or too much.
Lactobacillus delbrueckii
Unhealthy: 0 – 45%ile
Healthy: 48%- 72%ile
Lactobacillus gasseri (A Surprise!): 0 -100%ile is Unhealthy
Lactobacillus johnsonii: 0 – 72%ile Healthy
Lactobacillus taiwanensis: 23-56%ile Unhealthy
Limosilactobacillus reuteri: 0-52%ile Unhealthy
The above numbers are slightly suspect because many are P > 0.002, so may not be significant.
Confidence
Bacteria this or less significant
Bacteria More Significant
P < 0.001
2081 Ranges
694 Ranges
P < 0.0001
2383 Ranges
392 Ranges
P < 0.00001
2495
280
A List of Families with high significance
It is interesting to note that neither Lactobacillaceae (Lactobacillus) nor Bifidobacteriaceae (Bifidobacterium) were found to be significant at this level. Nor were they at the genus level, only at the specific species level (see below)
tax_name
Range
Nature
Anaplasmataceae
0 to 75
Unhealthy
Bartonellaceae
0 to 79
Unhealthy
Chlorobiaceae
0 to 58
Unhealthy
Chrysiogenaceae
0 to 83
Unhealthy
Clostridiales Family XVI. Incertae Sedis
0 to 100
Unhealthy
Comamonadaceae
0 to 28
Unhealthy
Comamonadaceae
34 to 52
Unhealthy
Cyanobacteriaceae
21 to 99
Unhealthy
Deinococcaceae
0 to 46
Unhealthy
Desulfonatronaceae
0 to 50
Unhealthy
Enterococcaceae
0 to 66
Healthy
Enterococcaceae
68 to 71
Unhealthy
Euzebyaceae
13 to 100
Unhealthy
Hyphomicrobiaceae
0 to 87
Unhealthy
Kiloniellaceae
20 to 99
Unhealthy
Legionellaceae
0 to 100
Unhealthy
Listeriaceae
74 to 88
Unhealthy
Litorivicinaceae
0 to 18
Unhealthy
Lysobacteraceae
0 to 27
Unhealthy
Methylophilaceae
0 to 96
Unhealthy
Nostocaceae
14 to 88
Unhealthy
Oxalobacteraceae
0 to 30
Unhealthy
Pseudanabaenaceae
0 to 100
Unhealthy
Shewanellaceae
0 to 73
Unhealthy
Sporolactobacillaceae
0 to 100
Unhealthy
Streptosporangiaceae
53 to 88
Unhealthy
Symbiobacteriaceae
0 to 81
Unhealthy
Synechococcaceae
0 to 9
Unhealthy
Synechococcaceae
48 to 85
Unhealthy
Thermoanaerobacterales Family III. Incertae Sedis
3 to 50
Unhealthy
Thiotrichaceae
7 to 100
Unhealthy
Weeksellaceae
0 to 100
Unhealthy
Significant Bifidobacterium Species
tax_name
Range
Nature
Bifidobacterium adolescentis
0 to 49
Unhealthy
Bifidobacterium angulatum
0 to 73
Healthy
Bifidobacterium breve
0 to 76
Unhealthy
Bifidobacterium catenulatum
0 to 100
Healthy
Bifidobacterium dentium
0 to 50
Unhealthy
Bifidobacterium scardovii
0 to 79
Unhealthy
Significant Lactobacillus Species
tax_name
Range
Nature
Lacticaseibacillus brantae
33 to 70
Unhealthy
Lactobacillus acidophilus
0 to 76
Unhealthy
Lactobacillus amylovorus
0 to 100
Unhealthy
Ligilactobacillus murinus
0 to 100
Unhealthy
Summary
I am hoping to expand the size of my “Healthy Samples” in the next weeks. This should improve the ranges and significance.
For example, Odoribacter denticanis was only 0.002%, Clostridium akagii was 0.002%, and Symbiobacterium was 0.004%. The natural question is whether bacteria present at such tiny levels could have any meaningful impact. Interestingly, these values are not extreme outliers; they appear to be fairly common at these levels.
There are several ways to approach microbiome adjustment. One is to focus on bacteria that dominate the microbiome. Another is to target bacteria with extreme values. A third is to focus on bacteria whose mechanisms of impact are known, such as those that produce metabolites linked to leaky gut.
My own approach is based on strong statistical associations. Association does not prove causation, and in microbiome research, the causal details are often not well established. My working assumption is that bacteria strongly associated with a condition are likely influencing it, perhaps through metabolites they produce or consume. If so, reducing those bacteria should reduce the metabolic effect.
The low-abundance dilemma
The microbiome can be thought of as a population, much like a country’s human population. If there were 989 billionaires[Forbes] in the United States, that would still be only about 0.0003% of the population. Yet few people would conclude from that alone that billionaires have little influence on the country. In practice, a very small number of highly influential actors can still shape outcomes in major ways.
The same logic applies to microbiome analysis. Low abundance does not necessarily mean low impact.
The odds ratios used here are not based on an ideal dataset, but on the best data currently available. The choice is not between perfect evidence and flawed evidence; it is between using the best evidence now or waiting indefinitely for perfect data. In that sense, this is a best-effort approach grounded in the data we have rather than silence in the face of incomplete evidence.
Reader Response
I think the question is whether such low values represent an actual organism or noise. I remember in the days of Ubiome, a reading of 0.001% meant only a single organism was found. Ubiome actually discarded it if there was only one found. They only reported if there were two or more. Thryve otoh, reported everything, which is one of the reasons they found more than Ubiome.
ofc, some of these results are more than one organism, but the question still remains as to whether this is a real organism or noise. It just seems that there are a lot of variables in this analysis with big error margins, and you are compounding them by bundling them all together. The error margin in the final result is likely huge.
Resolution
The way to handle this issue was requiring the raw count to be at least 5. This should reduce the noise level to acceptable levels. The dilemma remains on identification differences between tests (See this post for details). With aggregation across different tests, this issue should be reduced.
In the decades that I have been working with the microbiome, the scientist in me have become very troubled. Some of the key concerns have been:
Massive inconsistency between tests results in terms of percentage of different bacteria found [more information]
Medical practitioner picking certain key bacteria to focus on based on rote or hearsay.
No studies showing any bacteria are more important than other possible bacteria.
Suggestions often do not consider counter-indication / adverse effects on other bacteria
Healthy ranges are determined using normal distributions (Normal Range) which is grossly invalid given the typical bacteria distributions [more information]
Microbiome Prescription current suggestion algorithms appears to have over a 75% chance of improving microbiome tests results (with typical subjective improvement reported) [more information]. For those not responding well to those suggestions, I have been researching an alternative, more rigorous, approach based on computationally intense computation. This method is not practical to run on a website, instead it is computed off-line and then emailed to the person.
The new suggestions are based on the following:
Using Percentile ranking for better comparison
Using Odds Ratios (a rigorous statistical process using P < 0.001) to select bacteria
Every suggestion is checked against every selected bacteria to insure no adverse effect
The new suggestions set consists of three reports:
Focus on the top 20 bacteria associated with being unhealthy
Focus on the top 20 bacteria associated with being healthy
Focus on the top 40 bacteria associated with both unhealthy and healthy
Selection is based on the statistical significance. Why three? As more and more bacteria are added to the target bacteria, the fewer modifiers are left that does not have adverse effect on some of the bacteria.
The goal is to shift the bacteria outside of the unhealthy range. Often it is to eliminate it, but in other cases it may be just to push it up and outside the range.
Nostocaceae [family] [1162] 47.5 %ile Unhealthy Range [14 – 88], Plan:Decrease Signif: 36.74, Odds:-4.34 Decreases This Bacteria
No Substances without adverse effect on other bacteria
Klebsiella [genus] [570] 46.1%ile Healthy Range [1 – 56], Plan:Increase Signif: 26.39, Odds:-3.40 Increases This Bacteria
4 :Sinapis alba {yellow mustard} @Food (excluding seasonings)
4 :Cathelicidin antimicrobial peptide {LL37} @Amino Acid and similar
3 :Bixa orellana {annatto } @Herb or Spice
3 :Rhus coriaria {Sumac} @Herb or Spice
2 :Withania somnifera {Ashwagandha} @Herb or Spice
Streptococcus alactolyticus [species] [29389] 99.0%ile Healthy Range [1 – 75], Plan:Decrease to Healthy Range Signif: 17.33, Odds:1.55 Decreases This Bacteria
5 :Olea europaea {Olive leaf} @Herb or Spice
5 :Micromeria fruticosa {White-leaved Savory} @Herb or Spice
When new suitable samples are uploaded, these reports are automatically generated and email within a day.
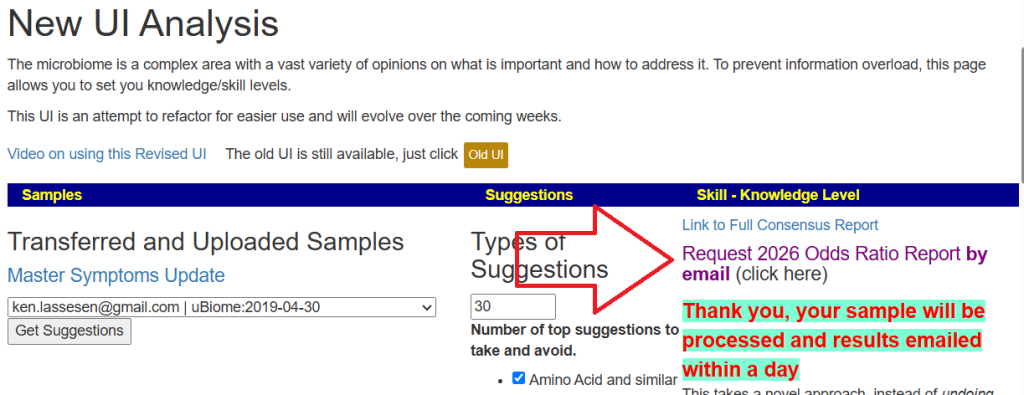
If you want an older sample processed, just click this link on the site
Note: If you do not receive it in 36 hours, check your spam and trash folders.
After some user feedback, a single report is sent. This report looks at bacteria in the unhealthy range and those that are outside of the healthy range. Most bacteria has one OR the other.
Recent Comments