Probiotic Selection: Differences between Studies and Modelled

A reader wrote asked about apparent inconsistencies in suggestions. That is a very valid request.

What’s the difference between ‘General suggestions’ on the odds ratio suggestions page and ‘Probiotic suggestions’? The results seem almost unrelated. Two examples: in my results, Bifidobacterium breve is in the ‘General suggestions’ listed as having a negative impact, yet in ‘Probiotic suggestions’ it has a highly positive impact, is even mentioned as the second best probiotic (see image down below)! The one there mentioned as the top probiotic, Enterococcus faecalis, is in my ‘General suggestions’ hardly a suggestion, having barely any positive impact (0.87, with many probiotics having more impact).

Clinical Studies Based versus Modelled Probiotics

When I saw an opportunity to model the impact of probiotics instead of relying on published studies, I jumped at the opportunity. The key reasons are below:

  • Clinical studies often given contradictory results on the impact of a probiotic on other bacteria.
    • There are many reasons that this would occur naturally:
      • The studies were in the context of an existing condition (thus altered microbiome to start with)
      • The studies used different reference libraries to determine bacteria (See Nightmare post)
      • The studies usually gives a simple increase or decrease.
    • Example: for Pseudomonas, we have 2 studies saying it is increased and 2 studies saying it is decreased by B. subtilis
  • Modelled uses:
    • Healthy individuals for modelling (thus no existing conditions!)
    • The same reference library for all samples
    • The model gives a numeric estimate of how much changes is expected (R2)

What is the practical implementation? Looking at the differences below (The full tables are bottom) we see that the model shows impact on a magnitude more of different bacteria.

  • In theory, over time, with enough studies on healthy individual with sufficient size of each study, there will likely be convergence of the numbers. Studies are time consuming to do — so these results are likely not likely to be fully available until the next millenium.
ProbioticModel: Different Bacteria impactedStudies: Different Bacteria impacted
Bacillus pumilus127218
Aspergillus oryzae109340
Lactobacillus kefiranofaciens106542
Enterococcus faecium100299
Lentilactobacillus kefiri84126
Bacillus licheniformis83577
Faecalibacterium prausnitzii67116
Debaryomyces hansenii6138
Blautia wexlerae5994
Lentilactobacillus buchneri53910
Lactobacillus jensenii49111
Bacteroides uniformis4815
Lactiplantibacillus argentoratensis4469
Akkermansia muciniphila47443
Heyndrickxia coagulans49972
Lactobacillus delbrueckii subsp. bulgaricus44934
Blautia hansenii3421
Parabacteroides goldsteinii3382
Parabacteroides distasonis3101
Lactococcus lactis33036
Lactobacillus acidophilus38189
Latilactobacillus sakei29634
Bifidobacterium animalis subsp. lactis26181
Pediococcus21446
Pediococcus pentosaceus21143
Shouchella clausii17315
Lactococcus lactis subsp. lactis bv. diacetylactis1588
Lactobacillus helveticus20161
Escherichia coli18042
Lactobacillus johnsonii17943
Levilactobacillus brevis15723
Streptococcus thermophilus17869
Ligilactobacillus salivarius17162
Lacticaseibacillus casei202112
Limosilactobacillus reuteri198116
Bifidobacterium adolescentis10338
Lactiplantibacillus pentosus9126

The Personal Decision to be made

Microbiome Prescription generates suggestions using both methods. There is no mechanism to determine which is better. Personally, I prefer the model because there is a lot more data available and the data is quantitative and not a binary of (increase/decrease).

The model assumes this logic:

  • If you take a (living) probiotic, then the amount in your microbiome will increase and all of the cascading impacts of this increase will likely match the impact of healthy individuals who naturally have more of that bacteria.

Why Contradictions?

There are massive interactions occurring. If you ignore (or have no data) on some impacts, then you can easily go very off course.

Consider Lactobacillus brevis: Assuming that 10% of your bacteria are out of wack, the recommendation with studies would be based on just 2 bacteria (10% of 23). Recommendations from the model would use around 16 bacteria (10% of 157). In short, more factors would be considered.

Appendix: Full Tables

ProbioticsDifferent Bacteria Impacted according to studies
Lactiplantibacillus plantarum198
Saccharomyces boulardii (nom. inval.)170
Lacticaseibacillus rhamnosus136
Bacillus subtilis group128
Limosilactobacillus reuteri116
Lacticaseibacillus paracasei116
Lacticaseibacillus casei112
Bifidobacterium longum106
Bifidobacterium animalis101
Enterococcus faecium99
Limosilactobacillus fermentum96
Lactobacillus acidophilus89
Bifidobacterium bifidum86
Bifidobacterium animalis subsp. lactis81
Bacillus licheniformis77
Clostridium butyricum74
Heyndrickxia coagulans72
Streptococcus thermophilus69
Bacillus amyloliquefaciens group63
Ligilactobacillus salivarius62
Lactobacillus helveticus61
Lactobacillus gasseri52
Lacticaseibacillus rhamnosus48
Brevibacillus laterosporus48
Pediococcus46
Pediococcus pentosaceus43
Akkermansia muciniphila43
Lactobacillus johnsonii43
Lactobacillus kefiranofaciens42
Escherichia coli42
Aspergillus oryzae40
Bifidobacterium adolescentis38
Lactococcus lactis36
Latilactobacillus sakei34
Lactobacillus delbrueckii subsp. bulgaricus34
Bifidobacterium breve33
Limosilactobacillus mucosae31
Lacticaseibacillus casei30
Streptococcus thermophilus28
Lactiplantibacillus pentosus26
Lentilactobacillus kefiri26
Bifidobacterium longum26
Bifidobacterium longum subsp. infantis24
Levilactobacillus brevis23
Enterococcus faecium23
Bacillus subtilis group20
Bacillus pumilus18
Bifidobacterium pseudocatenulatum17
Faecalibacterium prausnitzii16
Shouchella clausii15
Bacillus amyloliquefaciens14
Enterococcus durans12
Lactobacillus jensenii11
Lentilactobacillus buchneri10
Bifidobacterium catenulatum10
Escherichia coli10
Lactiplantibacillus argentoratensis9
Lactococcus lactis subsp. lactis bv. diacetylactis8
Debaryomyces hansenii8
Bacteroides uniformis5
Escherichia coli5
Blautia wexlerae4
Streptomyces albogriseolus3
Parabacteroides goldsteinii2
Parabacteroides distasonis1
Blautia hansenii1

Compared to the modelled data

Modelled ProbioticDifferent Bacteria Impacted according to model
Bacillus pumilus1272
Aspergillus oryzae1093
Lactobacillus kefiranofaciens1065
Enterococcus faecium1002
Lentilactobacillus kefiri841
Bacillus licheniformis835
Faecalibacterium prausnitzii671
Debaryomyces hansenii613
Blautia wexlerae599
Lentilactobacillus buchneri539
Heyndrickxia coagulans499
Lactobacillus jensenii491
Bacteroides uniformis481
Akkermansia muciniphila474
Lactobacillus delbrueckii subsp. bulgaricus449
Lactiplantibacillus argentoratensis446
Lactobacillus acidophilus381
Blautia hansenii342
Parabacteroides goldsteinii338
Bacillus331
Lactococcus lactis330
Parabacteroides distasonis310
Latilactobacillus sakei296
Bifidobacterium animalis subsp. lactis261
Pediococcus214
Pediococcus pentosaceus211
Lacticaseibacillus casei202
Lactobacillus helveticus201
Limosilactobacillus reuteri198
Escherichia coli180
Lactobacillus johnsonii179
Streptococcus thermophilus178
Shouchella clausii173
Ligilactobacillus salivarius171
Lactococcus lactis subsp. lactis bv. diacetylactis158
Levilactobacillus brevis157
Bifidobacterium animalis116
Bifidobacterium longum116
Bifidobacterium adolescentis103
Bifidobacterium breve96
Limosilactobacillus mucosae92
Lactiplantibacillus pentosus91
Bifidobacterium89
Limosilactobacillus fermentum88
Bifidobacterium longum subsp. infantis74
Enterococcus durans61
Bifidobacterium catenulatum52
Lactiplantibacillus plantarum45
Lactobacillus gasseri35
Bifidobacterium bifidum29
Bifidobacterium pseudocatenulatum28
Lacticaseibacillus rhamnosus28
Clostridium butyricum18
Lacticaseibacillus paracasei7

“Black death is transmitted by Contact with Rats Only” – Excuse me!

Back in my Uni days, one of my favorite profs taught probability and was a specialist in models of disease spread. A few of her papers below

  • Epidemic highs and lows: a stochastic diffusion model for active cases. Journal of Biological Dynamics
  • The effect of patterns of infectiousness on epidemic size. Mathematical Biosciences and Engineering 5 (2008), 429-435.
  • Bimodal epidemic sizedistributions for near-critical SIR with vaccination. Bulletin of Mathematical Biology 70(2008), 589-602.
  • Stochastic epidemic modeling. In: Mathematical and Statistical Estimation Approaches in Epidemiology, Ed. G. Chowell, Springer (2009), 31-52.

Often her work includes the use of Markovian chains. This mathematical framework was a foundation for the work on Microbiome Prescription dealing with bacteria.

Contemporary Pandemics

There are three potential pandemics in scope as summarized in the table below

DiseaseTotal CasesDeath RatePrimary TransmissionIncubation PeriodPresymptomatic Transmission
SARS8,4229.6-11%Respiratory droplets, aerosols, fomites2-10 days (median 4-6)Minimal
COVID-19779+ millionVariable (~1-2% overall)Respiratory droplets, aerosols, surfaces4.9-7.5 days40-80% of transmission occurs 2-4 days before symptoms
Andes HantavirusHundreds (regional)36-38%Rodent excreta inhalation; person-to-person (unique among hantaviruses)7-39 days (median 18)Yes, during early prodromal phase

SARS (2002-2003)

The SARS outbreak resulted in 8,422 cases worldwide with 916 deaths, yielding a case fatality rate of approximately 9.6-11%. The virus transmits primarily through respiratory droplets, aerosols, and contact with contaminated surfaces (fomites). The incubation period ranges from 2-10 days (median 4-6 days), with most estimates around 5.3 days. SARS transmission occurs primarily after symptom onset, particularly fever, with minimal evidence of presymptomatic transmission.

COVID-19 (2019-Present)

COVID-19 has caused over 779 million confirmed cases and 7.1 million deaths globally as of 2026, with a variable case fatality rate depending on healthcare access and population demographics. The virus spreads through respiratory droplets, aerosols, and surface contact. The mean incubation period is approximately 4.9-7.5 days, depending on the variant and population studied. Critically, 40-80% of COVID-19 transmission occurs 2-4 days before symptom onset, with presymptomatic individuals consistently accounting for over 50-52% of daily new infections.

Andes Hantavirus

Andes virus causes Hantavirus Cardiopulmonary Syndrome (HCPS) with a case fatality rate of 36-38%. While most hantaviruses transmit only through inhalation of aerosolized rodent excreta, Andes virus is unique among hantaviruses in its capacity for person-to-person transmission, which occurs during the early prodromal phase. The incubation period ranges from 7-39 days (median 18 days), with most cases showing symptoms within 14-32 days after brief exposure. A recent cruise ship outbreak in May 2026 reported 8 cases with 3 deaths. Person-to-person transmission has been documented in household clusters and confirmed through genetic sequencing in Argentina and Chile.

Public Health Official Misinformation

Over the last week, I have seen a constant ignorance (failing to read the literature) as well as “calm the masses” speeches. “All Hanta virus are the same”. I did see one news program that did an interview with an informed Harvard professor.

Causes for Anxiety

As you see above, N95 masks are being used for protection for Hanta virus. Properly fitted N95 respirators have a filtration efficiency of 95-99% for viral particles, translating to a failure rate of 1-5% under optimal conditions. To translate it, with 1 person on a flight with 100 souls, up to 5 new infection could be expected. If every one was wearing N-95 properly , then the odds of another new infection become 1 in 400.
Personally, I use P100 masks. The failure rate of P100 respirators is approximately 0.03% for viral particles, compared to N95’s 1-5% failure rate. T

Protection Against Viral Infections

N95 masks reduce the risk of coronavirus infections (SARS-CoV-1 and SARS-CoV-2) by 70% compared to surgical masks (OR 0.30, 95% CI 0.20-0.44). When worn by infected individuals, duckbill N95 masks block 98-99% of COVID-19 viral particles from escaping into the air, reducing transmission risk by up to ninefold when used population-wide and threefold with individual use. [source]

Failure Rates and Limitations

While N95 respirators are highly effective, some penetration occurs at the most challenging particle size (~50 nm). Studies found that penetration rates can slightly exceed 5% at this size, though this may include viral fragments rather than viable infectious particles. The primary failure mode is improper fit rather than filter inadequacy—N95 masks with suboptimal fit still maintain >90% filtration efficiency, but leakage around the edges significantly reduces overall protection. [source]

What will the future reveal?

Detection issue:

For Andes virus specifically, RT-qPCR can detect viral RNA in peripheral blood cells 5-15 days before symptom onset and before antibodies appear. The test demonstrates 94.9% sensitivity and 100% specificity with a very low detection limit of approximately 10 viral copies [source]

So with 42 days before symptoms, a person with Hanta virus will test negative for 27 days (while being contagious), This is very different from the other two virus. The significance of this depends on other factors in the Markov matrix. The prior Chile and Argentina outbreaks was for a localized area (effectively local isolation). The current outbreaks have possible cases flying across the world.

Timeline of the 2026 Andes Hantavirus Cruise Ship Outbreak

Pre-Outbreak Period

November 27, 2025 – April 1, 2026: The index case (Case 1), a Dutch adult male passenger, traveled for four months on a road trip through Chile, Uruguay, and Argentina, where he likely contracted the virus.

April 2026

April 1: MV Hondius, a Dutch-flagged cruise ship, departed from Ushuaia, Argentina with 147 passengers and crew from 23 countries.ecdc.europa+1

April 6: Case 1 developed symptoms.who

April 11: Case 1 died onboard the ship; he is considered a probable case (no microbiological tests were performed).

April 24: The ship stopped at Saint Helena, where Case 1’s body was removed and his wife disembarked; 30 passengers total disembarked at this port.wikipedia

April 26: Case 1’s wife died in a Johannesburg, South Africa hospital.wikipedia

May 2026

May 2: The cluster of severe respiratory illness was officially reported to the World Health Organization (WHO) and CDC; at this time, 34 passengers and crew had disembarked from the ship.cdc+2

May 4: WHO confirmed the outbreak publicly and reported seven infections with three fatalities.pbs

May 6: WHO confirmed the specific hantavirus strain as Andes virus (ANDV) through PCR and sequencing; one additional case was identified.cdc+1

May 7: CDC sent a team to meet the cruise ship in the Canary Islands following its travel from Cape Verde; three ill passengers were evacuated.cdc+1

May 8: WHO reported eight total cases (six confirmed, two probable) including three deaths, for a 38% case fatality ratio; all confirmed cases tested positive for Andes virus.

May 9: CDC issued a Level 3 emergency response and classified the situation as a current outbreak; CDC began coordinating repatriation of American passengers to a specialized medical facility in Nebraska.

May 10: MV Hondius arrived at the port of Granadilla, Tenerife, Canary Islands; disembarkation and repatriation flights began.ecdc.europa

May 11 (as of 14:00): European Centre for Disease Prevention and Control (ECDC) reported nine total cases (seven confirmed, two probable).ecdc.europa

  • May 15th End of Isolation for persons who meet Patient 1 and did not sail on MV Hondius
  • June 25th: End of Isolation for persons who sailed on MV Hondius
  • June 25th: End of Isolation for persons who transferred people from MV Hondius (if N95 failure is considered)

Current Status

As of May 11, 2026, passengers are hospitalized across multiple countries including South Africa, the Netherlands, Germany, Saint Helena, Spain, France, and Switzerland. International contact tracing is ongoing through IHR National Focal Points for all passengers and crew who had contact with confirmed cases. The outbreak has drawn global attention as one of the largest and most high-profile hantavirus clusters in recent history, particularly concerning due to confirmed person-to-person transmission of Andes virus.

Worse Case Scenario

An airline staff flying patients home gets infected from N95 mask failure. This person proceed to fly for the next 5 weeks before becoming sick. This is estimated to having 1,680-2,880 unique passenger contacts. This person is likely to also infect all of their fellow workers, yielding over 10,000 exposures.

Fortunately, the airplane’s air filters do better than N95 so the actual numbers would be significantly less,

  • Aircraft HEPA / P100 / N100: ~99.97–99.99% removal.
  • N95: ≥95% removal (often higher in practice, but certified at 95%).

The Saving Factor

R₀ (basic reproduction number): Average number of people one infected person will infect in a fully susceptible population.

basic reproduction numberCurrent Estimates from Literature
SARS2-4
COVID2-3
HANTA < 1.0

If a mutation happens to increase R₀ then we are heading to a new lock down.. We have 8 cases from 1 individual (in a unique environment) which gives a possibility of R₀ being over 1.

A Speculation on Mast Cell Activation Syndrome from observing an experience

Back Story

Early this year I took one week of antibiotics to deal with possible developing cellulitis. About a year prior, I took the antibiotic for a prior incidence of cellulitis. I have been taking just one regular prescription drug (L) for the last few years.

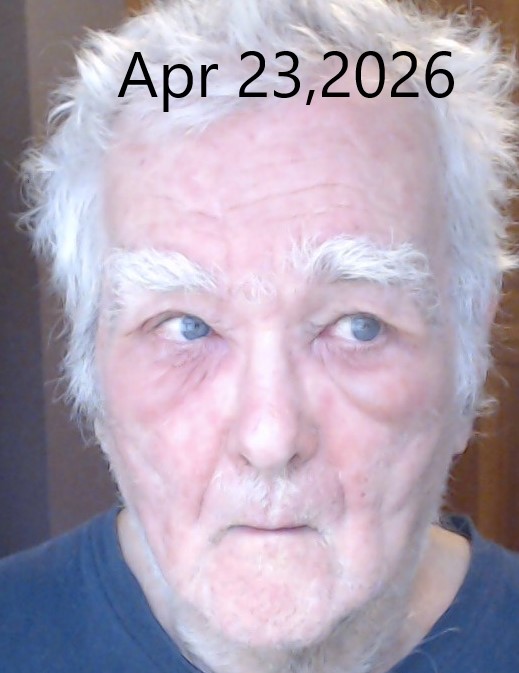
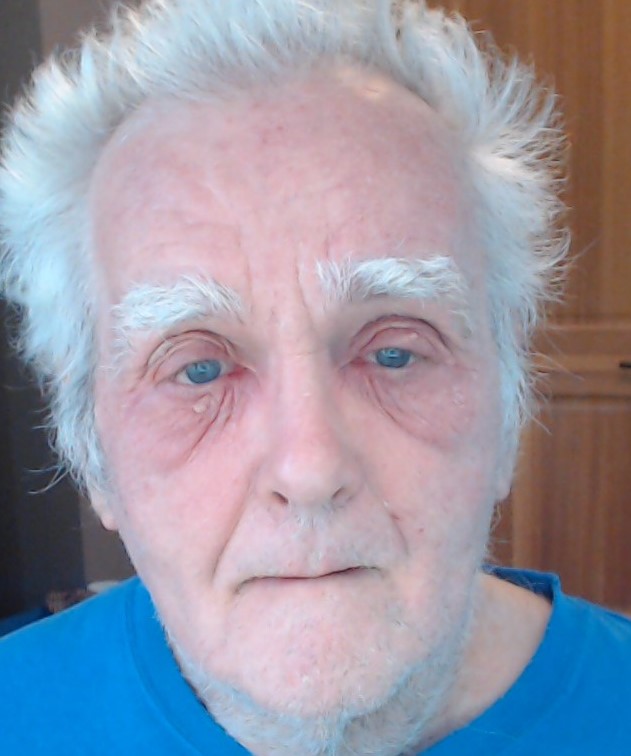
About two weeks after finishing the antibiotics, I developed itching in the legs which I expected to just fade away. Suddenly I had eye edema as shown, rashes, etc. A lot of other symptoms that my wife (with verified by tests) Mast Cell Activation Syndrome.

At peakCalming down

Our medical professional prescribed high dosage of multiple anti-histamines. After two weeks there was little progress. After a lot of prompting of an AI, it suggested “L” may be a contributor. I always took this at bed time, and symptoms became much worse at night. I stopped taking it, the result was significant improvement every day since. My wife has told me that I am looking more normal every day, but I still have some distance to go.

A hint of one possible cause?

Although many many symptoms matched my wife’s MCAS symptom, it appears that histamines were not the issue.

“L”  breaks down bradykinin, so lisinopril can increase bradykinin levels; this helps vasodilation but is also linked to cough and angioedema risk.

“Bradykinin and mast cell activation can overlap because mast cells may help trigger the kallikrein-kinin system, which can increase bradykinin production. Bradykinin can also increase vascular leak and swelling, so some symptoms can look similar to MCAS flares.” Mast cell degranulation and bradykinin-induced angioedema – searching for the missing link, 2024

 Bradykinin can be measured but not usually as a routine clinical test. In practice, doctors usually test for the cause of bradykinin-related swelling rather than measuring bradykinin itself, because bradykinin is very unstable and hard to measure directly in blood. The most direct method is a specialized blood test using LC-MS/MS or a similar lab technique that measures bradykinin and its breakdown products. Some research methods use special sample handling, like drawing blood into chilled tubes and processing it very quickly, because bradykinin can change fast after the blood is drawn, Bradykinin measurement by liquid chromatography tandem mass spectrometry in subjects with hereditary angioedema enhanced by cold activation ,2025

Excessive bradykinin can be treated. In my case, the treatment was easy, stopping L.

Also note: that all of the papers being cited are 2024 and later.

Microbiome Role?

Just before these events I did a microbiome test. In two more weeks I am planning to do a second test. I will attempt to identify possible changes and how such changes could have cause these change.

Stay tune!

Random Notes:

  • “L” half life is report to be around 50 hrs. using 5 half lives to fully clear “L”, that is 250 hours or 10 days. I am assuming even a small amount of this “toxin” is sufficient for triggering