I’m a nutritionist studying clinical nutrition. An ordinary nutritionist who has done certificate 4 in nutrition is not qualified on that level to assist people heal and build gut health. Once you start studying on the clinical level you get a very different training which now includes gut health thank goodness. I can tell you what foods to eat to build up your gut health see what to avoid but at the moment I’m not qualified to interpret test results. In fact I couldn’t really tell you who would be because doctors don’t study nutrition or food achieve or nutrition in a clinical level. Many dieticians who have been practicing for any length of time are quite behind in food science and gut health research because our knowledge is literally still being discovered. If you go the natural medicine route, they don’t do food science. Is it a case Ken of it’s anyone’s guess at the moment? The wellness industry is about profit through selling products not health.
The Hallucination Model
A clinician receives a microbiome report and see that 5 bacteria are outside of reference ranges according to the report. The clinician then searches the biomedical literature for an intervention on the US National Institute of Health that appears to move each of those taxa toward the report’s reference range and prescribes that intervention. This is prescribed to the patient. Mission accompanished.
Of course, any experienced clinician will know that he will not find such a study. A well-read clinician may be ROFL (Rolling on the Floor Laughing) with this approach for a variety of reasons:
Reference ranges are typically done using means and standard deviation. This imposes an assumption of a normal distribution on the data. Microbiome data often exhibits a skew of 20-30; a skew over 2 excludes the use of a normal distribution. The term “normal” is often misunderstood; applying a casual conversation meaning instead of the statistical meaning. Laboratory reference intervals should not be confused with clinically meaningful targets. A reference interval is generally a statistical description of a selected comparison population, not evidence that a value outside that interval causes disease or that moving the value inward improves patient outcomes.
It is extremely unusual for a clinical microbiome test to be the same as that used in any study. The National Institute of Standards and Technology has for over 10 years identified a severe lack of standardization as undermining microbiome research. Their lead has accurately stated in 2019: “There are currently 97 different ways to analyze the same raw data, and they will give you 97 different answers“. You cannot safely assume that the study results apply to the patient test.
Finding all of the targeted bacteria in the same study is extremely unlikely. A common response is to find a study in isolation for each bacteria and then synthesize a combination of substances. This assumes complete independence of each substance and its bacteria influence. This is typically false with many substances helpful for one bacteria and contraindicated for another. To be safe, the clinician will need to read every published study for each substance; a time requirement impractical in a clinical setting.
The impact of a substance on a bacteria may be inconsistent. Baseline microbiome composition and function, diet, lifestyle, antibiotic exposure, age, comorbid disease, and concomitant medications can all influence both microbial response and clinical effect. The direction of change observed in one population may not generalize to another, and a change in microbial abundance is not necessarily accompanied by an improvement in symptoms or disease outcomes.
A frustrated clinician (or patient) may simply asked some Large Language Model for an answer. The response would often be called hearsay in a court of law.
Ask the “expert” to read the above and explain how they work given this background paper. Expressions like “from experience” or “trust me” indicates a high risk of the person going to harm you instead of help you.
Several years ago, I evaluated a broad range of statistical approaches for microbiome analysis, including machine-learning(ML) methods. I used publicly contributed samples available through the Microbiome Prescription citizen-science platform; the underlying dataset is available for download from its associated citizen-science repository.
At that time, I found that alternative statistical models generally outperformed the machine-learning approaches I tested. More recently, however, several direct-to-consumer microbiome testing companies have begun citing machine learning in their marketing materials. Time to revisit ML.
Says its tests use metatranscriptomics and ML models in its scoring engine; it states those models turn microbial and biochemical patterns into Viome Scores and dietary/supplement recommendations.
ZOE
Says it was founded to combine microbiome sequencing with ML, and that its PREDICT research data trained models underlying ZOE scores. Its retail gut test uses shotgun metagenomics, though its ML claims also cover its broader personalized-nutrition predictions rather than only the stool-test report.
BIOHM Health
Markets the Longevity Gut Score as using “advanced AI,” and trade reporting attributes its aging-related model to machine- and deep-learning methods trained on more than 10 million data points,
FeelGut
Claims its sequencing reads are processed through a “machine learning bioinformatics pipeline,” compared with reference libraries and its own data set to produce health scores and food suggestions
EZBiome
Says it applied ML and AI to a database of more than 120,000 people to generate a global microbiome health index.
Tiny Health
Tiny Health says it uses machine learning with an individual’s sequencing results and survey data to personalize its diet, supplement, and lifestyle recommendations.
Perplexity also informs me that none have “not publish enough to reproduce its proprietary scoring and recommendations.” Thus the question must be asked, is this marketing hype or validated peer-reviewed science.
Looking at some of the literature
Microbiome ML results can look better than they generalize because the data are sparse, compositional, high-dimensional, and highly affected by batch effects. Differences in DNA extraction, sequencing platform, 16S variable region, taxonomic database, geography, diet, medication exposure, and disease-site recruitment can all be learned by a model instead of the biological signal of interest.
Microbiome data is often high-dimensional, with more features (microbial genes or taxa) than samples. This can lead to overfitting and poor generalization, especially with small sample sizes. Feature filtering and selection methods are employed to reduce dimensionality, but different methods can yield different results, and correlated features can hinder selection.
The different results from using different methods is a major red flag🚩 for me.
The substantial variability in results produced by different analytical methods is a significant concern. In colloquial terms, there is a risk that artificial-intelligence systems may generate plausible but poorly supported inferences, while analysts may—intentionally or unintentionally—select modeling choices that align with organizational expectations. Highly favorable results can sometimes be obtained through extensive tuning, but the central methodological question remains: do the findings reflect genuine signal in the data, or artifacts introduced through model selection and optimization?
To examine this issue, I conducted a preliminary evaluation of relatively naïve machine-learning models across several collections of microbiome samples, including samples originating from BiomeSight, uBiome, and Ombre. Here, “naïve” refers to simple, out-of-the-box implementations using Microsoft.ML.Data and publicly downloadable data, without extensive feature engineering, hyperparameter optimization, or other model-tuning procedures.
The Core Code in C#
var classifier = new VariableLengthBinaryClassifier();
var data = DataDal.ML_Symptoms(source, sympid);//Array of {condition, double[] }
IReadOnlyList reports =
classifier.Train(data);
var result = classifier.Predict(data[0].Values);
var line = $"{source},{name},Accuracy={reports[0].Accuracy}; ";
I evaluated two representations of taxonomic abundance:
Relative abundance expressed as percentages.
Quintile-based categories:
Not detected
Detected through the 25th percentile
25th–50th percentile
50th–75th percentile
Above the 75th percentile
My preregistered practical criterion was straightforward: model accuracy should exceed 0.50. Because a binary classifier can achieve approximately 0.50 accuracy through random prediction under balanced classes, results below this threshold would provide little evidence of useful predictive performance. Across several hundred tested scenarios, the full quintile taxonomic model has associations between 0.429 and 0.447 over 1919 dimensions . Detailed results are provided in the appendix.
Interpretation of the findings
These results require careful qualification. More favorable predictive performance may be achievable when analyses are tightly controlled for population characteristics, sequencing methodology, bioinformatic processing, and other sources of technical and biological variation. However, models developed under such restrictive conditions may generalize only to highly similar populations and to data processed through the same microbiome-analysis pipeline. This limitation is particularly important given the substantial effects that laboratory methods, reference databases, taxonomic classification procedures, and other pipeline choices can have on microbiome results.
The samples used in this evaluation were comparatively heterogeneous: they were uploaded by individuals from diverse locations and backgrounds, although samples within a given retail-laboratory source were processed using the same general pipeline. For potential clinical application, such “real-world” heterogeneity is important, because clinical tools must ultimately perform outside narrowly selected research cohorts. Any published findings should therefore not be interpreted as universal evidence from machine learning in microbiome research; rather, they indicate limited suggestions for the specific datasets, prediction tasks.
Impact of restricting to a Taxonomy Rank
A follow up exploration using quintile-based categories filtered to specific taxonomy ranks resulted in the following accuracy.
Phylum: 0.73 over 31 dimensions
Class: 0.73 over 61 dimensions
Order: 0.73 over 123 dimensions
Family: 0.64 over 268 dimensions
Genus: 0.52 over 524 dimensions
Species: 0.46 over 795 dimensions
In general, as the number of vectors (taxonomies) increases, the reported accuracy decrease.
Metabolite-based analysis
In earlier work, I found that estimated metabolite profiles were more useful symptom predictors than taxonomic abundance alone. These metabolite estimates were derived using functional inferences based on the Kyoto Encyclopedia of Genes and Genomes (KEGG).
A subsequent analysis using metabolite-based features produced substantially better results. In most scenarios, accuracy exceeded 0.50, and the highest observed accuracy was 0.609. This suggests that inferred functional or metabolic characteristics may contain more clinically relevant predictive information than taxonomic composition alone, at least for the outcomes examined.
Over 2293 dimensions, accuracy ranged from 0.56 to 0.618, a much larger spread then above.
Clinical implications
This produces an important practical dilemma:
Feature type
Primary advantage
Primary limitation
Taxonomic profiles
A large literature describes interventions, dietary factors, and substances associated with changes in particular taxa
Taxonomy showed limited predictive performance in these minimally tuned models
Estimated metabolites
Better predictive performance in this analysis
Comparatively limited evidence identifies interventions that reliably modify specific inferred metabolites
At present, I therefore prefer alternative statistical models and taxonomic features for generating practical suggestions, largely because the supporting intervention literature is more extensive. Although retail microbiome-testing companies may indeed use machine-learning methods, I remain cautious about the predictive accuracy and clinical utility achieved by their proprietary models. Claims of machine-learning capability may be commercially attractive, but the relevant question is whether these approaches produce reproducible, clinically meaningful improvements for clients. Peer-reviewed evidence demonstrating such benefit remains the standard needed to support those claims.
At this time of writing, there were 555 users in the last year uploaded to the Microbiome Prescription citizen-science platform. 326 of these users have done two or more uploads in the same year or a 59% repeat rate. This suggests that the suggestions provided were sufficiently beneficial that about 60% of users did a repeat test to get new suggestions.
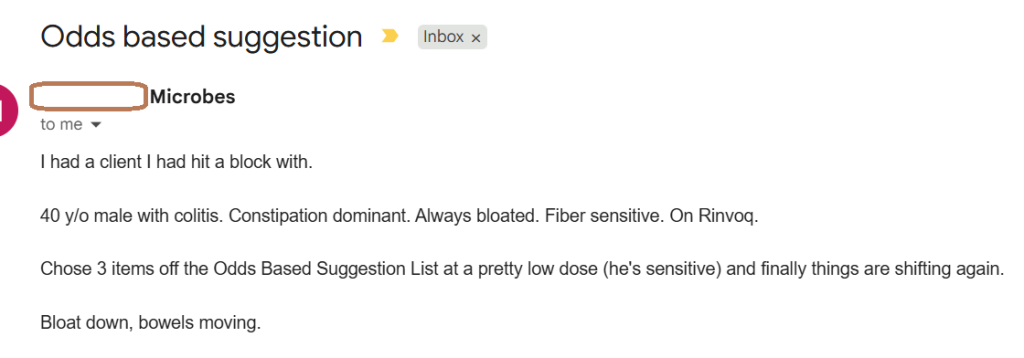
It is an old classic, Ranged Odds-Ratios. In published literature, you will find the odds of getting lung cancer ranged against the number of cigarettes smoked daily. A morning email shows that it can work for seasoned medical professionals who have tried all of the usual approaches without success. I have seen it dropped a hypertension person drop their systolic blood pressure by 30 mmHg in just over a week.
Recent Comments