There are two key differences that needs to be understood
Difference in numbers reported (of bacteria and percentiles)
Will the suggestions change?
Comparison of Results: Thorne to Biomesight
The samples were only a few weeks apart, so similar data. The ratio of bacteria reporting is 6x more for Thorne than Biomesight, so the expectation would be similar shifts for most of the others.
Key Difference: Bacteria Percentiles come from Thorne, the other percentiles are computed against a composite of other samples (until we get sufficient samples). The Conditions, Enzymes and Compound estimates are likely unreliable (we compare against all tests and not other samples from the same procession) and we will ignore in this analysis.
Many of the criteria are identical between tests: Outside Range for JasonH, Medivere, Metagenomics , MyBioma, Nirvana/CosmosId and XenoGene. So for people using those criteria — there is no difference between the tests.
The Bacteria over 90% and Bacteria under 10% are a simple statistic to understand. 10% should be under 10% and 10% above the 90%ile to have a balance microbiome.
With Thorne we have 3226 bacteria and true randomness then you would expect around 322 in each group. We find 239 over 90%, close, but a whopping 1577 under 10% — that 48% of all bacteria, not 10%!!! In other words, we have a massive number of different bacteria at low levels. It is not a problem of a few bacteria being too high (which is a common belief about gut dysfunction), but many only have token amounts.
For Biomesight, we have 503, and thus would expect 50 and 50. For over 90%ile, we have just 25, and for under 10%, 108 bacteria. The high %ile is just 50% of expected and 200% of expected for low with Biomesight; Thorne is just 75% of expected for high, but a massive 489% of expected for low.
Criteria
Thorne Sample
Biomesight
Bacteria Reported By Lab
3226
503
Bacteria Over 99%ile
193
10
Bacteria Over 95%ile
212
18
Bacteria Over 90%ile
239
25
Bacteria Under 10%ile
1577
108
Bacteria Under 5%ile
1411
44
Bacteria Under 1%ile
1106
3
Different Labs – Items Skipped
Pathogens
162
34
Outside Range from JasonH
6
6
Outside Range from Medivere
16
16
Outside Range from Metagenomics
7
7
Outside Range from MyBioma
5
5
Outside Range from Nirvana/CosmosId
17
17
Outside Range from XenoGene
35
35
Outside Lab Range (+/- 1.96SD)
189
8
Outside Box-Plot-Whiskers
685
27
Outside Kaltoft-Møldrup
1753
91
Condition Est. Over 99%ile
6
6
Condition Est. Over 95%ile
15
7
Condition Est. Over 90%ile
24
10
Enzymes Over 99%ile
93
10
Enzymes Over 95%ile
673
118
Enzymes Over 90%ile
1131
647
Enzymes Under 10%ile
312
150
Enzymes Under 5%ile
262
75
Enzymes Under 1%ile
183
12
Compounds Over 99%ile
230
100
Compounds Over 95%ile
498
463
Compounds Over 90%ile
684
606
Compounds Under 10%ile
1350
599
Compounds Under 5%ile
1336
580
Compounds Under 1%ile
1324
569
Comparison of Results: Thorne to Ombre
The Bacteria over 90% and Bacteria under 10% are a simple statistic to understand. If you have 3226 bacteria and true randomness then you would expect around 322 in each group.
For Ombre we would expect 59 over 90%ile and under 10%ile. close. We have 22 or 37% of expected for low %ile and 117 or 200% of expected for low percentile.
Many of the criteria are identical between tests: Outside Range for JasonH, Medivere, Metagenomics , MyBioma, Nirvana/CosmosId and XenoGene. So for people using those criteria — there is no difference between the tests.
Criteria
Thorne Sample
Ombre
Bacteria Reported By Lab
3226
588
Bacteria Over 99%ile
193
2
Bacteria Over 95%ile
212
10
Bacteria Over 90%ile
239
22
Bacteria Under 10%ile
1577
117
Bacteria Under 5%ile
1411
67
Bacteria Under 1%ile
1106
6
Different Labs – Items Skipped
Pathogens
162
34
Outside Range from JasonH
7
7
Outside Range from Medivere
14
14
Outside Range from Metagenomics
5
5
Outside Range from MyBioma
8
8
Outside Range from Nirvana/CosmosId
18
18
Outside Range from XenoGene
46
46
Outside Lab Range (+/- 1.96SD)
189
5
Outside Box-Plot-Whiskers
685
34
Outside Kaltoft-Møldrup
1753
129
Condition Est. Over 99%ile
6
0
Condition Est. Over 95%ile
15
0
Condition Est. Over 90%ile
24
0
Enzymes Over 99%ile
93
0
Enzymes Over 95%ile
673
9
Enzymes Over 90%ile
1131
101
Enzymes Under 10%ile
312
165
Enzymes Under 5%ile
262
65
Enzymes Under 1%ile
183
2
Compounds Over 99%ile
230
38
Compounds Over 95%ile
498
236
Compounds Over 90%ile
684
332
Compounds Under 10%ile
1350
248
Compounds Under 5%ile
1336
159
Compounds Under 1%ile
1324
33
My personal opinion is that Thorne is better because the more bacteria reported, the greater the statistical significance of over and under representation. On the positive side, all three samples agree on the shifts of bacteria patterns
Analysis
The distribution continues to match a common pattern with ME/CFS microbiomes, an over abundance of low percentile bacteria. This is also seen with the prior Biomesight sample. This shift is made much stronger with Thorne because more genus and species are reported. It also emphasis the shifts seen above.
Percentile
Genus
Species
0 – 9
417
628
10 – 19
85
82
20 – 29
60
85
30 – 39
42
69
40 – 49
34
32
50 – 59
59
339
60 – 69
26
60
70 – 79
16
28
80 – 89
15
31
90 – 99
21
142
Thorne Report
Percentile
Genus
Species
0 – 9
24
33
10 – 19
32
37
20 – 29
15
23
30 – 39
9
11
40 – 49
9
16
50 – 59
8
14
60 – 69
8
9
70 – 79
10
17
80 – 89
7
15
90 – 99
6
10
Biomesight Report
Treatment Dilemma
The usual algorithm is to increase bacteria with low percentiles and decrease those with high percentiles. When you have a huge numbers of low percentile then the question arises: Do you really want to increase these, or do you want to eliminate them entirely to get them off the radar? It is a valid question, but to do that, we have to make increase/eliminate suggestions on 417 genus. That is not practical (given the sparseness of data and limited knowledge of so many genus). My working hypothesis is that keeping to the usual algorithm is the best way to go. Let the bacteria make the determination of winners and losers.
Going Forward
I am going to build two consensus reports. One for Thorne and one for the latest Biomesight, then use the “Uber Consensus” report on the Multiple Samples tab. The purpose is to see whether there are really significant differences in suggestions between the two sample reports.
Percentile in top or bottom 10% Thorne: 1508 bacteria,BiomeSight: 130 bacteria
The results had 581 suggestions. I did a Pivot tables of Take Counts against Avoid Counts to visualize the similarities between each set of suggestions going into the uber suggestions. I read the pivot table below as indicating that the suggestions were equivalent with 73 items being to Take with no Avoid, and a further 72 items with just 1 avoid. We have lots of choices in agreement
The absence of most Lactobacillus is not surprising because they are hostile to Escherichia Coli. My pivot conference report from 1998 had this bacteria being low in ME/CFS patients. With Thorne, we can get actual numbers (16s numbers for Escherichia Coli are questionable). This person Thorne Results is at the 27%ile for Escherichia and 29%ile for Escherichia Coli, which is consistent with that conference report and the KEGG computation for probiotics.
Out of interest, I looked for the %ile on the Thorne results of the consensus suggested probiotics:
Having the actual percentiles for the strains used in probiotics allows us to tune the suggestions. In this case, we should skip any probiotics with bacillus subtilis or clostridium butyricum. There is no point in taking them. On the other side, you have confirmation that the suggested probiotics are likely to have an impact. I give the Thorne results a big 👍 because you can actually determine the probiotics that you likely not benefit from. The 16s results only report a few probiotic species (with questionable accuracy).
The Extras from the Thorne Results
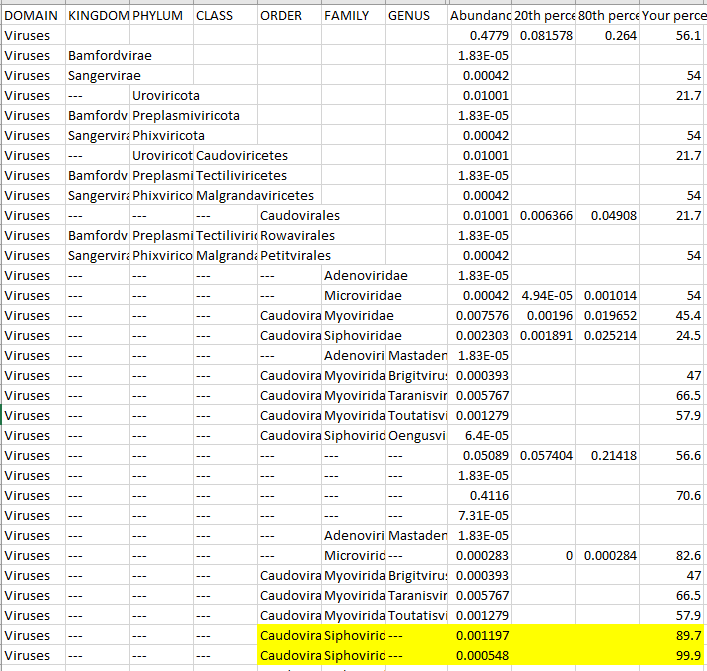
This person did not see the next data on Thorne’s Web Site — but it was in the data CSV file to upload. The virus count with a few having percentiles. The ones without percentiles are rare ones without data.
Virus
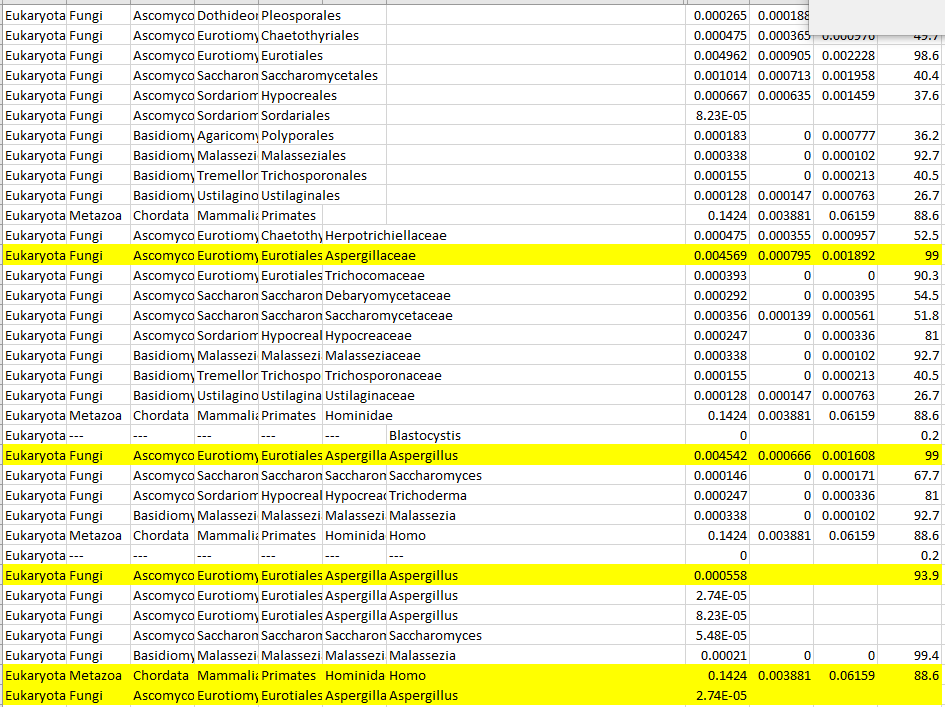
And Fungi too!
For both of these sets of data, values over 90% should be researched. Fungi are of special concern because they can both be treated often and may also indicate a mold issue around the person.
User Feedback
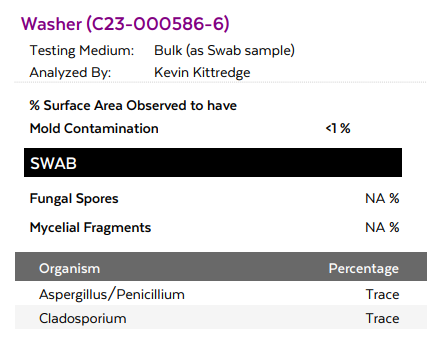
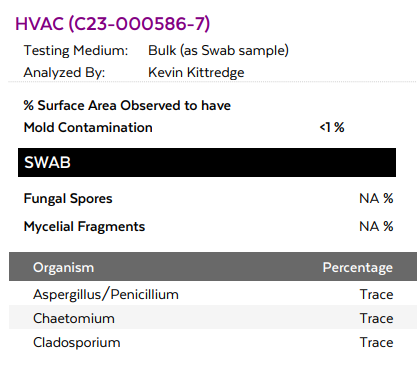
Thanks Ken! .. and yikes . Mold is my nemesis. I’ve been trying to figure if I’ve had mold / moldy house for years. I did an ermi for the entire house and got a 2 which is really low. Recently I did an air test all around the house and it was pretty low minus a car which I knew was an issue and I’ve been trying to avoid. I’m trying to decipher if it’s a past issue and I can’t detox or current
Attached is my air test.
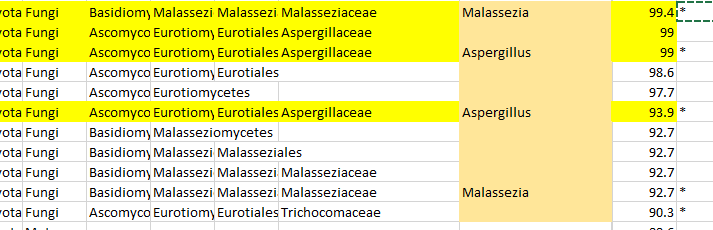
Question: yellow highlights on Thorne. Those were 90%+ , there were some non highlighted 90% + results. Should I only research the ones you highlighted?
I should have a new mold urine test result coming too which I’ll send your way once I get it!
Answers: As a general and very rough rule, count the number of items reported (Virus: 35, Fungi:50). Take this number and multiple by a percentile – say 99%ile, and round up. For Virus and Fungi it is 1. This is the number of false positives that would be expected with 99% or higher.
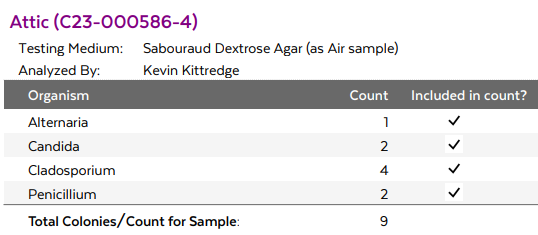
You appear to have an issue. Your mold test fortunately identifies the genus and where it is located. The HVAC and washing machine hints that it is brought into the house, likely on clothes. The attic appears free of the ones that you are high in. I noticed that Malassezia is not reported in the mold test.
Bottom Line
IMHO, getting a Thorne sample is a definite should do at least once. Why? some of your issues may be fungi or virus related. The difference for suggestions of using Thorne, BiomeSight or Ombre is slight. The differences are reasonable given the sparseness of the data that we have for suggestions.
Postscript – and Reminder
I am not a licensed medical professional and there are strict laws where I live about “appearing to practice medicine”. I am safe when it is “academic models” and I keep to the language of science, especially statistics. I am not safe when the explanations have possible overtones of advising a patient instead of presenting data to be evaluated by a medical professional before implementing.
I cannot tell people what they should take or not take. I can inform people items that have better odds of improving their microbiome as a results on numeric calculations. I am a trained experienced statistician with appropriate degrees and professional memberships. All suggestions should be reviewed by your medical professional before starting.
The answers above describe my logic and thinking and is not intended to give advice to this person or any one. Always review with your knowledgeable medical professional.


Recent Comments