Readers have expressed interest in some of my work being open sourced. The actual site would be described as an “evolved beta”, rather than subject people to quirks and kludges, I am proceeding as a redesign of a V.2 product. If you are interested, please FOLLOW (top left) to get updates as they happen.
The Repository is at:
https://github.com/Lassesen/Microbiome2
The first item that I want to get up for discussion is the core database tables – for review and comments. The Database diagram is shown below.
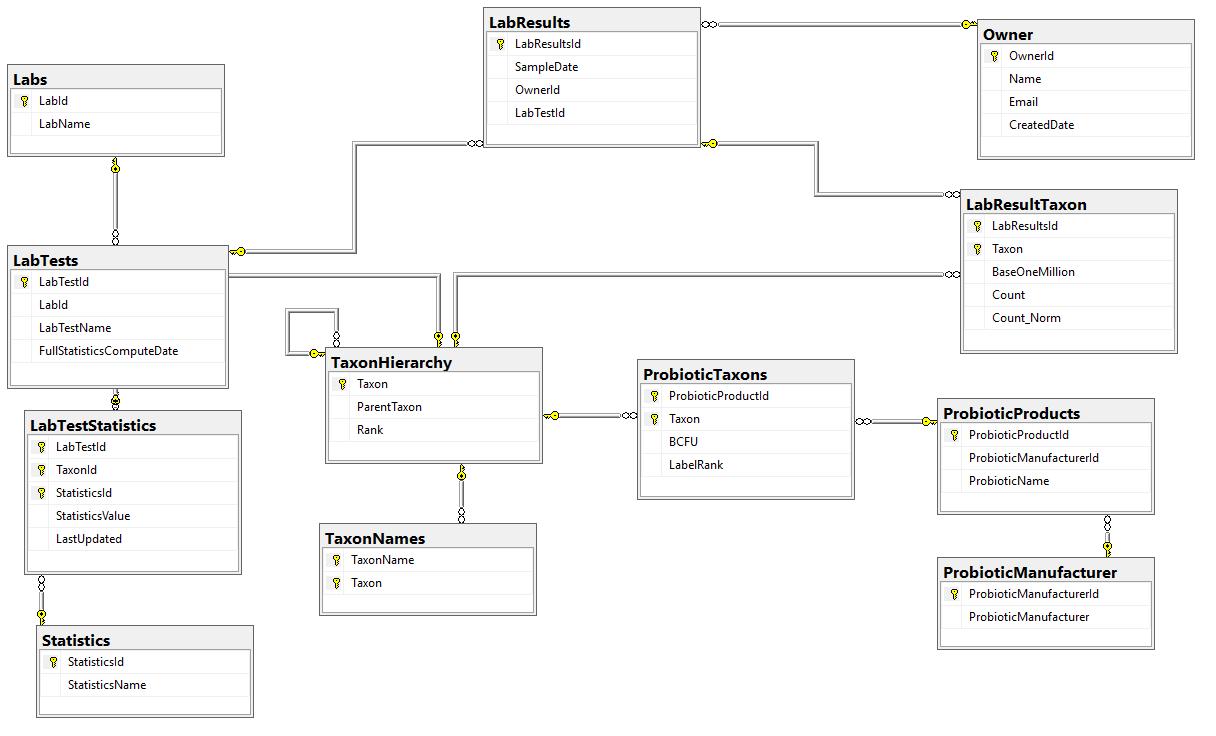
A few quick notes:
- Statistics were done as a separate table instead of the typical additional columns because trying multiple quantiles is seen as the way to go for non-parametric analysis. This becomes open ended with items like “Q2_18” – Quantile 2 of a 18 way quantization being possible. With that type of breakdown, we want to know if we are dealing with stale date, so we need to know the computation date.
Next post will deal with populating TaxonHierarchy and TaxonNames from ncbi downloads.
Hi Ken, it’s me again (sorry).
I’m trying to learn how to use Krona charts to help a friend who is very severely ill with ME CFS. She just uploaded her Thryve results on this site.
I’m trying to understand how to interpret her results. How can I tell where the problem areas are i.e., overgrowth v/s undergrowth. I need to compare her results with a typical healthy microbiome (to make sense of it)….which I understand is challenging because there are so many versions of what a “healthy microbiome” may be…..depending on a range of variables (geographical location, diet, ethnicity, lifestyle etc)
How can I understand these results and identify possible problem areas?
Thanks a lot,
Gaurav
The best starting point is this chart (My Biome View)…. using demo ID below
http://microbiomeprescription.azurewebsites.net/v2/TaxonQuantiles?sampleid=1234567
It does not adjust for all of those factors, instead — it shows where compared to all of the data we have, what values are outliers.
The second approach is to … Email me the sampleId, with your permission I will do a step by step youtube walkthru using her data (but not name of course)…. If you care to also include her symptoms (most troublesome at the top of the list) that would help with the walkthru
Ken\at\Lassesen\com
Hi Ken, thanks a ton for your reply 🙂
I’m very grateful indeed for your offer to help. Very very kind of you
I will mail my friend’s lab results and symptoms to you. She is far too severe at the moment to understand the complexities.
I had a glance at her results and given my limited knowledge, I think there’s a definite dysbiosis…..among other possible problems.
I wish I could get a lab test too, but have no labs on my continent. Someone just told me Thryve does international collections, but I think the transit time and transit storage conditions may affect the sample quality and the results. So I’m not sure if the results may be reliable enough, but will see.
Thanks again. Much appreciated.
Sincerely,
Gaurav
Where in the world are you located. There are several european providers and australian providers.
You may wish to inquire at various Universities in your country…. they may be willing to do some for free…