A data science technique that has been very good in identifying which bacteria is associated with symptoms is described below.
How many bacteria do we see when we have a bacteria
Not having a specific bacteria is normal. Instead of including these in our analysis, we include only sample with some of a bacteria. Once we have all of the samples with a specific bacteria, we look at the data for it.
Let us look at: Streptococcus gordonii (10.86% of Samples) species as a starting point. We can chart each observation and see the curve shown below:
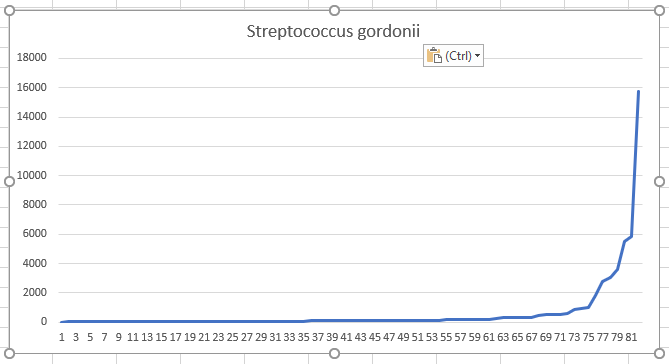
We now divide this into 4 equal size quarters (called quartiles) and find the lower and upper bounds:
- quartiles 1: 4 – 41
- quartiles 2: 21 – 95
- quartiles 3: 98 – 207
- quartiles 4: 269 – 15774
Note that the number of the people in each range are the same. The size of the ranges are very different. We are not dealing with bell-curve like data.
Applying this to symptoms
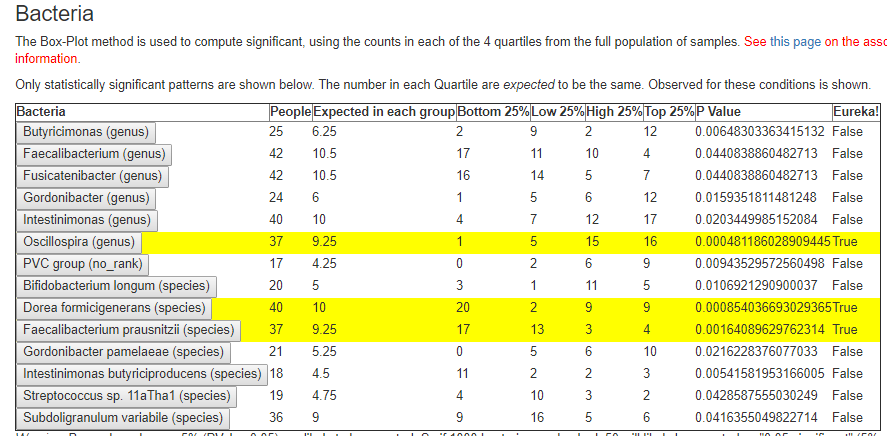
We now look at some symptom, for example: Post-exertional malaise: Physically tired after minimum exercise. And we get a table of how many falls into each quartile for people reporting this symptom.
If there is no relationship, we expect the percentage in each quartile to be like that of everyone taken together as a group. Imagine flipping a 4 sided dice – we toss it hundreds of time and record how often each side appears. If the counts are radically different, and we have enough tosses, then we suspect that the dice is bias, or in this case the bacteria is associated with the condition.
For Oscillospira, I peeked below the page and see:
- quartiles 1: 1-200
- quartiles 2: 201-492
- quartiles 3: 493 – 1240
- quartiles 4: above 1240
with a chart shown below for the entire population. The average is 1311.
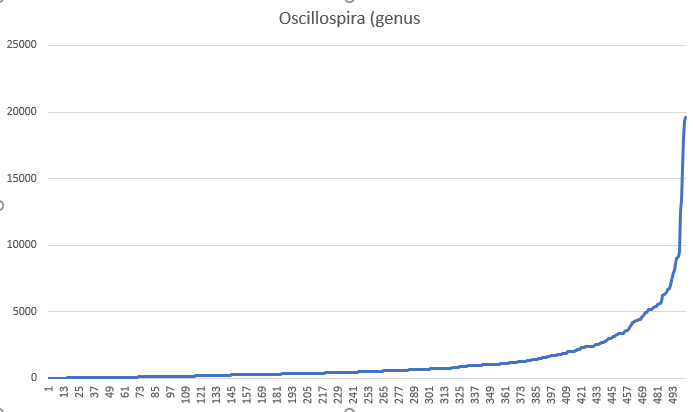
In both of these examples, we see a very shifted (skewed) distribution of the numbers that makes comparing averages unlikely to find relationships.
Bottom Line
Using symptoms with microbiome results has found thousands of relationships when the quartile approach is used.
Recent Comments